Related Plugins and Tags

QGIS Planet

Small multiples for OD flow maps using virtual layers

In my previous posts, I discussed classic flow maps that use arrows of different width to encode flows between regions. This post presents an alternative take on visualizing flows, without any arrows. This style is inspired by Go with the Flow by Robert Radburn and Visualisation of origins, destinations and flows with OD maps by J. Wood et al.

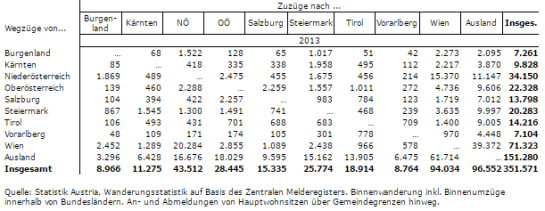
The starting point of this visualization is a classic OD matrix.

migration_raw_data

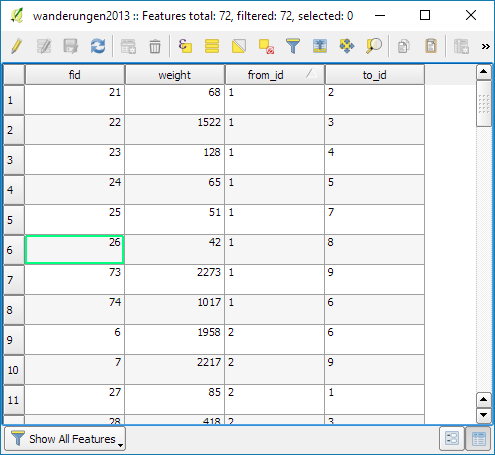
For my previous flow maps, I already converted this data into a more GIS-friendly format: a Geopackage with lines and information about the origin, destination and strength of the flow:

migration_attribute_table

In addition, I grabbed state polygons from Natural Earth Data.

At this point, we have 72 flow features and 9 state polygon features. An ordinary join in the layer properties won’t do the trick. We’d still be stuck with only 9 polygons.

Virtual layers to the rescue!

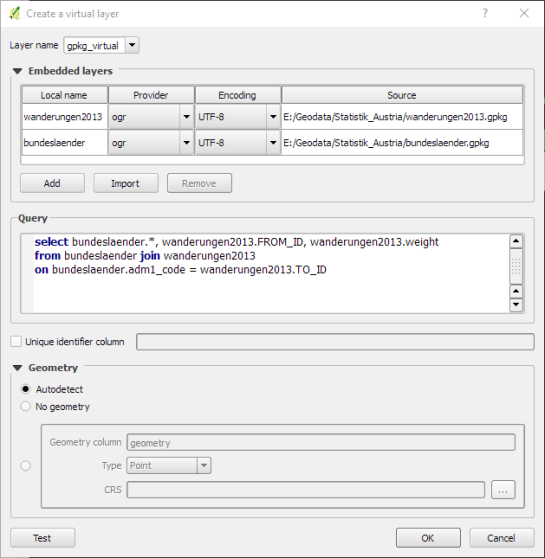
The QGIS virtual layers feature (Layer menu | Add Layer | Add/Edit Virtual Layer) provides database capabilities without us having to actually set up a database … *win!*

Using a classic SQL query, we can join state polygons and migration flows into a new virtual layer:

virtual_layer

The resulting virtual layer contains 72 polygon features. There are 8 copies of each state.

Now that the data is ready, we can start designing the visualization in the Print Composer.

This is probably the most manual step in this whole process: We need 9 map items, one for each mini map in the small multiples visualization. Create one and configure it to your liking, then copy and paste to create 8 more copies.

I’ve decided to arrange the map items in a way that resembles the actual geographic location of the state that is represented by the respective map, from the state of Vorarlberg (a proud QGIS sponsor by the way) in the south-west to Lower Austria in the north-east.

To configure which map item will represent the flows from which origin state, we set the map item ID to the corresponding state ID. As you can see, the map items are numbered from 1 to 9:

small_multiples_print_composer_init

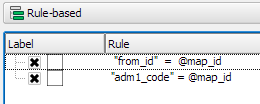
Once all map items are set up, we can use the map item IDs to filter the features in each map. This can be implemented using a rule based renderer:
small_multiples_style_rules

The first rule will ensure that the each map only shows flows originating from a specific state and the second rule will select the state itself.

We configure the symbol of the first rule to visualize the flow strength. The color represents the number number of people moving to the respective district. I’ve decided to use a smooth gradient instead of predefined classes for the polygon fill colors. The following expression maps the feature’s weight value to a shade on the Viridis color ramp:

ramp_color( 'Viridis',
  scale_linear("weight",0,2000,0,1)
)

You can use any color ramp you like. If you want to use the Viridis color ramp, save the following code into an .xml file and import it using the Style Manager. (This color ramp has been provided by Richard Styron on rocksandwater.net.)

<!DOCTYPE qgis_style>
<qgis_style version="0">
  <symbols/>
    <colorramp type="gradient" name="Viridis">
      <prop k="color1" v="68,1,84,255"/>
      <prop k="color2" v="253,231,36,255"/>
      <prop k="stops" v="0.04;71,15,98,255:0.08;72,29,111,255:0.12;71,42,121,255:0.16;69,54,129,255:0.20;65,66,134,255:0.23;60,77,138,255:0.27;55,88,140,255:0.31;50,98,141,255:0.35;46,108,142,255:0.39;42,118,142,255:0.43;38,127,142,255:0.47;35,137,141,255:0.51;31,146,140,255:0.55;30,155,137,255:0.59;32,165,133,255:0.62;40,174,127,255:0.66;53,183,120,255:0.70;69,191,111,255:0.74;89,199,100,255:0.78;112,206,86,255:0.82;136,213,71,255:0.86;162,218,55,255:0.90;189,222,38,255:0.94;215,226,25,255:0.98;241,229,28,255"/>
    </colorramp>
  </colorramps>
</qgis_style>

If we go back to the Print Composer and update the map item previews, we see it all come together:

small_multiples_print_composer

Finally, we set title, legend, explanatory texts, and background color:

migration

I think it is amazing that we are able to design a visualization like this without having to create any intermediate files or having to write custom code. Whenever a value is edited in the original migration dataset, the change is immediately reflected in the small multiples.


New major release: GRASS GIS 7.2.0 available

We are pleased to announce the stable release of GRASS GIS 7.2.0

What’s new in a nutshell

After almost two years of development the new stable major release GRASS GIS 7.2.0 is available. It provides more than 1950 stability fixes and manual improvements compared to the former stable release version 7.0.5. The new version includes a series of new modules to analyse raster and vector data along with new temporal algebra functionality.More than 50 new addons are also available. A summary of the new features is available at New Features in GRASS GIS 7.2.

About GRASS GIS 7: Its graphical user interface supports the user to make complex GIS operations as simple as possible. The updated Python interface to the C library permits users to create new GRASS GIS-Python modules in a simple way while yet obtaining powerful and fast modules. Furthermore, the libraries were again significantly improved for speed and efficiency, along with support for huge files. A lot of effort has been invested to standardize parameter and flag names. Finally, GRASS GIS 7 comes with a series of new modules to analyse raster and vector data, along with a full temporal framework. For a detailed overview, see the list of new features. As a stable release series, 7.2.x enjoys long-term support.

Binaries/Installer download:

Source code download:

More details:

See also our detailed announcement:

First time users may explore the first steps tutorial after installation.

About GRASS GIS

The Geographic Resources Analysis Support System (https://grass.osgeo.org/), commonly referred to as GRASS GIS, is an Open Source Geographic Information System providing powerful raster, vector and geospatial processing capabilities in a single integrated software suite. GRASS GIS includes tools for spatial modeling, visualization of raster and vector data, management and analysis of geospatial data, and the processing of satellite and aerial imagery. It also provides the capability to produce sophisticated presentation graphics and hardcopy maps. GRASS GIS has been translated into about twenty languages and supports a huge array of data formats. It can be used either as a stand-alone application or as backend for other software packages such as QGIS and R geostatistics. It is distributed freely under the terms of the GNU General Public License (GPL). GRASS GIS is a founding member of the Open Source Geospatial Foundation (OSGeo).

The GRASS Development Team, December 2016

The post New major release: GRASS GIS 7.2.0 available appeared first on GFOSS Blog | GRASS GIS Courses.

QGIS Atlas Tutorial – Material Design

This is a guest post by Mickael HOARAU @Oneil974

For people who are working on QGIS Atlas feature, I worked on an Atlas version of the last tutorial I have made. The difficulty level is a little bit more consequente then last tutorial but there are features that you could appreciate. So I’m happy to share with you and I hope this would be helpful.

Click to view slideshow.

You can download tutorial here:

Material Design – QGIS Atlas Tutorial

And sources here:

https://drive.google.com/file/d/0B37RnaYSMWAZUUJ2NUxhZC1TNmM/view?usp=sharing


PS : I’m looking for job offers, feel free to contact me on twitter @Oneil974


How to fix a broken Processing model with AttributeError: ‘NoneType’ object has no attribute ‘getCopy’

Broken Processing models are nasty and this error is particularly unpleasant:

...
File "/home/agraser/.qgis2/python/plugins/processing/modeler/
ModelerAlgorithm.py", line 110, in algorithm
self._algInstance = ModelerUtils.getAlgorithm(self.consoleName).getCopy()
AttributeError: 'NoneType' object has no attribute 'getCopy'

It shows up if you are trying to open a model in the model editor that contains an algorithm which Processing cannot find.

For example, when I upgraded to Ubuntu 16.04, installing a fresh QGIS version did not automatically install SAGA. Therefore, any model with a dependency on SAGA was broken with the above error message. Installing SAGA and restarting QGIS solves the issue.


Movement data in GIS: issues & ideas

Since I’ve started working, transport and movement data have been at the core of many of my projects. The spatial nature of movement data makes it interesting for GIScience but typical GIS tools are not a particularly good match.

Dealing with the temporal dynamics of geographic processes is one of the grand challenges for Geographic Information Science. Geographic Information Systems (GIS) and related spatial analysis methods are quite adept at handling spatial dimensions of patterns and processes, but the temporal and coupled space-time attributes of phenomena are difficult to represent and examine with contemporary GIS. (Dr. Paul M. Torrens, Center for Urban Science + Progress, New York University)

It’s still a hot topic right now, as the variety of related publications and events illustrates. For example, just this month, there is an Animove two-week professional training course (18–30 September 2016, Max-Planck Institute for Ornithology, Lake Konstanz) as well as the GIScience 2016 Workshop on Analysis of Movement Data (27 September 2016, Montreal, Canada).

Space-time cubes and animations are classics when it comes to visualizing movement data in GIS. They can be used for some visual analysis but have their limitations, particularly when it comes to working with and trying to understand lots of data. Visualization and analysis of spatio-temporal data in GIS is further complicated by the fact that the temporal information is not standardized in most GIS data formats. (Some notable exceptions of formats that do support time by design are GPX and NetCDF but those aren’t really first-class citizens in current desktop GIS.)

Most commonly, movement data is modeled as points (x,y, and optionally z) with a timestamp, object or tracker id, and potential additional info, such as speed, status, heading, and so on. With this data model, even simple questions like “Find all tracks that start in area A and end in area B” can become a real pain in “vanilla” desktop GIS. Even if the points come with a sequence number, which makes it easy to identify the start point, getting the end point is tricky without some custom code or queries. That’s why I have been storing the points in databases in order to at least have the powers of SQL to deal with the data. Even so, most queries were still painfully complex and performance unsatisfactory.

So I reached out to the Twitterverse asking for pointers towards moving objects database extensions for PostGIS and @bitnerd, @pwramsey, @hruske, and others replied. Amongst other useful tips, they pointed me towards the new temporal support, which ships with PostGIS 2.2. It includes the following neat functions:

  • ST_IsValidTrajectory — Returns true if the geometry is a valid trajectory.
  • ST_ClosestPointOfApproach — Returns the measure at which points interpolated along two lines are closest.
  • ST_DistanceCPA — Returns the distance between closest points of approach in two trajectories.
  • ST_CPAWithin — Returns true if the trajectories’ closest points of approach are within the specified distance.

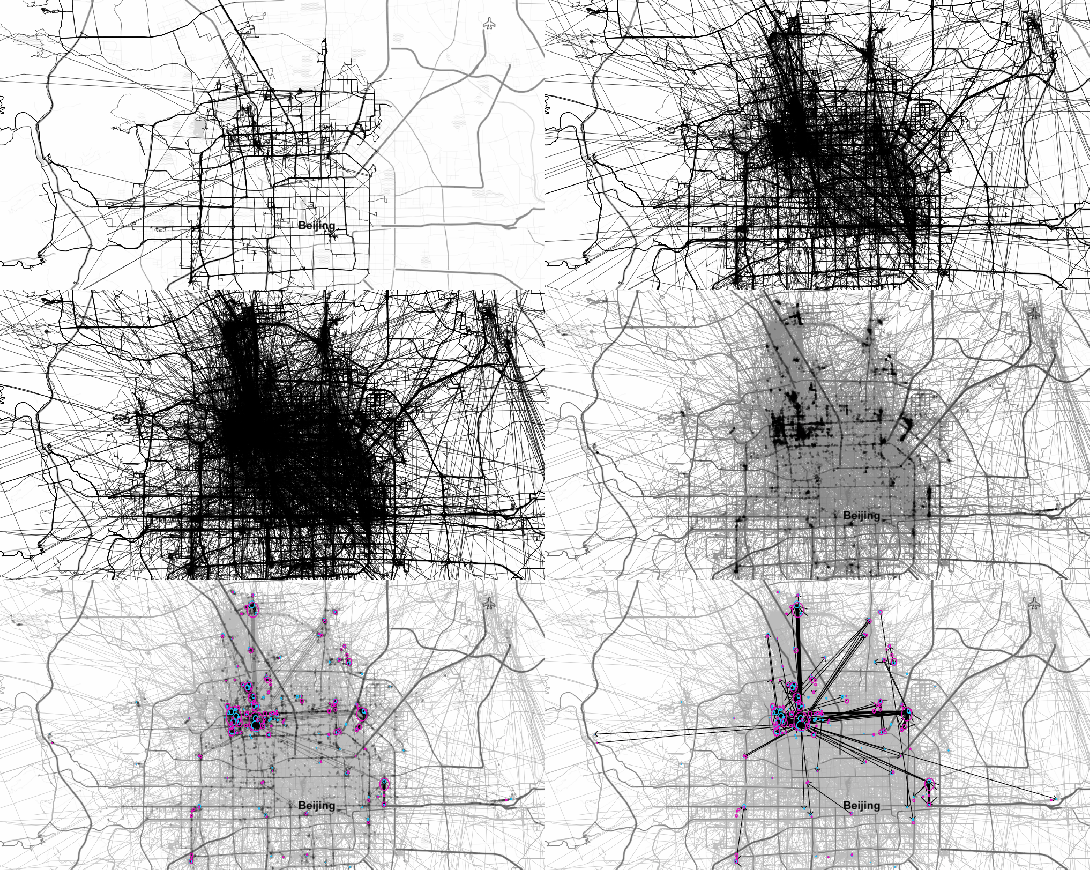
Instead of  points, these functions expect trajectories that are stored as LinestringM (or LinestringZM) where M is the time dimension. This approach makes many analyses considerably easier to handle. For example, clustering trajectory start and end locations and identifying the most common connections:

animation_clusters

(data credits: GeoLife project)

Overall, it’s an interesting and promising approach but there are still some open questions I’ll have to look into, such as: Is there an efficient way to store additional info for each location along the trajectory (e.g. instantaneous speed or other status)? How well do desktop GIS play with LinestringM data and what’s the overhead of dealing with it?


Material design map tutorial for QGIS Composer

This is a guest post by Mickael HOARAU @Oneil974

For those wishing to get a stylized map on QGIS composer, I’ve been working on a tutorial to share with you a project I’m working on. Fan of web design and GIS user since few years, I wanted to merge Material Design Style with Map composer. Here is a tutorial to show you how to make simply a Material Design Map style on QGIS.

Click to view slideshow.

You can download tutorial here:

Tutorial Material Design Map

And sources here:

Sources Material Design Map

An Atlas Powered version is coming soon!


Videos and slides from FOSSGIS & AGIT OSGeo Day

Last week I had the pleasure to attend the combined FOSSGIS, AGIT and GI_Forum conferences in Salzburg. It was a great joint event bringing together GIS user and developers from industry and academia, working with both open source and commercial GIS.

I was particularly impressed by the great FOSSGIS video team. Their tireless work makes it possible to re-watch all FOSSGIS talks (in German).

I also had the pleasure to give a few presentations. Most of all, it was an honor to give the AGIT opening keynote, which I dedicated to Open Source, Open Data & Open Science.

In addition, I also gave one talk related to an ongoing research project on pedestrian routing. It was really interesting to see that other people – in particular from the OSM community – also talked about this problem during FOSSGIS:

(For more details, please see the full paper (OA).)

To wrap up this great week, Astrid Emde, Andreas Hocevar, and myself took the chance to celebrate the 10th anniversary of OSGeo during AGIT2016 OSGeo Day.

And last but not least, I presented an update from the QGIS project with news about the 3.0 plans and a list of (highly subjective) top new features:


Slides & workshop material from #QGISConf2016

If you could not make it to Girona for this year’s QGIS user conference, here’s your chance to catch up with the many exciting presentations and workshops that made up the conference program on May 25-26th:

(Some resources are still missing but they’ll hopefully be added in the coming days.)

Update: Now you can also watch the talks online or even download them.

Thanks to everyone who was involved in making this second QGIS user conference a great experience for all participants!


Better digitizing with QGIS 2.14

Tracing button

If you are using QGIS for digitizing work, you have probably seen the 2.14 Changelog entry for Trace Digitizing. The main reason why this is a really cool new feature is that it speeds up digitizing a lot. When tracing is enabled, the digitizing tools take care to follow existing features (as configured in the snapping options). For a detailed howto and videos check Lutra’s blog.


QGIS 3.0 plans

News about the path to QGIS 3.0 …

QGIS.org blog

qgis-icon-60x60

Ok so quick spoiler here: there is no QGIS 3.0 ready yet, nor will there be a QGIS 3.0 for some time. This article provides a bit more detail on the plans for QGIS 3.0. A few weeks ago I wrote about some of the considerations for the 3.0 release, so you may want to read that first before continuing with this article as I do not cover the same ground here.

lot of consideration has gone into deciding what the approach will be for the development of QGIS 3.0. Unfortunately the first PSC vote regarding which proposal to follow was a split decision (4 for, 3 against, 1 abstention and 1 suggestion for an alternative in the discussion). During our PSC meeting this week we re-tabled the topic and eventually agreed on Jürgen Fischer’s proposal (Jürgen is a QGIS PSC Member and the QGIS Release Manager) by a much more unanimous…

View original post 1,208 more words


Markus Neteler joins the management of mundialis in Bonn

Press release

From March 2016 onwards, Dr. Markus Neteler, a prominent head of the Open Source GIS scene, will join the management board of mundialis GmbH & Co. KG in Bonn, Germany. Founded in 2015, mundialis combines remote sensing and satellite data analysis in the field of Big Data with Open Source WebGIS solutions.

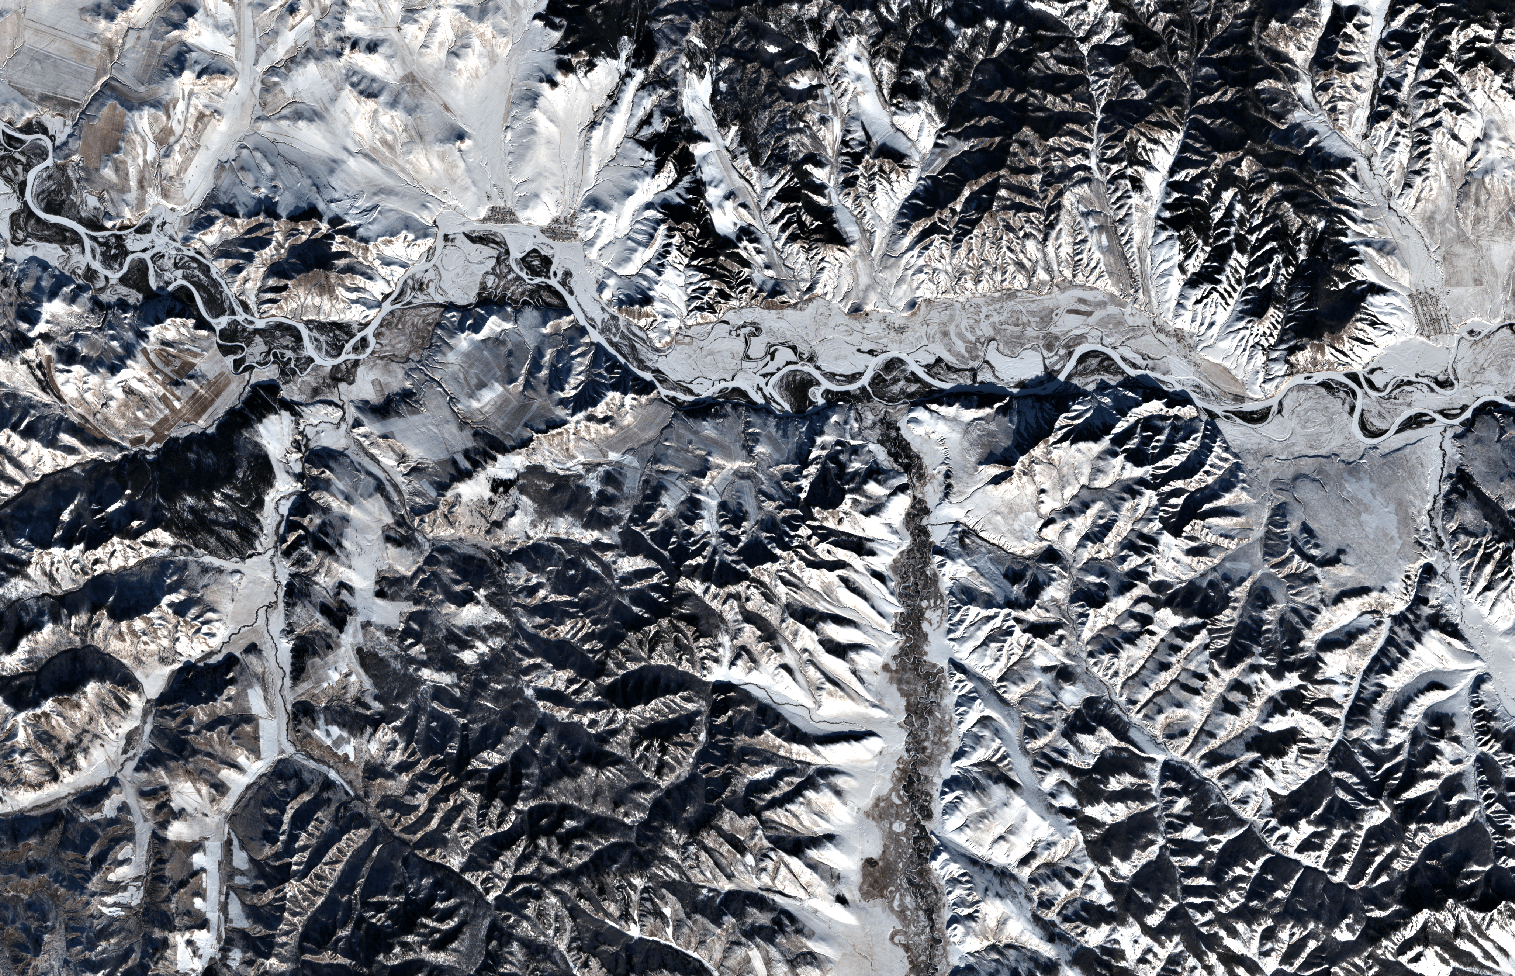
Since 2008, Dr. Neteler was the head of the GIS and remote sensing unit at the Edmund Mach Foundation in Trento (Italy) and worked in this capacity on numerous projects related to biodiversity, environmental and agricultural research. He is also a founding member of the Open Source Geospatial Foundation (OSGeo), a nonprofit organization with headquarters in Delaware (USA), that promotes the development and use of free and open source geographic information systems (GIS). Since 1998 he coordinated the development of the well known GRASS GIS software project, a powerful Open Source GIS that supports processing of time series of several thousand raster, 3D raster or vector maps in a short time. Mongolia as seen by Sentinel-2A

Markus will keep his role as “Mr. GRASS” at mundialis, especially because the company also sees itself as a research and development enterprise that puts its focus on the open source interfaces between geoinformation and remote sensing. Although a new company, mundialis offers more than 50 years of experience in GIS, due to the background of its management. Besides Neteler, there are Till Adams and Hinrich Paulsen, both at the same time the founders and CEOs of terrestris in Bonn, a company that develops Open Source GIS solutions since 2002. These many years of experience in the construction of WebGIS and Geoportal architectures using free software as well as in the application of common OGC standards – are now combined with mundialis’ expertise in the processing of big data with spatial reference and remote sensing data.

Contact: http://www.mundialis.de/

The post Markus Neteler joins the management of mundialis in Bonn appeared first on GFOSS Blog | GRASS GIS Courses.

A new QGIS plugin allows dynamic filtering of values in forms


This plugin has been partially funded (50%) by ARPA Piemonte.

Description

This is a core-enhancement QGIS plugin that makes the implementation of complex dynamic filters in QGIS attribute forms an easy task. For example, this widget can be used to implement drill-down forms, where the values available in one field depend on the values of other fields.

Download

The plugin is available on the official QGIS Python Plugin Repository and the source code is on GitHub QGIS Form Value Relation plugin repository

Implementation

The new “Form Value Relation” widget is essentially a clone of the core “Value Relation” widget with some important differences: When the widget is created:
  • the whole unfiltered features of the related layer are loaded and cached
  • the form values of all the attributes are added to the context (see below)
  • the filtering against the expression happens every time the widget is refreshed
  • a signal is bound to the form changes and if the changed field is present in the filter expression, the features are filtered against the expression and the widget is refreshed

Using form values in the expression

A new expression function is available (in the “Custom” section):
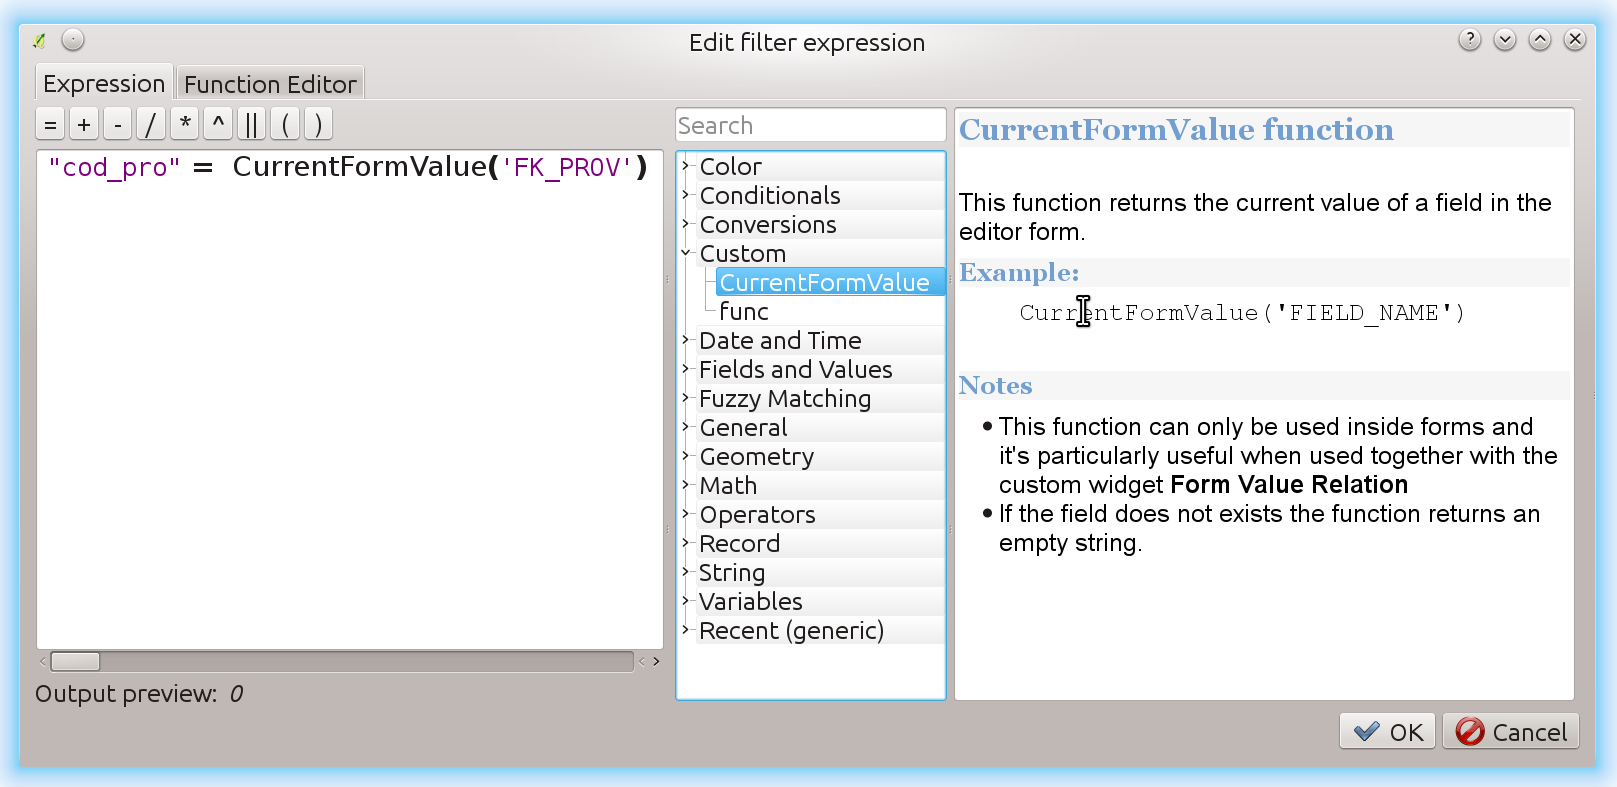
CurrentFormValue('FIELD_NAME')
This function returns the current value of a field in the editor form.

Note

  1. This function can only be used inside forms and it’s particularly useful when used together with the custom widget `Form Value Relation`
  2. If the field does not exists the function returns an empty string.

Visual guide

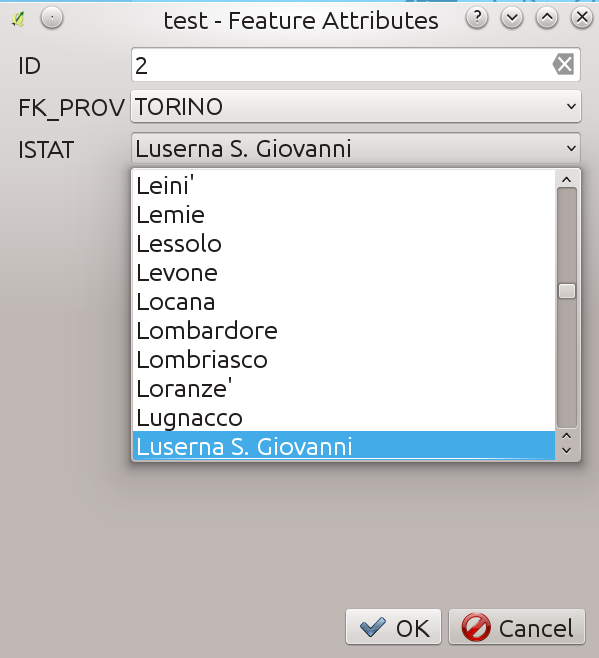
  Download the example project.   This is the new widget in action: changing the field FK_PROV, the ISTAT values are filtered according to the filter expression.
The new widget in action

The new widget drill-down in action

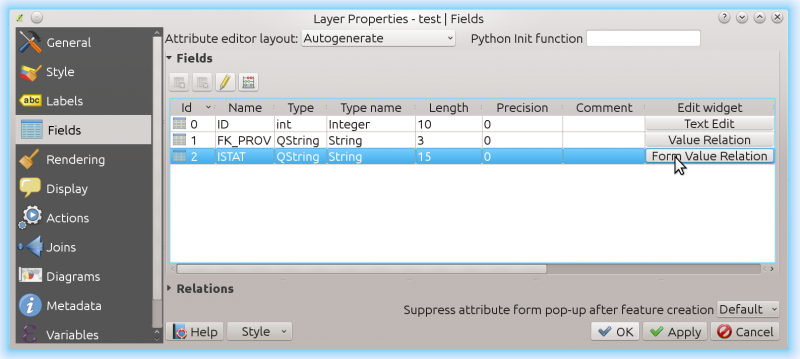
layer_config_fields

Choosing the new widget

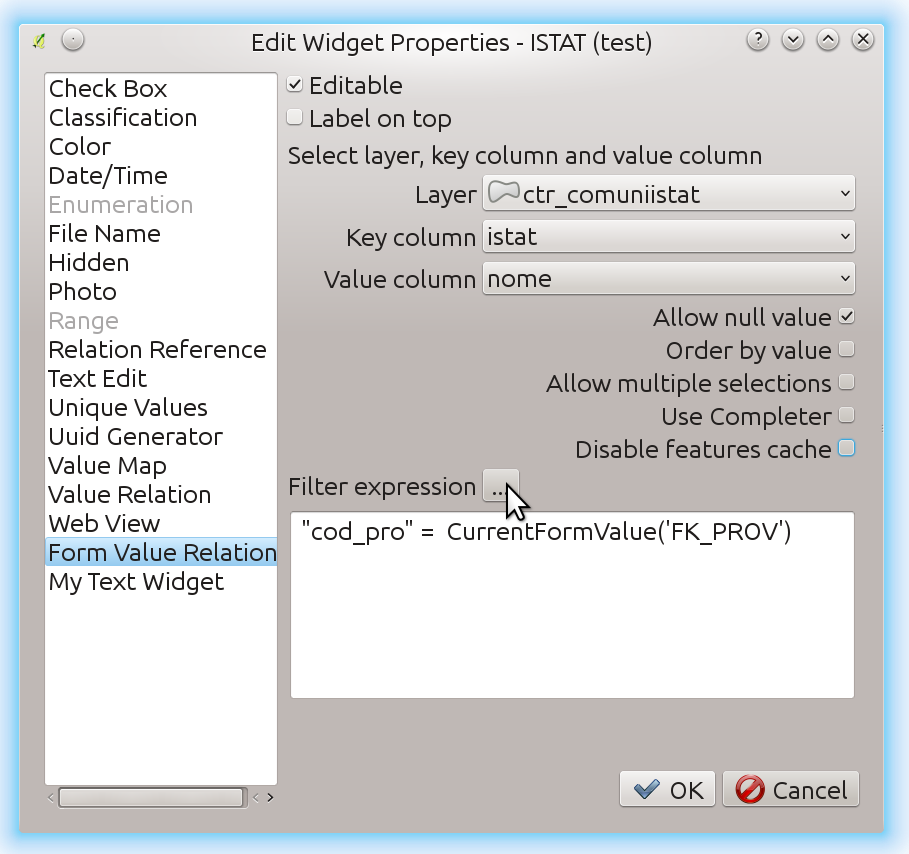
Configuring the widget

Configuring the widget

Configuring the expression

Configuring the expression to read FK_PROV value from the form

News from QGIS HackFest in Las Palmas

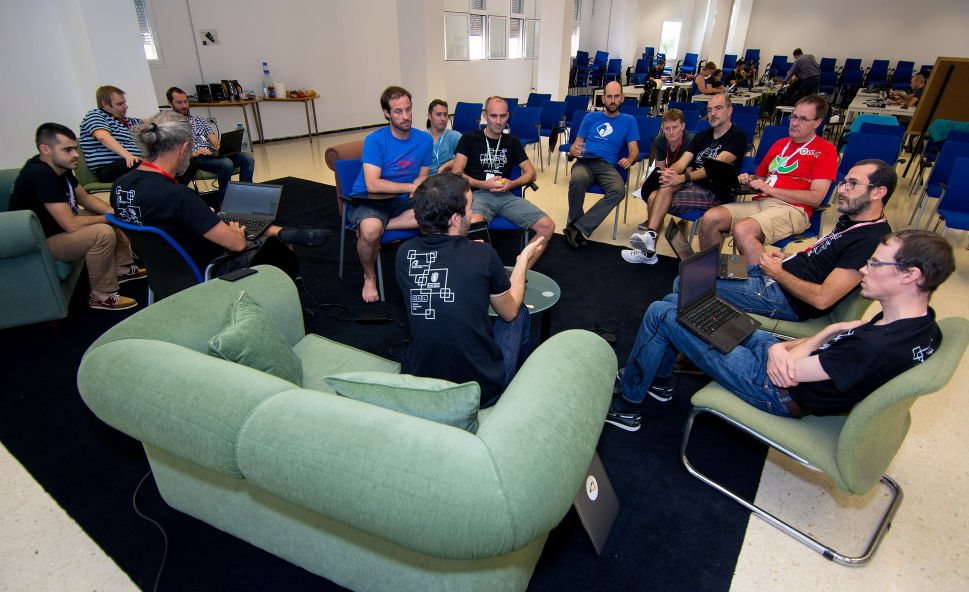
First I wish to thank Pablo & friends for the amazing organization, unfortunately I couldn’t spend more than two full days there, but those two days have been memorable! Here is a picture of one of the most interesting discussions (photo: courtesy of Pablo). QGIS discussion at the developer meeting in Las Palmas An hack fest is an event for writing good code but what it’s really good at is to establish and cultivate relations with other coders, to exchange opinions and ideas and last but not least to have some fun and make new friends.   This time, we have had many interesting presentations and a couple of meetings where we spoke about technical aspects of the project management and infrastructure and about some important challenges, both in terms of code size and economical implications for who relies on it, that a growing project must face.   The latter was something I’ve also been considering for a while: now that pull requests (PR) for new features are coming down the pipeline, we must find a better way to manage their queue by giving a clear and transparent approval path and deadline. This management and approval process cannot rely entirely on volunteer work, the main reason being that most of the times the PR proposers have been paid for that PR and it’s not fair (nor reliable) that the (sometimes hard) job of doing a code review is not rewarded. On the other end, an investor cannot waste its time and money on a project without having a reasonable good chance to see its work eventually land into the core of QGIS.   Hugo (thanks for that!) organized a meeting to discuss this topic, that crosses personal business interests, ethical considerations and personal beliefs to a point that it’s not really easy to discuss in a calm and objective way, despite the premises, the discussion was very interesting and constructive and a QEP that tries to address at least some of this problems is open for discussion right now: https://github.com/qgis/QGIS-Enhancement-Proposals/issues/52   Another topic we’ve been discussing was how to manage python plugin dependencies, we’ve decided to start by adding a new metadata tag called external_deps that’s supposed to contain the PIP install string for the required packages, since PIP will be a builtin in python 3.4, that will probably solve most of our problems when we’ll integrate that into the plugin manager. At the moment the metadata is not documented nor required, but it’s there to allow for experiments.   We didn’t miss the occasion to talk about the ugly bug that affects fTools, not something I’m going to dig into in this post though.   Of course an hack fest is still a good opportunity for squashing bugs and implement new cool features, I’ve been busy mainly on the following topics:

  1. HiDPI screen support for web view widgets (help and plugin manager/installer)
  2. Form relations editing longstanding bugs
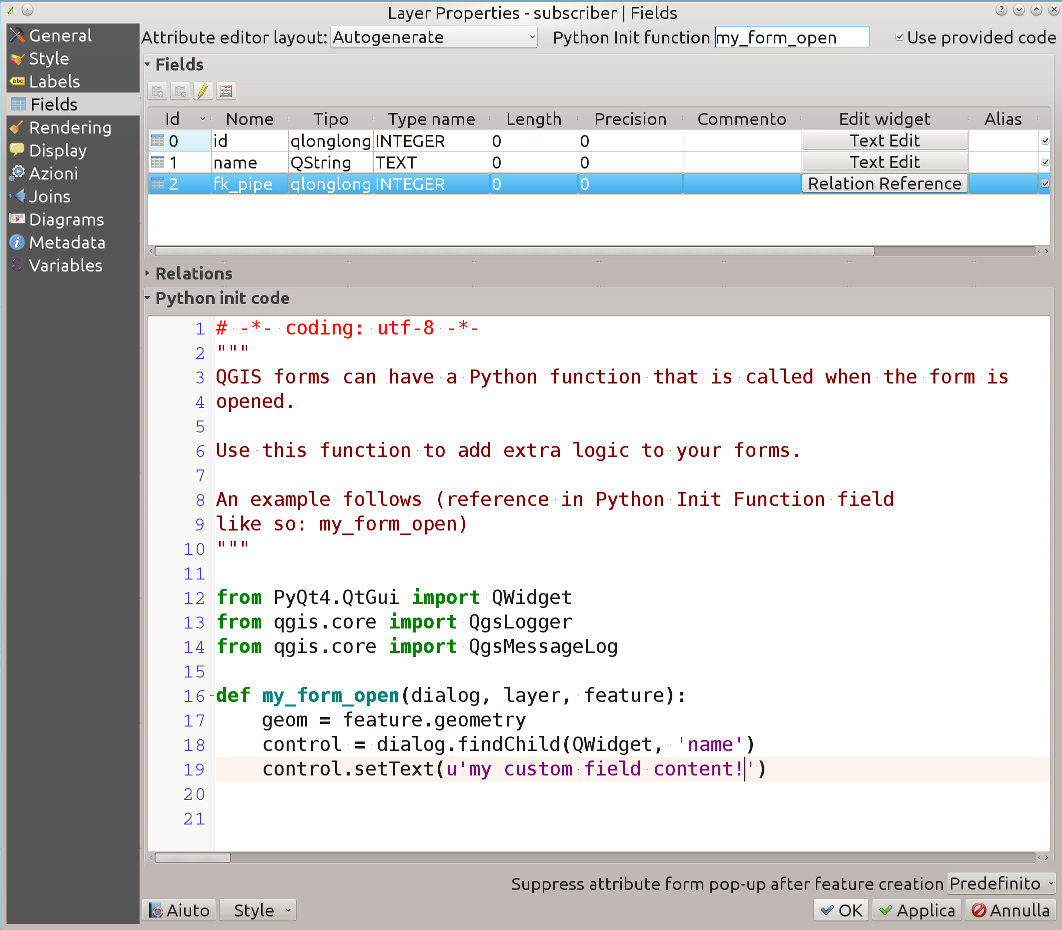
  3. New feature to optionally enter, edit and store Python form init code into the project (and DB), see the picture below
  4. Plugins website maintenance (added new metadata and fixed a few bugs, added an RPC call to export author email for admins)
New QGIS feature to store form init code   Thanks to all participants, to the organizers and to all QGIS sponsors and donors that made this possible!  

Quick webmaps with qgis2web

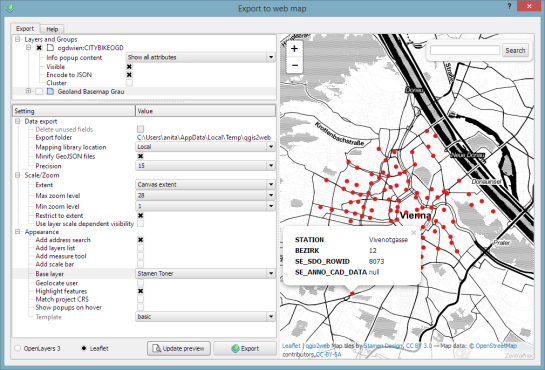
In Publishing interactive web maps using QGIS, I presented two plugins for exporting web maps from QGIS. Today, I want to add an new member to this family: the qgis2web plugin is the successor of qgis-ol3 and combines exports to both OpenLayers3 as well as Leaflet.

The plugin is under active development and currently not all features are supported for both OpenLayers3 and Leaflet, but it’s a very convenient way to kick-off a quick webmapping project.

Here’s an example of an OpenLayers3 preview with enabled popups:

OpenLayers3 preview

OpenLayers3 preview

And here is the same map in Leaflet with the added bonus of a nice address search bar which can be added automatically as well:

Leaflet preview

Leaflet preview

The workflow is really straight forward: select the desired layers and popup settings, pick some appearance extras, and then don’t forget to hit the Update preview button otherwise you might be wondering why nothing happens ;)

I’ll continue testing these plugins and am looking forward to seeing what features the future will bring.


What went on at FOSS4G 2015?

Granted, I could only follow FOSS4G 2015 remotely on social media but what I saw was quite impressive and will keep me busy exploring for quite a while. Here’s my personal pick of this year’s highlights which I’d like to share with you:

QGIS

Marco Hugentobler at FOSS4G 2015 (Photo by Jody Garnett)

Marco Hugentobler at FOSS4G 2015 (Photo by Jody Garnett)

The Sourcepole team has been particularly busy with four presentations which you can find on their blog.

Marco Hugentobler’s keynote is just great, summing up the history of the QGIS project and discussing success factor for open source projects.

Marco also gave a second presentation on new QGIS features for power users, including live layer effects, new geometry support (curves!), and geometry checker.

There has also been an update to QTiles plugin by NextGIS this week.

If you’re a bit more into webmapping, Victor Olaya presented the Web App Builder he’s been developing at Boundless. Web App Builder should appear in the official plugin repo soon.

Preview of Web App Builder from Victors presentation

Preview of Web App Builder from Victors presentation

Geocoding

If you work with messy, real-world data, you’ve most certainly been fighting with geocoding services, trying to make the best of a bunch of address lists. The Python Geocoder library promises to make dealing with geocoding services such as Google, Bing, OSM & many easier than ever before.

Let me know if you tried it.

Mobmap Visualizations

Mobmap – or more specifically Mobmap2 – is an extension for Chrome which offers visualization and analysis capabilities for trajectory data. I haven’t tried it yet but their presentation certainly looks very interesting:


FOSS4G specials at Packt and Locate Press

We are celebrating FOSS4G 2015 in Seoul with great open source GIS book discounts at both Packt and Locate Press. So if you don’t have a copy of “Learning QGIS”, “The PyQGIS Programmer’s Guide”, or “Geospatial Power Tools” yet, check out the following sites:

2


Using TimeManager for WMS-T layers

This is a guest post by Karolina Alexiou (aka carolinux), Anita’s collaborator on the Time Manager plugin.

As of version 2.1.5, TimeManager provides some support for stepping through WMS-T layers, a format about which Anita has written  in the past.  From the official definition, the OpenGIS® Web Map Service Interface Standard (WMS) provides a simple HTTP interface for requesting geo-registered map images from one or more distributed geospatial databases. A WMS request defines the geographic layer(s) and area of interest to be processed. The response to the request is one or more geo-registered map images (returned as JPEG, PNG, etc) that can be displayed in a browser application. QGIS can display those images as a raster layer. The WMS-T standard allows the user of the service to set a time boundary in addition to a geographical boundary with their HTTP request.

We are going to add the following url as the web map provider service: http://mesonet.agron.iastate.edu/cgi-bin/wms/nexrad/n0r-t.cgi

From QGIS, go to Layer>Add Layer>Add WMS/WMST Layer and add a new server and connect to it. For the service we have chosen, we only need to specify a name and the url.

Select the top level layer, in our case named nexrad_base_reflect and click Add. Now you have added the layer to your QGIS project.

To add it to TimeManager as well, add it as a raster with the settings from the screenshot below. Start time and end time have the values 2005-08-29:03:10:00Z and 2005-08-30:03:10:00Z respectively, which is a period which overlaps with hurricane Katrina. Now, the WMS-T standard uses a handful of different time formats, and at this time, the plugin requires you to know this format and input the start and end values in this format. If there’s interest to sponsor this feature, in the future we may get the format directly from the web service description. The web service description is an XML document (see here for an example) which, among other information, contains a section that defines the format, default time and granularity of the time dimension.

add_raster

If we set the time step to 2 hours and click play, we will see that TimeManager renders each interval by querying the web map service for it, as you can see in this short video.

Querying the web service and waiting for the response takes some time. So, the plugin requires some patience for looking at this particular layer format in interactive mode. If we export the frames, however, we can get a nice result. This is an animation showing hurricane Katrina progressing over a 30 minute interval.

whoosh

If you want to sponsor further development of the Time Manager plugin, you can arrange a session with me – Karolina Alexiou – via Codementor.


GRASS GIS 7.0.1 released – 32 years of GRASS GIS

What’s new in a nutshellgrass7_logo_500px

This release addresses some minor issues found in the first GRASS GIS 7.0.0 release published earlier this year. The new release provides a series of stability fixes in the core system and the graphical user interface, PyGRASS improvements, some manual enhancements, and a few language translations.

This release is the 32nd birthday release of GRASS GIS.

New in GRASS GIS 7: Its new graphical user interface supports the user in making complex GIS operations as simple as possible. A new Python interface to the C library permits users to create new GRASS GIS-Python modules in a simple way while yet obtaining powerful and fast modules. Furthermore, the libraries were significantly improved for speed and efficiency, along with support for huge files. A lot of effort has been invested to standardize parameter and flag names. Finally, GRASS GIS 7 comes with a series of new modules to analyse raster and vector data, along with a full temporal framework. For a detailed overview, see the list of new features. As a stable release 7.0 enjoys long-term support.

Source code download:

Binaries download:

More details:

See also our detailed announcement:

  http://trac.osgeo.org/grass/wiki/Grass7/NewFeatures (overview of new stable release series)First time users may explore the first steps tutorial after installation.

About GRASS GIS

The Geographic Resources Analysis Support System (http://grass.osgeo.org/), commonly referred to as GRASS GIS, is an Open Source Geographic Information System providing powerful raster, vector and geospatial processing capabilities in a single integrated software suite. GRASS GIS includes tools for spatial modeling, visualization of raster and vector data, management and analysis of geospatial data, and the processing of satellite and aerial imagery. It also provides the capability to produce sophisticated presentation graphics and hardcopy maps. GRASS GIS has been translated into about twenty languages and supports a huge array of data formats. It can be used either as a stand-alone application or as backend for other software packages such as QGIS and R geostatistics. It is distributed freely under the terms of the GNU General Public License (GPL). GRASS GIS is a founding member of the Open Source Geospatial Foundation (OSGeo).

The GRASS Development Team, July 2015

The post GRASS GIS 7.0.1 released – 32 years of GRASS GIS appeared first on GFOSS Blog | GRASS GIS Courses.

A Processing model for Tanaka contours

If you follow my blog, you’ve most certainly seen the post How to create illuminated contours, Tanaka-style from earlier this year. As Victor Olaya noted correctly in the comments, the workflow to create this effect lends itself perfectly to being automated with a Processing model.

The model needs only two inputs: the digital elevation model raster and the interval at which we want the contours to be created:

Screenshot 2015-07-05 18.59.34

The model steps are straightforward: the contours are generated and split into short segments before the segment orientation is computed using the following code in the Advanced Python Field Calculator:

p1 = $geom.asPolyline()[0]
p2 = $geom.asPolyline()[-1]
a = p1.azimuth(p2)
if a < 0:
   a += 360
value = a

Screenshot 2015-07-05 18.53.26

You can find the finished model on Github. Happy QGISing!


AGIT & GI_Forum 2015 wrap-up

It’s my pleasure to report back from this year’s AGIT and GI_Forum conference (German and English speaking respectively). It was great to meet the gathered GIS crowd! If you missed it, don’t despair: I’ve compiled a personal summary on Storify, and papers (German, English) and posters are available online. Here’s a pick of my favorite posters:

I also had the pleasure to be involved in multiple presentations this year:

QGIS at the OSGeo Day

As part of the OSGeo Day, I had the chance to present the latest and greatest QGIS features for map design in front of a full house:

Routing with OSM

On a slightly different note, my colleague Markus Straub and I presented an introduction to routing with OpenStreetMap covering which kind of routing-related information is available in OSM as well as a selection of different tools to perform routing on OSM.

Solving the “unnamed link” problem

In this talk, I presented approaches to solving issues with route descriptions that contain unnamed pedestrian or cycle paths.

Here you can find the full open access paper: Graser, A., & Straub, M. (2015). Improving Navigation: Automated Name Extraction for Separately Mapped Pedestrian and Cycle Links. GI_Forum ‒ Journal for Geographic Information Science, 1-2015, 546-556, doi:10.1553/giscience2015s546.

Inferring road popularity from GPS trajectories

In this talk, my colleague Markus Straub presented our new approach to computing how popular a certain road is. The resulting popularity value can be used for planning as well as routing.

Here you can find the full open access paper: Straub, M., & Graser, A. (2015). Learning from Experts: Inferring Road Popularity from GPS Trajectories. GI_Forum ‒ Journal for Geographic Information Science, 1-2015, 41-50, doi:10.1553/giscience2015s41.


  • <<
  • Page 7 of 15 ( 292 posts )
  • >>
  • gis

Back to Top

Sustaining Members