Related Plugins and Tags

QGIS Planet

Adding ESRI’s World Hillshade layer to QGIS

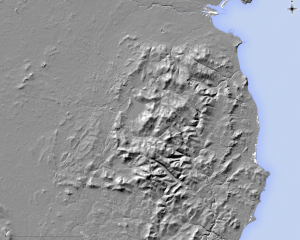
You may have seen my earlier tutorial where I described how to make nice looking hillshaded maps in QGIS using SRTM elevation data. Well, we don’t have to stop with just one hillshade layer on a map, it is possible to overlay multiple hillshades; a procedure that can increase the visual quality and detail. The following image is the hillshade we made before. Once you re-create a hillshade, following the previous tutorial, you can head to the next step (note that brightness and contrast settings may be different due to changes in how QGIS generates and displays hillshades).

We can improve the SRTM hillshade further by adding ESRI’s World Hillshade layer, which uses multi-directional illumination (also called a Swiss Hillshade in tribute to the celebrated Swiss cartographer Eduard Imhof). In addition, World Hillshade has a much higher resolution than SRTM 30m data in some regions of the world, it is 2m for most of the England and Wales, 10m for most of the US, 5m for Spain and 3m for Holland etc. The only drawback is that the style of this layer is somewhat controversial, some love it, some hate it, it looks like it’s illuminated from above, but mixing it with the SRTM hillshade obviates some of it criticised flaws.

To add the World Hillshade layer in QGIS go to the Layer Menu – Add Layer – Add ArcGIS MapServer Layer – click New and add the following URL:

https://services.arcgisonline.com/arcgis/rest/services/Elevation/World_Hillshade/MapServer

Notice QGIS 2.18 no longer needs a plugin to add ESRI layers, it new has this functionality built in. Also, open the url in a browser such as Firefox, it brings up a webpage that describes the layer. We also see links to other other layers. Yes, they can all be added to QGIS by simply taking the URL of the webpage that describe the layer and connecting to it via the ArcGIS MapServer Layer connector.

Name the layer World Hillshade and click Connect, then click and highlight the layer it connects to. Finally, click the Add button to add the layer to the canvas.

Next, we need to adjust the properties of the World Hillshade layer to properly overlay it above the SRTM hillshade layer. Make sure the World hillshade layer is the topmost layer. In the Layers Panel, right click Layer properties and in the window that opens up, click Style (if not visible). Next, change the Layer Blending mode (under color rendering) to Overlay. Adjust the layer’s brightness to around -20 and leave contrast at 0. If you find the scene is still too dark, brighten the SRTM Hillshade by increasing the layer’s brightness. You may also have to change (lower) the Min value of the Min – Max value boxes. Leave the contrast at 0 for the SRTM hillshade. Also, don’t brighten it too much as it might become washed out, loose detail, especially in bright areas. Play around the controls, settings may vary depending on the SRTM data you download and the version of QGIS you use.

Here’s a comparison in Ireland, a ring like structure of hills with a central peak. No, it’s not a meteorite crater. It’s a different kind of geological marvel, the Slieve Gullion Complex and its ring dyke; the deeply eroded remains of a 410 million year old Caledonian volcano. The SRTM hillshade is on the left and World Hillshade + SRTM hillshade is on the right (click on the image, it’s best appreciated full size):

We can see the World Hillshade + SRTM Hillshade layer shows much finer detail. We see a parallel array of roughly north-south orientated lines, these are fractures and faults that cut the Slieve Gullion Complex that were perhaps enhanced by glacial erosion. Also, look carefully, there seems to be some roads meandering across the landscape (hint, bottom of the map and right of the scale bar). You should get even better results with higher resolution World Hillshade data. We also notice that bending SRTM derived hillshade with World Hillshade adds a naturalistic illumination not apparent in multi-directional hillshading. So we have the best of both worlds, a high resolution hillshade and realistic looking illumination.

Hope you found this tutorial helpful.

References:

Baxter, S., 2008. A Geological Field Guide to Cooley Gullion, Mourne & Slieve Croob [pdf]. Geological Survey of Ireland, Dublin. p. 43-53.

Imhof, E. 1982. Cartographic Relief Presentation. Walter de Gruyter GmbH & Co KG.

Create great looking hillshaded maps in QGIS

Wicklow-Topo-original

In this tutorial I will show you how to create a Hillshaded topographic map in QGIS. We will be using Shuttle Radar Topography Mission (SRTM) data, a near global Digital Elevation Model (DEM) collected in February 2000 aboard NASA’s Space Shuttle Endeavour (mission STS-99). The mission used a X-Band mapping radar to measure the Earth’s topography, built in collaboration with the U.S. Jet Propulsion Laboratory, the U.S. National Imagery and Mapping Agency (now the National Geospatial-Intelligence Agency), and the German and Italian space agencies.

The raw radar data has been continuously processed and improved since it was first collected. Countless artefacts have been painstakingly removed and areas of missing data have been filled using alternate data sources. The version we will be using is the 1 Arc-Second Global SRTM dataset, an enhanced 30 meter resolution DEM that was released last year. It is a substantial improvement over the 3 Arc-Second / 90 meter SRTM data previously available for Ireland. SRTM elevation data can be downloaded from the United States Geological Survey’s EarthExplorer website.

When first loaded into QGIS (via Add Raster Layer), the DEM is displayed as a rather uninformative black and white image.

Wicklow-Topo-blackwhite

It is therefore necessary to apply a suitable colour ramp that accentuates topography. While it is possible to create your own colour ramp, or use one of the colour ramps provided by QGIS, superior colour ramps can be downloaded using Etienne Tourigny’s Color Ramp Manager (Plugins – Manage and Install Plugins). After the plugin is added to QGIS, go to the Plugins menu again and choose the Colour Ramp Manager.

In the window that pops up, choose the full opt-city package and click check for update. The plugin will then download the cpt-city library, a collection of over a hundred cartographic gradients (version 2.15). After the package downloads, quit the dialogue.

Back in QGIS, right click the DEM layer to bring up the Layer Properties dialogue. In the Style tab, change the render type from single band grey to single band pseudocolor. Then click new color ramp and new color ramp again, choose the cpt-city color ramp to bring up the cpt-city dialogue. Click topography and choose the sd-a colour ramp. While this is an excellent colour ramp, I find its colours are a bit too strong for my liking.

Still in the Layer Properties dialogue, change the min and max values to match your DEM’s lowest and highest elevations values and click classify, this applies the new colour ramp. Next, change the brightness to 30 and lower the contrast and saturation to -20. Click OK to apply the new style and quit the Layer Properties dialogue.

Wicklow-Topo-noShade

Next we need to create a Hillshade layer from the DEM, a 3D like visual representation of topographic relief. This is achieved via the menu Raster – Analysis – DEM (Terrain models). There is one small catch, the hillshading algorithm assumes the DEM’s horizontal units are in meters (they are decimal degrees). We need to enter a scale correction factor of 111120 (in the Scale ratio vert. units to horiz. box). Once that is all done, select an output path to save the generated hillshade and click OK. Generating a hillshade may take up to a minute depending on the size of your DEM.

Wicklow-Topo-hillshade

After the hillshade is created, open its Layer properties dialogue. Change the min and max values to 125 and 255, increase its brightness to 45 and contrast to 20. Finally, switch the blending mode from normal to multiply. This allows the DEM beneath the hillshade to show though. Click OK to apply the new style.

If you followed these steps correctly you will have created a fine looking topographic map similar to the one below. It’s also possible to create contours but that’s a tutorial for another day.

Wicklow-Topo

Technical note:

There are two hillshading algorithms available in QGIS, one by Horne (1981) and another by Zevenbergen and Thorne (1987). Jones (1998) examined the quality of hillshading algorithms, he found the algorithm of Fleming and Ho€er (1979) is slightly superior to Horne’s (1981) algorithm. Zevenbergen and Thorne’s (1987) algorithm is a derivation of Fleming and Ho€er’s (1979) formula. QGIS uses Horne’s (1981) algorithm by default.

References:

Horn, B.K., 1981. Hill shading and the reflectance map. Proceedings of the IEEE, 69, 14–47.

Jones, K.H., 1998. A comparison of algorithms used to compute hill slope as a property of the DEM [PDF]. Computers & Geosciences, 24, 315–323.

Zevenbergen, L.W. & Thorne, C.R., 1987. Quantitative analysis of land surface topography. Earth surface processes and landforms, 12, 47–56.

  • Page 1 of 1 ( 2 posts )
  • hillshade

Back to Top

Sustaining Members