Folium vs. hvplot for interactive maps of Point GeoDataFrames
In the previous post, I showed how Folium can be used to create interactive maps of GeoPandas GeoDataFrames. Today’s post continues this theme. Specifically, it compares Folium to another dataviz library called hvplot. hvplot also recently added support for GeoDataFrames, so it’s interesting to see how these different solutions compare.
Minimum viable
The following snippets show the minimum code I found to put a GeoDataFrame of Points onto a map with either Folium or hvplot.
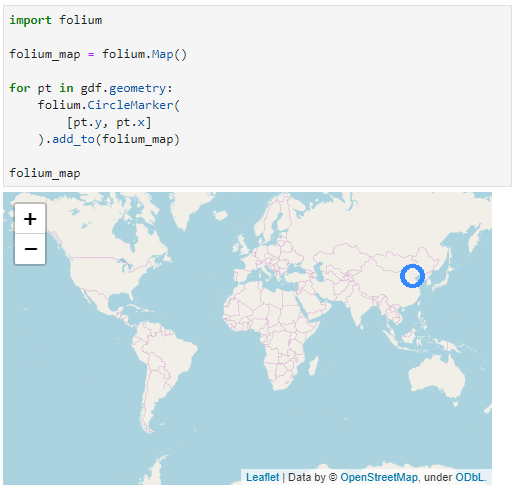
Folium does not automatically zoom to the data extent and I didn’t find a way to add the whole GeoDataFrame of Points without looping through the rows individually:
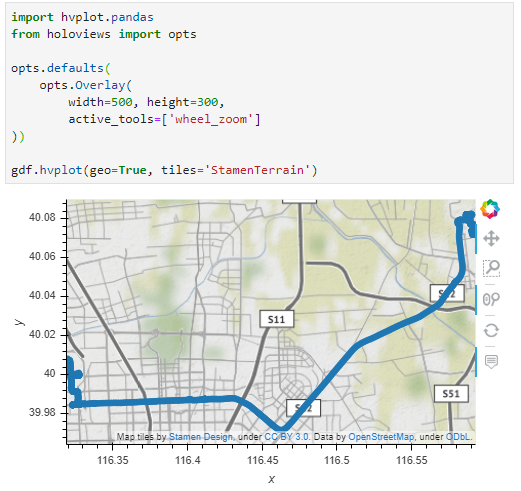
Hvplot on the other hand registers the hvplot function directly with the GeoDataFrame. This makes it as convenient to use as the original GeoPandas plot function. It also zooms to the data extent:
Standard interaction and zoom to area of interest
The following snippets ensure that the map is set to a useful extent and the map tools enable panning and zooming.
With Folium, we have to set the map center and the zoom. The map tools are Leaflet defaults, so panning and zooming work as expected:
 Since hvplot does not come with mouse wheel zoom enabled by default, we need to set that:
Color by attribute
Finally, for many maps, we want to show the point location as well as an attribute value.
To create a continuous color ramp for a numeric value, we can use branca.colormap to define the marker fill color:
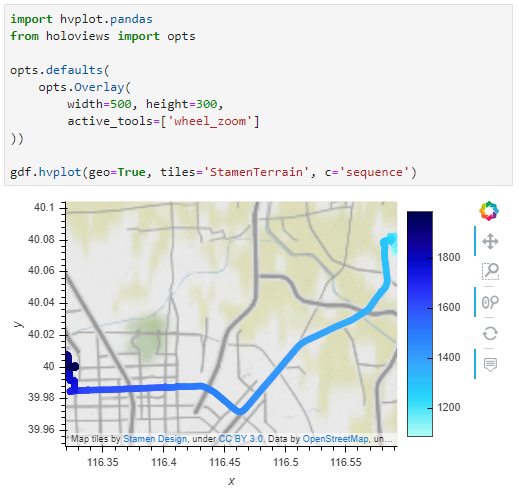
 In hvplot, it is sufficient to specify the attribute of interest:
I’m pretty impressed with hvplot. The integration with GeoPandas is very smooth. Just don’t forget to set the geo=True parameter if you want to plot lat/lon geometries.
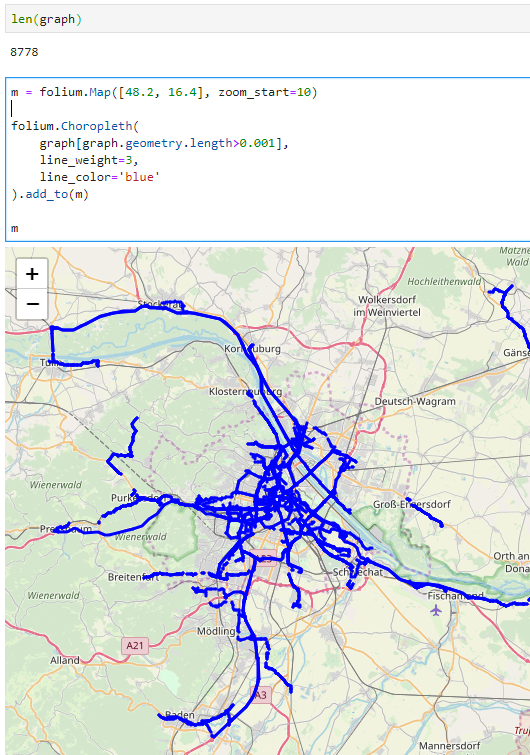
Folium seems less straightforward for this use case. Maybe I missed some option similar to the Choropleth function that I showed in the previous post.


