Related Plugins and Tags

QGIS Planet

Better date and time support in QGIS expressions and styles

Version note: This will only work in the latest dev build of QGIS – not in 1.8

The lack of uni for the next couple of weeks has left me some time at night to work on some features that I really wish QGIS had.  One of these features was better date and time support in the expression engine.  Date and time is an important concept when working on inspection data and not being able to style my features in QGIS using date operations was bugging me.  So in good open source fashion I added some.

Here are the current functions (more to come in the future):

  • $nowreturns the current date and time
  • age({datetime},{datetime}) - returns the difference between the two dates
  • todate({string}) - converts a string to date type
  • totime({string}) – converts a string to time type
  • tointerval({string}) – converts a string to a interval type (details below)
  • day({datetime} or {interval}) – returns the day from a datetime type or the number of days in a interval.
  • hour(…) – Same as above but for hours
  • minute(…)  - Same as above but for minutes
  • second(…)  - Same as above but for seconds
  • day(..)  - Same as above but for days
  • week(..)  - Same as above but for weeks
  • month(…)  - Same as above but for months
  • year(…) - Same as above but for years
  • {datetime} – {interval} = {new datetime} – returns a new datetime subtracting the interval 
  • {datetime} + {interval} = {new datetime} – returns a new datetime adding the interval


The interval type

Functions like age(..), tointerval(), {datetime} -/+ {interval}, day(..), hour(..), etc, use, or return, Intervals.  An Interval is a measure of time that we can use for different things.  An example of an Interval is ’1 Year 2 Months’ this is then converted to a number of seconds and used for any calculations.

For example one can take away 10 days from the current date by doing the following ( -> marks the output ):

todate($now - '10 Days')
-> 2012-06-20

as

todate($now)
-> 2012-06-30

We can also do something like:

todate($now + '2 Years 1 Month 10 Days')
-> 2014-08-10

The age() function will return an interval which we can use extract what information we need.

The number of days between two dates:

day(age('2012-06-30', '2012-06-10'))
-> 20
-- Think of it as '2012-06-30' - '2012-06-10'
-- Note: day(), month(), etc, functions return doubles so you can get
-- 21.135234 days if you are using date & time type rather than just date type
-- wrap the result in toint() to get a more sane output.

Day() will also work on a plain date:

day('2012-06-30')
-> 30

We can even get the number of seconds between two dates:

second(age('2012-06-30', '2012-06-10'))
-> 1728000

Currently the only date format supported is {year}-{month}-{day} as seen in the examples above. Shouldn’t be too hard to add support to the todate(), todatetime(), totime() functions for giving it a pattern to use when converting the string e.g. dd-mm-YYYY, or something like that.

More on this fancy new stuff

When I wrote the new expression builder dialog a while ago I made it dynamic so that any new functions added to the expression engine will show up automatically.  So here they are:

List of new date and time functions.

We can also use these functions in the rule based rending, which is where the power really comes in.  Lets see something like that in action:

Styled using days and years

Should be pretty straight forward to understand. We are using the age() and day() functions to style the events that are older than 30 days, within 30 days, for today, or in the future.  We also check the year of the event using year() and year($now) to make sure we only see this years events, or style them differently depending on if they are last years events or in the future.

This is the result of the above rules:

Result of using date functions in rule based renderer

I’m also using the date functions in the expression based labelling to label the features using the following expression:

CASE
WHEN year( "dateadded") < year($now) THEN
	'Last Year'
WHEN day(age("dateadded", $now)) < 0 THEN
	day(age("dateadded", todate($now))) || ' Days old'
ELSE
	day(age("dateadded", todate($now))) || ' Days to go'
END

Well that’s it. Hope you find it handy in your day-to-day mapping. I know I will be using it a lot.
Thanks to Martin and Jürgen for the code reviews during the process; venturing in an unknown part of the code base always makes me nervous but that is all part of learning, and sometimes you can make some pretty cool stuff.
Some other random notes: The general idea has been modelled of how Postgres handles dates and times, it’s not an exact copy but follows the same kind of ideas. The interval class also uses the same number of seconds for one year that postgres does so that we can be consistent with the output.


Filed under: Open Source, qgis Tagged: FOSSGIS, gis, map-rendering, Open Source, osgeo, qgis, Quantum GIS, styling

Improvements to the QGIS rule based rendering

The rule based rendering in QGIS has just got a make over to improve in some of the old usability issues it used to have.  Most of the improvements are UI related. If you would like to try them out you will need to grab a copy of the latest dev build (qgis-dev in OSGeo4W)

Main improvements include:

  • Nested rules.  If the parent rule evaluates to false none of the child rules are applied. This replaces the priority system in the old dialog.
  • Disable symbol for rules. Rules with no symbol only act as a check for the child rules e.g nothing is rendered for the rule but child rules still are (unless also disabled).
  • Drag and Drop rules (multi-selection is supported).  Rules can be dragged onto other rules in order to nest them and set up a rendering hierarchy.
  • Inline editing of rule labels, expressions, scales
  • Overall tweaks to the dialog

The new rule dialog

As you can see in the screenshot, the rules are now organized in a tree which clearly expresses which rules should be applied and when.

In the example above, all the rules under the Sealed rule will only be applied if that rule is true. The old system would have you managing all rules in one big list and dealing with priorities in order to get the rules to apply right, the new dialog is a major improvement.

And the results! As you can see below, QGIS will only render the colored squares if the Sealed rule is true otherwise it just shows a green line.

The rules applied

The work was sponsored by Ville de Morges, Switzerland and developed by Martin Dobias.  Thanks to both of them for these improvements.

More info:

Note: As this is a brand new feature there might be some bugs, or things that don’t quite work as expected. If you do find something don’t hesitate to file a bug report at hub.qgis.org so it can be fixed, or at least known about.


Filed under: Open Source, qgis Tagged: FOSSGIS, gis, map-rendering, mapping, Open Source, osgeo, qgis, Quantum GIS, styling

Opening MS SQL Server 2008 Spatial tables in QGIS – Correctly

Turns out the last blog post I did on this subject contained a few errors, mainly that QGIS wouldn’t render the layer when you opened it.

The answer is so obvious it’s almost embarrassing :)

In order to open and display a SQL Server 2008 layer in QGIS correctly, via OGR, you must have a geometry_columns table in your database with the name, geometry type and srid of the layer. That’s it! Oh look, it was even right in front of me in the OGR code for the mssqlspatial driver.

int OGRMSSQLSpatialTableLayer::FetchSRSId()
{
    CPLODBCStatement oStatement = CPLODBCStatement( poDS->GetSession() );
    oStatement.Appendf( "select srid from geometry_columns "
                    "where f_table_schema = '%s' and f_table_name = '%s'",
                    pszSchemaName, pszTableName );

    if( oStatement.ExecuteSQL() && oStatement.Fetch() )
    {
        if ( oStatement.GetColData( 0 ) )
            nSRSId = atoi( oStatement.GetColData( 0 ) );
    }

    return nSRSId;
}

So the process to open a MS SQL 2008 spatial layer in OGR is as follows.

There are two main tables which tell OGR how to read a layers projection:

  • geometry_columns
  • spatial_ref_sys

geometry_columns contains the table name and the key for the table spatial_ref_sys which contains the projection string. The projection string is the info that QGIS needs in order to correctly render a layer.

The easiest way to get the correct tables is to let OGR handle it for you via ogr2ogr, then just adding any other tables you may have already in your database to the geometry_columns table.

So to get ogr2ogr to create the right tables for you it’s as simple as running the following command from inside the OSGeo4W shell, changing the connection string part of course:

ogr2ogr -overwrite -f MSSQLSpatial "MSSQL:server=.\MSSQLSERVER2008;database=geodb;trusted_connection=yes" "rivers.tab"

(sample taken from http://www.gdal.org/ogr/drv_mssqlspatial.html)

Uploading even just one table this way will create both tables and fill in the needed info.
The geometry_columns table:

f_table_catalog f_table_schema f_table_name f_geometry_column
geodb dbo rivers ogr_geometry
coord_dimension srid geometry_type
2 32768 POLYGON

The spatial_ref_sys table:

srid auth_name auth_srid srtext proj4text
32768 NULL NULL PROJCS[“UTM_Zone_56_Southern_Hemisph…. +proj=utm +zone=56 +south +ellps=GRS80 +units=m +no_defs

So if you have already existing tables in your MS SQL 2008 database that were loaded, via say MapInfo’s EasyLoader, you would just upload one table via ogr2ogr to create the two tables needed by QGIS(using OGR) and then add the other tables to the geometry_columns table. If they are all in the same projection than you are in luck as you will only need to upload one in order to get the right strings in the spatial_ref_sys table, if not just upload a small sample for each projection.

Then you can open the table in QGIS using:

uri = "MSSQL:server={serverName};database={databaseName};tables={tableName};trusted_connection=yes"
qgis.utils.iface.addVectorLayer(uri,'{yourLayerNameHere}','ogr')

Tip: In order to test you have correctly set the table in geometry_columns you can run another ogr tool ogrinfo:

ogrinfo -al "MSSQL:server=localhost;database={your database};tables={your table}" -fid 1

If you see a value in Layer SRS WKT: then chances are it’s set right and QGIS should be able to render it, however if you see: Layer SRS WKT:(unknown) Than chances are QGIS will not render it correctly.

Hopefully this help people use MS SQL 2008 Spatial with QGIS, a important step I think in the world of using QGIS on Windows (especially when you don’t have the freedom to run PostGIS:) ).

I might even do a video tutorial when I get some free time after my exams and my wedding.


Filed under: Open Source, qgis Tagged: gis, map-rendering, mapping, MS SQL Server 2008, MS SQL Spatial, ogr, Open Source, OSS, qgis, Quantum GIS

One of my favorite features of QGIS – Rule based styling.

One of my favorite features of QGIS is the rule based rendering.

QGIS rule based rendering dialog

QGIS rule based rendering dialog

If you’re using MapInfo think of thematics + queries but on steroids. Rule based rendering allows you to you set, well, rules on what gets rendered and how.  The rules are based on a simple SQL style query language that’s built into QGIS.

Take for example the above screen shot.   The screen shot is from a current project I am doing in QGIS to clean up our current stormwater/drainage layer.  The layer is a in a bit of a mess at the moment so I needed a way to visualize what I have cleaned up and what I haven’t, so enter QGIS rule based styling.

For example: A pipe that has an upstream and downstream invert and is part of the trunk (main) network is then considered valid (for this situation anyway), so I created the following rule:

network_type = 'Trunk' AND Description != 'Drainage Imaginary Pipe' AND (US_Invert > 0 AND DS_Invert > 0)

We also have little connecting pipes that I don’t want to include in valid trunk  as they are only used to connect pits to pipes and are just cosmetic, I have excluded them by adding “Description !=’Drainage Imaginary Pipe’” to the above filter.

Next I wanted to show invalid trunk network pipes (ones without an up or downstream invert), so we just invert the last condition and swap the last AND for a OR:

network_type = 'Trunk' AND Description != 'Drainage Imaginary Pipe' AND (NOT US_Invert > 0 OR NOT DS_Invert > 0)

I also need to show but no highlight the non trunk pipes and the connecting pipes, so I made the next two rules and set their styles to a light gray:

NOT network_type = 'Trunk' AND NOT Description = 'Drainage Imaginary Pipe'
Description = 'Drainage Imaginary Pipe'

Finally I want to show pipe direction on all pipes but not the connecting pipes, again as they are just cosmetic:

Description != 'Drainage Imaginary Pipe'

You will also note in the screenshot above that I have a max zoom scales set on the last three rules, this is because when I zoom out all that info becomes overwhelming at that scale and distracts from showing the invalid parts of the main trunk line.

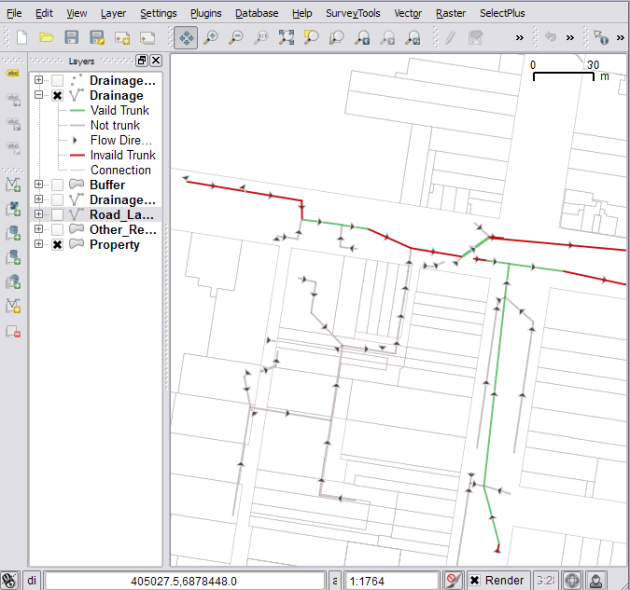
So after all that, the results:

Screenshot of rules applied

Map rendered using rules

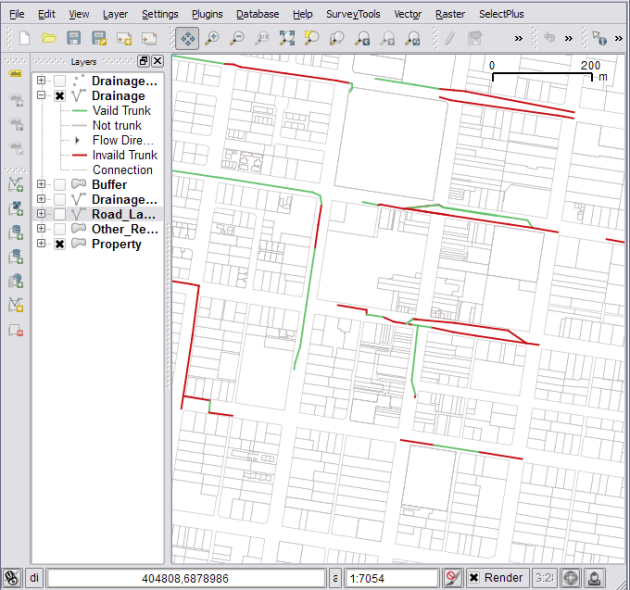
and if I zoom out pass 5,000:

Screenshot of rules applied, zoomed past 5,000

Map rendered when zoomed out pass 5,000

I think you can see how this rule based rendering could be very powerful, in fact I have about four different rule sets I use with the drainage layer to show different things to different people.

The rules I have shown above are pretty simple, you can go pretty crazy and use them to render OpenStreetMap data: http://www.youtube.com/watch?v=NBBYtH2svw0

The worst part about the rule based rendering is that I have gotten so used to their power that I feel crippled when I go back to MapInfo and try to do styling :)

Happy mapping.

What is your favorite QGIS feature?


Filed under: Open Source, qgis Tagged: gis, map-rendering, mapping, Open Source, OSS, qgis, Quantum GIS, styling, thematics

  • Page 1 of 1 ( 4 posts )
  • map-rendering

Back to Top

Sustaining Members