Related Plugins and Tags

QGIS Planet

QGIS 3D Tiles – thanks to Cesium Ecosystem Grant!

We’ve recently had the opportunity to implement a very exciting feature in QGIS 3.34 — the ability to load and view 3D content in the “Cesium 3D Tiles” format! This was a joint project with our (very talented!) partners at Lutra Consulting, and was made possible thanks to a generous ecosystem grant from the Cesium project.

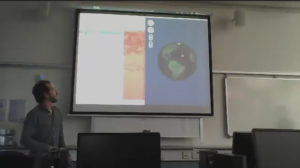
Before we dive into all the details, let’s take a quick guided tour showcasing how Cesium 3D Tiles work inside QGIS:

What are 3D tiles?

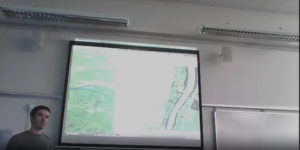
Cesium 3D Tiles are an OGC standard data format where the content from a 3D scene is split up into multiple individual tiles. You can think of them a little like a 3D version of the vector tile format we’ve all come to rely upon. The 3D objects from the scene are stored in a generalized, simplified form for small-scale, “zoomed out” maps, and in more detailed, complex forms for when the map is zoomed in. This allows the scenes to be incredibly detailed, whilst still covering huge geographic regions (including the whole globe!) and remaining responsive and quick to download. Take a look at the incredible level of detail available in a Cesium 3D Tiles scene in the example below:

Where can you get 3D tile content?

If you’re lucky, your regional government or data custodians are already publishing 3D “digital twins” of your area. Cesium 3D Tiles are the standard way that these digital twin datasets are being published. Check your regional data portals and government open data hubs and see whether they’ve made any content available as 3D tiles. (For Australian users, there’s tons of great content available on the Terria platform!).

Alternatively, there’s many datasets available via the Cesium ion platform. This includes global 3D buildings based on OpenStreetMap data, and the entirety of Google’s photorealistic Google Earth tiles! We’ve published a Cesium ion QGIS plugin to complement the QGIS 3.34 release, which helps make it super-easy to directly load datasets from ion into your QGIS projects.

Lastly, users of the OpenDroneMap photogrammetry application will already have Cesium 3D Tiles datasets of their projects available, as 3D tiles are one of the standard outputs generated by OpenDroneMap.

Why QGIS?

So why exactly would you want to access Cesium 3D tiles within QGIS? Well, for a start, 3D Tiles datasets are intrinsically geospatial data. All the 3D content from these datasets are georeferenced and have accurate spatial information present. By loading a 3D tiles dataset into QGIS, you can easily overlay and compare 3D tile content to all your other standard spatial data formats (such as Shapefiles, Geopackages, raster layers, mesh datasets, WMS layers, etc…). They become just another layer of spatial information in your QGIS projects, and  you can utilise all the tools and capabilities you’re familiar with in QGIS for analysing spatial data along with these new data sources.

One large drawcard of adding a Cesium 3D Tile dataset to your QGIS project is that they make fantastic 3D basemaps. While QGIS has had good support for 3D maps for a number of years now, it has been tricky to create beautiful 3D content. That’s because all the standard spatial data formats tend to give generalised, “blocky” representations of objects in 3D. For example, you could use an extruded building footprint file to show buildings in a 3D map but they’ll all be colored as idealised solid blocks. In contrast, Cesium 3D Tiles are a perfect fit for a 3D basemap! They typically include photorealistic textures, and include all types of real-world features you’d expect to see in a 3D map — including buildings, trees, bridges, cliffsides, etc.

What next?

If you’re keen to learn even more about Cesium 3D Tiles in QGIS, you can check out the recent “QGIS Open Day” session we presented. In this session we cover all the details about 3D tiles and QGIS, and talk in depth about what’s possible in QGIS 3.34 and what may be coming in later releases.

Otherwise, grab the latest QGIS 3.34 and start playing…. you’ll quickly find that Cesium 3D Tiles are a fun and valuable addition to QGIS’ capabilities!

Our thanks go to Cesium and their ecosystem grant project for funding this work and making it possible.

(Fr) Oslandia recrute : Ingénieur(e) développement d’applications SIG ( Python / SQL / QGIS )

Sorry, this entry is only available in French.

Intro to QGIS3 3D view with Viennese building data

In this post, I want to show how to visualize building block data published by the city of Vienna in 3D using QGIS. This data is interesting due to its level of detail. For example, here you can see the Albertina landmark in the center of Vienna:

an this is the corresponding 3D visualization, including flying roof:

To enable 3D view in QGIS 2.99 (soon to be released as QGIS 3), go to View | New 3D Map View.

Viennese building data (https://www.data.gv.at/katalog/dataset/76c2e577-268f-4a93-bccd-7d5b43b14efd) is provided as Shapefiles. (Saber Razmjooei recently published a similar post using data from New York City in ESRI Multipatch format.) You can download a copy of the Shapefile and a DEM for the same area from my dropbox.  The Shapefile contains the following relevant attributes for 3D visualization

  • O_KOTE: absolute building height measured to the roof gutter(?) (“absolute Gebäudehöhe der Dachtraufe”)
  • U_KOTE: absolute height of the lower edge of the building block if floating above ground (“absolute Überbauungshöhe unten”)
  • HOEHE_DGM: absolute height of the terrain (“absolute Geländehöhe”)
  • T_KOTE: lowest point of the terrain for the given building block (“tiefster Punkt des Geländes auf den Kanten der Gebäudeteilfläche”)

To style the 3D view in QGIS 3, I set height to “U_KOTE” and extrusion to

O_KOTE-coalesce(U_KOTE,0)

both with a default value of 0 which is used if the field or expression is NULL:

The altitude clamping setting defines how height values are interpreted. Absolute clamping is perfect for the Viennese data since all height values are provided as absolute measures from 0. Other options are “relative” and “terrain” which add given elevation values to the underlying terrain elevation. According to the source of qgs3dutils:

  AltClampAbsolute,   //!< Z_final = z_geometry
  AltClampRelative,   //!< Z_final = z_terrain + z_geometry
  AltClampTerrain,    //!< Z_final = z_terrain

The gray colored polygon style shown in the map view on the top creates the illusion of shadows in the 3D view:


Beyond that, this example also features elevation model data which can be configured in the 3D View panel. I found it helpful to increase the terrain tile resolution (for example to 256 px) in order to get more detailed terrain renderings:

Overall, the results look pretty good. There are just a few small glitches in the rendering, as well as in the data. For example, the kiosik in front of Albertina which you can also see in the StreetView image, is lacking height information and therefore we can only see it’s “shadow” in the 3D rendering.

So far, I found 3D rendering performance very good. It works great on my PC with Nvidia graphics card. On my notebook with Intel Iris graphics, I’m unfortunately still experiencing crashes which I hope will be resolved in the future.

PostGIS 3D &#8211; Foss4g video and workshop

The latest PostGIS and QGIS 3D enhancements presented at FOSS4G by Oslandia are available online.We suggest you to have a look on our PostGIS 3D / QGIS 3D video demonstration using SFCGAL library and the QGIS Horao plugin.

A step by step workshop, (really close to the video workflow) is also available online  https://github.com/Oslandia/Workshops/tree/master/FOSS4G_2013_PostGIS_3D

We can provide you the full virtual machine on demand, with proper software environment (6GB Virtual Box Image).

We would be really interested in having your advice on these new 3D features, and the use cases you could be interested in. Do not hesitate to get in touch.

Contact us at [email protected] for any information.

QGIS Community meeting in Brighton

Developers and contributors from the QGIS project are used to gather physically twice a year across different countries. Such an event allows people to synchronize their effort, and discuss new possible developments.cThe latest QGIS community meeting took place in Brighton from the 12th to the 16th of September, just before the FOSS4G event. It was the biggest community meeting organized so far, with close to 50 people attending ! Everything went smooth thanks to the perfect organization by Lutra Consulting.

This session was of particular interest in the project’s history, since it was dedicated to the release of the eagerly-awaited new 2.0 version of QGIS.

Oslandia is used to take part in the event and even organized the march 2012 session in Lyon.


Presentations

Despite being originally oriented toward code and translations, some presentations took place during the event. Some of them have been video recorded, some did not. Hereafter is a subset of them.

A new website

In parallel to the release of the 2.0 version, the QGIS website has been updated. Its look and feel, but also the way it is now build. Richard Duivenvoorde presented the efforts that have been put on the support of multiple languages, adaptation to mobile devices, and the reuse of tools used for building the documentation of the project. The new website is now online.

Richard presenting the new website


Presentation of the new website : http://www.ustream.tv/recorded/38687971

Constraints on attributes

Some more developer-oriented presentations and discussions also took place. Matthias Kuhn and Nathan Woodrow presented an idea about extending the way attributes are handled by QGIS. In particular, the concept of constrained attributes emerged. The idea is to be able to express, manipulate and edit contrains on attributes (possible range of values for instance) as it is found in databases. This could then be used to constrain user editing of layers, presenting to the user an appropriate widget (combo box for an enumeration for instance), especially for layers that do not have native support for these constraints.

QGIS for Android tablets

RealworldSystems presented their work on what they called the “QGIS Mobility framework”, based on previous works by Marco Bernasocchi on QGIS for Android. It is dedicated to the design of custom QGIS applications for deployment on Android tablets (for on-the-field editing campains for instance). It looks promising and has already been used in a real-world application for gaz pipeline inspection. The framework can be found on github.

QGIS webserver

Andreas Neumann presented evolutions of QGIS webserver and webclient. More can be found in the corresponding video.

Andreas presenting the work on QGIS webserver and webclient

Video 1 http://www.ustream.tv/recorded/38741015

Evolution of the Globe plugin

Matthias Kuhn presented evolutions he made to the Globe plugin that allows to display a 3D earth with different kinds of data on it. Lots of osgearth features are now integrated into the Globe plugin (in particular the support for 2D vector layers).

Matthias presenting its work on the Globe plugin

Video 2 http://www.ustream.tv/recorded/38737991

Visualisation of 3D data

Oslandia presented also its ongoing work on the integration of Postgis 3D. After a thourought evaluation of osgearth, which is the base of the Globe plugin, we decided to develop our own 3D visualisation stack directly on top of OpenSceneGraph.

A QGIS plugin has also been developed in order to be able to view QGIS layers in 3D.

With this new 3D visualisation stack we are able to display and manipulate data of a whole city between 20 and 60 frames per second on a laptop (here the demo has been designed on data from the city of Lyon) , when we were hardly able to display a small city quarter with Globe.

Oslandia presenting its work on its 3D visualisation stack

Video 3 http://www.ustream.tv/recorded/38738897

Slides https://github.com/Oslandia/presentations/tree/master/qgis_hf_2013

QGIS 2.0

All the work done during this community meeting allowed to polish the 2.0 version of QGIS which has been publicly announced during the FOSS4G in Nottingham by Tim Sutton.
Waiting now for the 2.1 release 🙂

Experiments in the 3rd dimension

The upcoming 2.14 release of QGIS features a new renderer. For the first time in QGIS history, it will be possible to render 2.5D objects directly in the map window. This feature is the result of a successful crowd funding campaign organized by Matthias Kuhn last year.

In this post, I’ll showcase this new renderer and compare the achievable results to output from the Qgis2threejs plugin.

For this post, I’m using building parts data from the city of Vienna, which is publicly available through their data viewer:

This dataset is a pretty detailed building model, where each building is made up of multiple features that represent parts of the building with different height. Of course, if we just load the dataset in default style, we cannot really appreciate the data:

Loaded building parts layer

Loaded building parts layer

All this changes if we use the new 2.5D renderer. With just a few basic settings, we can create 2.5D representations of the building parts:

QGIS 2.5D renderer settings

QGIS 2.5D renderer settings

Compare the results to aerial images in Google Maps …

QGIS 2.5D renderer and view in Google Maps

QGIS 2.5D renderer and view in Google Maps

… not bad at all!

Except for a few glitches concerning the small towers at the corners of the building, and some situations where it seems like the wrong building part is drawn in the front, the 2.5D look is quite impressive.

Now, how does this compare to Qgis2threejs, one of the popular plugins which uses web technologies to render 3D content?

One obvious disadvantage of Qgis2threejs is that we cannot define a dedicated roof color. Thus the whole block is drawn in the same color.

On the other hand, Qgis2threejs does not suffer from the rendering order issues that we observe in the QGIS 2.5D renderer and the small towers in the building corners are correctly displayed as well:

QGIS 2.5D renderer and QGIS2threejs output

QGIS 2.5D renderer and Qgis2threejs output

Overall, the 2.5D renderer is a really fun and exciting new feature. Besides the obvious building usecase, I’m sure we will see a lot of thematic maps making use of this as well.

Give it a try!

In the next post, I’m planning a more in-depth look into how the 2.5D renderer works. Here’s a small teaser of what’s possible if you are not afraid to get your hands dirty:


3D viz with QGIS & three.js

If you are looking for a tool to easily create 3D visualizations of your geodata, look no further! Qgis2threejs is a plugin by Minoru Akagi which exports terrain data combined with the map canvas image and optional vector data to an html file which can be viewed in 3D in any web browser which supports WebGL. To do that, this plugin uses the Three.js library.

This is the result of my first experiments with Qgis2threejs. In the following sections, I will show the steps to reproduce it.

Türkenschanzpark, Vienna

click for the interactive version (requires WebGL-capable browser)

1. The data

The building blocks of this visualization are:

  • elevation data and the hillshade derived from this data
  • a base map (WMTS from basemap.at in my case)
  • OSM building data provided by Geofabrik and
  • tree data from the city of Vienna

Load all datasets into QGIS.

2. Preparing the map

Qgis2threejs will overlay the map (as rendered in the QGIS map area) on top of the elevation model. You can combine any number of layers to create your map. I just loaded a basemap.at WMTS and a hillshade layer. To add a nice tree shadow effect, I also added the tree layer (dark grey, 50% transparency, multiply blending).

tuerkenschanzpark_map

3. Preparing the vector features

The vector features in the visualization are buildings and trees. The buildings are based on an OSM building layer. The trees are create from two point layers: one point layer to create the tree trunks (cylinder shape) and a duplicate of this point layer to create the tree crowns (sphere shape).

Load the data and choose the desired fill colors.

4. Using Qgis2threejs

Now we can start Qgis2threejs. The first tab is used to configure the terrain. Just pick the correct elevation data layer. I didn’t modify any of the other default settings.

qgis2threejs_dem

The second tab provides the settings for the vector data. As mentioned in the previous section, the trees are created from two point layers and the buildings are based on a polygon layer. The tree crowns are spheres with a radius size 3 and a z value of 5 above the surface. The tree trunks are cylinders. Finally, the buildings have a height of 10.

qgis2threejs_vector

That’s it! Just press “run” and wait. When the export is finished, your default browser (or a different one, if you specify another one in the plugin settings) will open automatically and display the results.
The visualization is interactive. You can tilt the visualization using the left mouse button, pan using the right mouse button, and zoom using the mouse wheel. I found that Firefox used around 1.6 GB of RAM to render this example.

5. Share your visualization

In the browser window, you will see where Qgis2threejs stored the html and associated Javascript files. To share your visualization, you just need to copy these files onto a webserver.

I would love to see what you come up with. Please share a link in the comments.


The state of QGIS Globe

The Region of Umbria, Italy, sponsored 4 days of work to update QGIS Globe for current QGIS versions. Most of the functionality is working again and the globe is now compatible with osgEarth 1.0 up to 1.3. The bad news is, that the globe plugin is not working on Windows with OSGeo4W. It seems that one of the OSGeo4W libraries (GDAL?) is compiled with an incompatible MS compiler version. Christmas holidays are coming…

At least it gives Linux users the possibility to play with the globe using the current development version and do exciting stuff like Oslandia does:

PostGIS 3D demo

Imagine someone would sponsor four weeks of QGIS Globe work!

3D DXF from MapInfo Tab or ESRI Shape (or anything) using OGR

Note:The following post requires gdal 1.8

A lot of times we need to send/use 3D dxf files, we used to use FME however FME is not free or cheap. So I went looking for a free solution.

If you have gdal 1.8 it’s just one simple command line run using, what is becoming my favorite GIS tool, ogr2ogr.

All you have to do is run:

ogr2ogr -f "DXF" {outFile} {inFile} -zfield {ColumnWithZValue}

So in my case I ran:

ogr2ogr -f "DXF" C:\Temp\contourswarwick.dxf C:\Temp\Contours.TAB -zfield Height

I haven’t fully tested it but {outfile} can be any file ogr supports.

and the output:

Top view of contours

Top view of contour layer

Contours side view

The side view of the above image.

In the words of, the not so great, Charlie Sheen. WINNING!

Happy mapping :D


Filed under: MapInfo, Open Source Tagged: 3D, ESRI, gdal, gis, mapinfo, mapping, ogr, Open Source, OSS

Real World Mapping with the Kinect (via Decorator Pattern (Martin Szarski’s Blog))

Always wanted your very own 3d scanner? Try Kinect:

Real World Mapping with the Kinect Many people have experimented with using the Kinect for more than just user interaction. One thing that I have been very interested in is extracting point clouds from the device. People at the ROS (ros.org) project have gone to some trouble to determine empirical calibration parameters for the depth camera (disparity to real-world depth) here, and Nicolas Burrus has posted parameters for the RGB camera (relationship between the depth image and th … Read More

via Decorator Pattern (Martin Szarski’s Blog)


QGIS goes 3D

Marco, Matthias and me spent three days at the QGIS hackfest in Wroclaw (pictures). There I got the time to work on the QGIS globe plugin and made a presentation of the current state.

As soon as the threading branch (Martin Dobias’ Google of Summer project) is merged into trunk, the globe should make its way into trunk as well. In the meantime you can compile the QGIS branch from guthub to test the globe. Thanks Vincent for writing step by step build instructions.

  • Page 1 of 1 ( 11 posts )
  • 3d

Back to Top

Sustaining Members