Related Plugins and Tags

QGIS Planet

Quick webmaps with qgis2web

In Publishing interactive web maps using QGIS, I presented two plugins for exporting web maps from QGIS. Today, I want to add an new member to this family: the qgis2web plugin is the successor of qgis-ol3 and combines exports to both OpenLayers3 as well as Leaflet.

The plugin is under active development and currently not all features are supported for both OpenLayers3 and Leaflet, but it’s a very convenient way to kick-off a quick webmapping project.

Here’s an example of an OpenLayers3 preview with enabled popups:

OpenLayers3 preview

OpenLayers3 preview

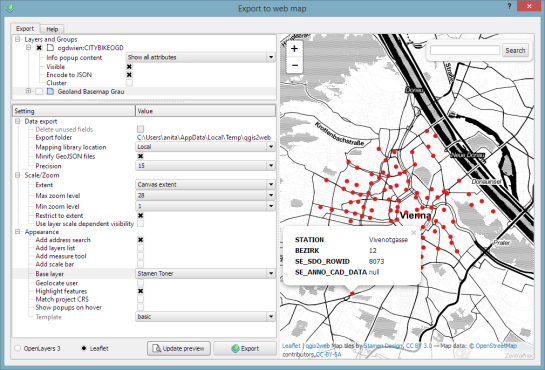
And here is the same map in Leaflet with the added bonus of a nice address search bar which can be added automatically as well:

Leaflet preview

Leaflet preview

The workflow is really straight forward: select the desired layers and popup settings, pick some appearance extras, and then don’t forget to hit the Update preview button otherwise you might be wondering why nothing happens ;)

I’ll continue testing these plugins and am looking forward to seeing what features the future will bring.


OSGeo Code Sprint, Vienna

This is how OSGeo happens.  These are the folk who bring us a lot of that open-source geo-spatial goodness. You can follow the code sprint on Twitter using the hashtags #csprint and #viennacodesprint14


FOSSGIS 2014 slides

Neues in QGIS 2.2

Nach dem lange erwarteten Release von QGIS 2.0 im September 2013, sind ab diesem Jahr neue Versionen im Viermonatszyklus geplant. Es werden die neuen Funktionen in QGIS 2.2, wie z.B. DB-Relationen mit verschachtelten Formularen, die erweiterten Methoden zur Transformierung geographischer Koordinatensysteme, zahlreiche Verbesserungen im Print Composer und ein komplett überarbeiteter DXF Export vorgestellt. Zusätzlich wird eine Vorschau auf das multithreaded Rendering gegeben und die neuen Mitglieder im Project Steering Committee vorgestellt

Links:

Mobile Kartenviewer mit Openlayers 3

Mit OpenLayers 3 steht eine komplette Neuentwicklung der funktionsreichen OpenLayers-Bibliothek zur Verfügung. Die verbesserte Unterstützung mobiler Geräte war ein primäres Ziel der neuen Version. Dieser Vortrag stellt den JQuery Mobile basierten OL3 Mobile Viewer vor, der erweiterte Funktionen wie automatische Kartenausrichtung oder Positionsnachführung bietet. Es wird auch ein Vergleich mit anderen Viewern, wie der auf Bootstrap und AngularJS aufbauenden Neuentwicklung von Swisstopo angestellt.

Links:

50th ICA-OSGeo Lab established at Fondazione Edmund Mach (FEM)

We are pleased to announce that the 50th ICA-OSGeo Lab has been established at the GIS and Remote Sensing Unit (Piattaforma GIS & Remote Sensing, PGIS), Research and Innovation Centre (CRI), Fondazione Edmund Mach (FEM), Italy. CRI is a multifaceted research organization established in 2008 under the umbrella of FEM, a private research foundation funded by the government of Autonomous Province of Trento. CRI focuses on studies and innovations in the fields of agriculture, nutrition, and environment, with the aim to generate new sharing knowledge and to contribute to economic growth, social development and the overall improvement of quality of life.

The mission of the PGIS unit is to develop and provide multi-scale approaches for the description of 2-, 3- and 4-dimensional biological systems and processes. Core activities of the unit include acquisition, processing and validation of geo-physical, ecological and spatial datasets collected within various research projects and monitoring activities, along with advanced scientific analysis and data management. These studies involve multi-decadal change analysis of various ecological and physical parameters from continental to landscape level using satellite imagery and other climatic layers. The lab focuses on the geostatistical analysis of such information layers, the creation and processing of indicators, and the production of ecological, landscape genetics, eco-epidemiological and physiological models. The team pursues actively the development of innovative methods and their implementation in a GIS framework including the time series analysis of proximal and remote sensing data.

The GIS and Remote Sensing Unit (PGIS) members strongly support the peer reviewed approach of Free and Open Source software development which is perfectly in line with academic research. PGIS contributes extensively to the open source software development in geospatial (main contributors to GRASS GIS), often collaborating with various other developers and researchers around the globe. In the new ICA-OSGeo lab at FEM international PhD students, university students and trainees are present.

PGIS is focused on knowledge dissemination of open source tools through a series of courses designed for specific user requirement (schools, universities, research institutes), blogs, workshops and conferences. Their recent publication in Trends in Ecology and Evolution underlines the need on using Free and Open Source Software (FOSS) for completely open science. Dr. Markus Neteler, who is leading the group since its formation, has two decades of experience in developing and promoting open source GIS software. Being founding member of the Open Source Geospatial Foundation (OSGeo.org, USA), he served on its board of directors from 2006-2011. Luca Delucchi, focal point and responsible person for the new ICA-OSGeo Lab is member of the board of directors of the Associazione Italiana per l’Informazione Geografica Libera (GFOSS.it, the Italian Local Chapter of OSGeo). He contributes to several Free and Open Source software and open data projects as developer and trainer.

Details about the GIS and Remote Sensing Unit at http://gis.cri.fmach.it/

Open Source Geospatial Foundation (OSGeo) is a not-for-profit organisation founded in 2006 whose mission is to support and promote the collaborative development of open source geospatial technologies and data.

International Cartographic Association (ICA) is the world authoritative body for cartography and GIScience. See also the new ICA-OSGeo Labs website.

FOSSGIS 2013: Mapfish Appserver

Mapfish Appserver is a platform for building web mapping applications using OGC standards and the Mapfish REST protocol.

Slides from FOSSGIS 2013 in Rapperswil (in german).

FOSSGIS 2013: Mapfish Appserver

Mapfish Appserver is a platform for building web mapping applications using OGC standards and the Mapfish REST protocol.

Slides from FOSSGIS 2013 in Rapperswil (in german).

Faster maps with progressive WMS

The good old OGC WMS has many advantages compared to tiled maps:

  • Continious zoom levels
  • Support for different projections
  • Combination of multiple layers in one request
  • Higher resolutions for printing
  • Better labelling
  • No maintenance needed when updating data

Well known disadvantages are scalability issues for high-traffic sites and a slower response time for complex maps.

The second point can be significantly improved by using a technique known from the progressive JPEG format. Before loading a map with full resolution, a map image with a lower resolution is requested from the server. This results in a better response time, because rendering and transmitting of the low resolution image is significantly faster. The biggest effect on rendering time is in combination with raster layers, but also for vector layers the improvement can be substantial.

High resolution:

Low resolution:

The technique can be easily applied to any WMS using this basic OpenLayers implementation.

There is much room for improvements. The low resolution layer could be tiled, limited to certain zoom levels or having a larger extend for smoother panning.

QGISCloud has this optimization built into the QGIS Web-Client viewer, which helps collecting experience with a wide range of datasets.

QGIS Server on Ubuntu Step-by-step

This post summarizes my notes about installing QGIS Server on Ubuntu, adding a QGIS project file to the server and using the WMS in an OpenLayers application.

Installation

First, it’s useful to figure out the Ubuntu version:

lsb_release -a

Since my server runs “lucid”, I add the following package sources to /etc/apt/sources.list (as described in the QGIS installation documentation)

deb http://qgis.org/debian lucid main
deb-src http://qgis.org/debian lucid main

Before we can install anything, we need to add the key and update the package list

gpg --keyserver keyserver.ubuntu.com --recv 1F9ADD375CA44993
gpg --export --armor 1F9ADD375CA44993 | sudo apt-key add -
sudo apt-get update

Now we can install QGIS Server and the necessary Apache package

sudo apt-get install qgis-mapserver libapache2-mod-fcgid

It never hurts to restart Apache :)

sudo /etc/init.d/apache2 restart

Let’s test the installation before we proceed. The GetCapabilities request should already work

http://10.101.21.28/cgi-bin/qgis_mapserv.fcgi?SERVICE=WMS&VERSION=1.3.0&REQUEST=GetCapabilities

Adding a QGIS project file

It’s time to add a QGIS project to our server. To do that, we move to the QGIS Server folder

cd /usr/lib/cgi-bin

where you should find qgis_mapserv.fcgi and wms_metadata.xml.
I’ve decided to have one folder for each project file. My first project is “vienna”.

sudo mkdir vienna
cd vienna

qgis_mapserv.fcgi and wms_metadata.xml can now be linked into this new folder

sudo ln -s ../qgis_mapserv.fcgi .
sudo ln -s ../wms_metadata.xml .

The only thing that’s missing anymore is a QGIS project file. It can be copied or linked into the folder. After restarting Apache, we should be good to go.

Let’s test the setup using “Add WMS Layer” in QGIS by adding the service URL such as

http://10.101.21.28/cgi-bin/vienna/qgis_mapserv.fcgi

and ticking “Ignore GetMap URI …” and “Ignore GetFeature URI …”.

After clicking “Connect”, all layers from the project file we added should get listed and we can select and load them.

QGIS Server can serve as many project files as you want. There a different ways to organize your server but I would simply add a new folder (like the “vienna” folder in this example) and link in the executable and project file.

Using QGIS Server WMS in OpenLayers

Of course QGIS Server doesn’t just talk to QGIS Desktop but to any other WMS client that conforms to the standard. One classic use case is to add the WMS layers to an OpenLayers application. This is rather simple but I’ll add it here for the sake of completeness:

I used to have a Geoserver WMS base layer in my application. The only lines of code that needed to be changed to migrate to QGIS Server were the service URL and the layer names.

    wms = new OpenLayers.Layer.WMS(
        'roads', "http://10.101.21.28/cgi-bin/vienna/qgis_mapserv.fcgi",
        {
            layers: 'roads', 
            format: 'image/png';
            bgcolor: '#fafafa'
        }, 
        {
            buffer: 1, 
            isBaseLayer: true, 
            graphicZIndex: 0, 
        }
    );

Standardized services are great!


OpenLayers: failure of map redraw on panning

Just a quick heads up for those of you using OpenLayers. There seem to have been a lot of problems lately with OpenLayers refusing to redraw its layers when panning, where everything was working before. One possible solution turned up in this thread on OpenLayers Users. The credit for solving the problem is therefore not [...]

QGIS Plugin of the Week: OpenLayers

This week we look at the OpenLayers plugin for QGIS. This plugin allows you to add a number of image services to your map canvas:

  • Google
    • Physical
    • Streets
    • Hybrid
    • Satellite
  • OpenStreetMap
  • Yahoo
    • Street
    • Hybrid
    • Satellite
  • Bing
    • Road
    • Aerial
    • Aerial with labels

Installing the Plugin

The OpenLayers plugin is installed like all other Python plugins. From the the Plugins menu in QGIS, choose Fetch Python Plugins. This brings up the plugin installer. To find the plugin, enter openlayers in the Filter box, then select OpenLayers Plugin from the list. Once it’s highlighted, click the Install plugin button. This will download the plugin from the repository, install it, and load it into QGIS.

Using the Plugin

The OpenLayers Plugin uses your view extent to fetch the data from the service you choose. For this reason you should load at least one of your own layers first. Since each of the services are expecting a request in latitude/longitude your layer either has to be geographic or you must enable on the fly projection.

To add one of the services you have two choices; you can pick the service from the Plugins->OpenLayers plugin menu or you can use the OpenLayers Overview. The Overview opens a new panel that allows you to choose a service from a drop-down list. Click the Enable map checkbox to enable the drop-down list and preview the service you want to add. If you are happy with what you see, you can add it to the map by clicking the Add map button.

In the screenshot below we have enabled the Overview panel, added the world boundaries layer1, zoomed to an area of interest, and added the Google terrain (physical) data:

You can add as many services as you want, previewing them using the OpenLayers Overview panel.

1 You can get the world boundaries layer from the Geospatial Desktop sample data set.

Norwegian Trekking with QGIS Server

I have blogged about the awesomeness that is QGIS Server before. Maybe you have seen some of the nice maps that Andreas Neumann has made in Uster, Switzerland. Over the past 3 months we were contracted to help prototyping a new mapping service for the Norwegian Trekking Association. We really got a chance to put QGIS Server (and the new QGIS Web Client project) through its paces. Why not take a little look for yourself. We had quite a lot of fun optimising the client's data set for good performance and generally making sure everything works smoothly.

Note:

- the site is still a test site, but the fine folks from Norway gave me the OK to let people take it for a whirl.
- we have not yet implemented search support.
- We made a bunch of different print layouts for you to try out!

It's now incredibly easy to get your QGIS cartography online. In the near future I plan to test out techniques for tilecaching with QGIS Server and once that works it will be the end of the line for my 11+ year love affair with UMN Mapserver for the most part I think.

Get your map on! QGIS Server in action (click for full image)

Get your map on! QGIS Server in action (click for full image)


pixelstats trackingpixel

Live vehicle tracking with OpenLayers

The last three or four weeks we have been preparing the Tracks4Africa site for the next season of 'Voetspore' (translated from Afrikaans: 'foot steps') - a South African TV program which follows the adventures of a group of 4x4 drivers as they traverse africa. For this season, one of the vehicles has been fitted with two tracking devices - a satellite transponder and a GSM unit. By wiring up a couple of Django views to deliver GeoJSON, and consuming that from OpenLayers we are able to deliver real time data on the vehicle positions during their excursion. The data is degraded to show one vertex per hour, although the complete dataset is much more detailed.


The trip just started this weekend from  Cape Agulhas, the Southern Tip of Africa (and coincidentally not far from where I live) to Alexandria in Egypt (which is coincidentally extremely far from where I live). You can track their progress by visiting the dedicated Tracks4Africa Voetspore page created for this purpose.

Voetspore map on Tracks4Africa (click for large view)

Voetspore map on Tracks4Africa (click for large view)

pixelstats trackingpixel

Custom styles for Google Maps in OpenLayers

Recently, @simo has posted an elegant solution for defining custom styles for Google Maps layers in OpenLayers on gis.stackexchange. An example with source can be found at http://www.empreinte-urbaine.eu/mapping/styled_gmap.html. The idea seems to be to use a StyledMapType:

The StyledMapType allows you to customize the presentation of the standard Google base maps, changing the visual display of such elements as roads, parks, and built-up areas to reflect a different style than that used in the default map type.

How great would it be if it was possible to define such styles in QGIS OpenLayers plugin too!


Picking a Feature’s Attribute Value From a WMS Layer With OpenLayers

There are many nice examples out there of how to use a getFeatureInfo request in OpenLayers to display a feature’s attribute table. In some applications it can be useful though not to display the full attribute table but to only select one attribute value from it and output it somewhere, e.g. in a text field.

This post describes how to pick the road id from a road wms layer and write the id value into a text input field.

OpenLayers offers a convenient class to achieve this: OpenLayers.Control.WMSGetFeatureInfo.

Let’s create an object of this class, register and activate it:

roadidPicker = new OpenLayers.Control.WMSGetFeatureInfo({
                url: 'http://localhost:8080/geoserver/wms',
                title: 'identify features on click',
                layers: [wms],
                queryVisible: true
            });
roadidPicker.infoFormat = 'application/vnd.ogc.gml';
roadidPicker.events.register("getfeatureinfo", this, pickRoadid);
map.addControl(roadidPicker);
roadidPicker.activate();

Now, every time the user clicks onto the map, a getFeatureInfo request is issued and the function pickRoadid() is called. In pickRoadid(), we’ll define which value we want to pick from the feature. The ‘id’ of the feature will be written into a text input field called ‘roadId’:

function pickRoadid(e) {
  if (e.features && e.features.length) {
     var val = e.features[0].attributes.id;
     document.getElementById('roadId').value = val;
  }
}

You might have noticed the ‘[0]‘. That’s because the click event comes with a list of features within the reach of the mouse click. For my application, I can only use one value and the first feature in this list is as good as any.


OpenLayers plugin visits code sprint

A short visit and 7 hours train ride to the OpenLayers code sprint mainly for a presentation at the Swiss MapFish user group meeting in Lausanne, resulted in a new release of the QGIS OpenLayers plugin. The OpenLayers plugin adds WebKit based layers to QGIS and ships with OpenStreetMap-, Google- and Yahoo-Layers.

Changes in this release:

  • Update to OpenLayers trunk
  • Google Layers using API V3 (no API key necessary)
  • Code refactoring for adding new layer types with one line of code (and some HTML…)

The next planned step is integrating this plugin with the very nice Openlayers Overview plugin from Luiz Motta.

Information for adding your own layers and a bug tracker is now available at hub.qgis.org/projects/openlayers

FossGIS Web Mappers Toolbox

I thought I would take a moment to run through the tools in my digital toolbox that I use to develop GIS enabled web sites. I try to pick the best of breed in each area rather than learn multiple tools that do the same thing – life is short and there isn’t enough time for me to do that.  I would be interested to read in the comments if anyone has suggestions of better alternatives:

Operating system: Debian or Ubuntu Server Edition. Really don’t run your web site on Windows, its just a silly waste of time and money.

Web server – Apache 2. It’s a no brainer really, its fast, robust and infinitely configurable while easy to get running in a default configuration.

Programmers editor: Vim (or emacs if you prefer). Being able to use the same editor on both local development machines and remote servers is indispesible. Also if you hand write your html it tends to have less gumpf clogging up the works compared to the Frontpage etc. generated sites I have seen out there. If you must use a GUI editor there are a few good choices under Linux, but VIM does it for me.

Web Application framework: (Geo)Django. With its support for spatial extensions,  intuitive MVC architecture and wealth of 3rd party add-ons, Django is a great choice for building your web applications with Python.

Backend Database: PostgreSQL/PostGIS. It does everything you need including store geospatial data.  Some people suggest SpatialLite as an alternative, but thus far I have haven’t used it in a production system so I don’t know what limitations, if any, it has.

Javascript Framework: Jquery. I know there are some good competitors but JQuery and JQuery-UI are so great I haven’t felt a need to go and discover their competitors. There are a huge number of add ons for JQuery and plenty of helpful people out there if you get stuck.

CSS Framework: Blueprint CSS. I think CSS frameworks are still a relatively new concept. They take a lot of the pain out of layout and make your site look good with minimal effort. Blueprint implements the 960 grid and the results are pretty much always pleasing on the eye.

CSS Compressor: http://www.csscompressor.com/. This web site will take your CSS and squish it by removing comments, white space etc. It typically makes my  CSS files around 25% smaller.

Javascript Compressor: Google Closure. This web service / web app will squash your javascript down nice and small using a variety of techniques.  With simple optimisations, I typically get around 40% reduction in code size. It also optimises your code for good measure.  They provide lots of detailed documentation to get you on your way.

Web Mapping Control: OpenLayers. It’s a bit of a no-brainer. I haven’t really looked that hard but is there anything that really competes with it (other than the Google Maps API)?

Web Mapping Server: UMN Mapserver. One day soon I am going to replace this entry with QGIS’ own mapserver implementation by Marco Hugentobler, but for now Mapserver is the best thing since sliced bread – it’s  a doddle to install, incredible flexible and you can generate basic mapfiles using QGIS so it’s easy to get started with. Also worth a mention is Mapnik which can produce gorgeous maps.

Web Mapping Cache: TileCache. I keep meaning to try out MapProxy since it supports region delimitation using shapefiles rather than bounding boxes – which can drastically reduce the size of your seeded cache. But for now, TileCache is really easy to set up and you should have it running in just a few minutes.

Did I leave anything out? If you take the above tools, software and web services, you will have everything you need to produce some great web mapping software.

pixelstats trackingpixel

FossGIS Web Mappers Toolbox

I thought I would take a moment to run through the tools in my digital toolbox that I use to develop GIS enabled web sites. I try to pick the best of breed in each area rather than learn multiple tools that do the same thing - life is short and there isn't enough time for me to do that.  I would be interested to read in the comments if anyone has suggestions of better alternatives:

Operating system: `Debian`_ or`Ubuntu Server Edition`_. Really don't run your web site on Windows, its just a silly waste of time and money.

Web server - `Apache 2`_. It's a no brainer really, its fast, robust and infinitely configurable while easy to get running in a default configuration.

Programmers editor: `Vim`_ (or emacs if you prefer). Being able to use the same editor on both local development machines and remote servers is indispesible. Also if you hand write your html it tends to have less gumpf clogging up the works compared to the Frontpage etc. generated sites I have seen out there. If you must use a GUI editor there are a few good choices under Linux, but VIM does it for me.

Web Application framework: `(Geo)Django`_. With its support for spatial extensions,  intuitive MVC architecture and wealth of 3rd party add-ons, Django is a great choice for building your web applications with Python.

Backend Database:`PostgreSQL/PostGIS`_. It does everything you need including store geospatial data.  Some people suggest SpatialLite as an alternative, but thus far I have haven't used it in a production system so I don't know what limitations, if any, it has.

Javascript Framework: `Jquery`_.I know there are some good competitors but JQuery and JQuery-UI are so great I haven't felt a need to go and discover their competitors. There are a huge number of add ons for JQuery and plenty of helpful people out there if you get stuck.

CSS Framework: `Blueprint CSS`_. I think CSS frameworks are still a relatively new concept. They take a lot of the pain out of layout and make your site look good with minimal effort. Blueprint implements the 960 grid and the results are pretty much always pleasing on the eye.

CSS Compressor: http://www.csscompressor.com/. This web site will take your CSS and squish it by removing comments, white space etc. It typically makes my  CSS files around 25% smaller.

Javascript Compressor: `Google Closure`_. This web service / web app will squash your javascript down nice and small using a variety of techniques.  With simple optimisations, I typically get around 40% reduction in code size. It also optimises your code for good measure. They provide lots of detailed documentation to get you on your way.

Web Mapping Control: `OpenLayers`_.It's a bit of a no-brainer. I haven't really looked that hard but is there anything that really competes with it (other than the Google Maps API)?

Web Mapping Server: `UMN Mapserver`_. One day soon I am going to replace this entry with QGIS' own mapserver implementation by Marco Hugentobler, but for now Mapserver is the best thing since sliced bread - it's  a doddle to install, incredible flexible and you can generate basic mapfiles using QGIS so it's easy to get started with. Also worth a mention is Mapnik which can produce gorgeous maps.

Web Mapping Cache: `TileCache`_. I keep meaning to try out MapProxy since it supports region delimitation using shapefiles rather than bounding boxes - which can drastically reduce the size of your seeded cache. But for now, TileCache is really easy to set up and you should have it running in just a few minutes.

Did I leave anything out? If you take the above tools, software and web services, you will have everything you need to produce some great web mapping software.

  • Page 1 of 1 ( 19 posts )
  • openlayers

Back to Top

Sustaining Members