
Hello world!
Welcome to WordPress. This is your first post. Edit or delete it, then start writing!
Last update:
Fri Jul 26 18:30:28 2024
 •
•
 •
•

 •
•
 •
•

Welcome to WordPress. This is your first post. Edit or delete it, then start writing!
 Background
Our web site (https://qgis.org) dates back to 2013, it is time for a revision!
As well as modernizing the look and feel of the site, we want the content to be updated to represent changes in the maturity of the project.
We want to appeal to new audiences, especially business and NGO decision makers (in particular the experience for the front pages), whilst still maintaining appeal to grass roots users (especially the lower level pages which contain many technical details and community collaboration notes).
We want to enhance our fund raising efforts through a site that encourages people to contribute to, as well as take from, the project.
 Existing effort
First some key links:
The above websites were created with a mix of technologies:
It will not be possible to unify the technology used for all of the above sites, but we want all of the web sites to have a cohesive appearance and the navigation flow between them to be seamless. For the main website at https://qgis.org and its child pages, we want to re-implement the site to provide a new experience – according to the design we have laid out in our figma board. Note that we want to follow this design. Some small tweaks will be fine but we are not looking for a ‘from scratch’ re-implementation of our design.
This will be our website for the next 10 years – you need to hand it over to us in a way that we can continue working on it and maintaining it without your intervention.
We are calling for proposals to help us with this migration as per the phases described below.
 Timeline
 Proposed site structure
 Outcome: We have a clear roadmap and design guide for migrating all of our websites to a consistent unified experience.
During this phase the contractor will focus on migrating the content of the main site to the new platform.
There will be an iterative review and feedback from the QGIS web team should be incorporated from biweekly check-in calls.
Outcome: https://qgis.org new site goes live! (Target date end of February 2024)
This is out of scope of the current call for proposals but should be part of the overall planning process:
This would be a collaborative process involving a QGIS funded web developer and the consultant.
Iterative review and feedback from the QGIS web team should be incorporated from biweekly check in calls.
Outcome: Auxiliary sites goes live with a cohesive look and feel to match the main site.
 What we will provide
 Qualification criteria
 Must have an established track record of website design and content creation.
Individuals or companies equally welcome to apply.
Any potential conflict of interest should be declared in your application.
Discussions will happen in English, with live discussions as well as written communication via issues or Pull request. Being reasonably fluent in English and understand the soft skills required to interact in a community project will be more than appreciated
 Payment milestones
10 % Kick off
40 % Phase 1 Completion
50 % Phase 2 Completion
 Indicative budget
We would like to point you to the QGIS Annual Budget so that you have a sense of our broad financial means (i.e. we will not be able to afford proposals in excess of €25,000 for phase 1+2).
https://www.qgis.org/en/site/getinvolved/governance/annual_reports/index.html
 Technology choices and IP:
 Proposal submission
Your proposal should consist of no more than 5 pages (include links to relevant annexes if needed) covering the following:
Please send your proposal to [email protected] by October 29nd 2023 midnight, anywhere on earth.
QGIS Server provides numerous services like WMS, WFS, WCS, WMTS and OGC API for Features. These last years, a lot of efforts were made to offer a robust implementation of the WMS 1.3.0 specification.
We are pleased to announce that QGIS Server LTR 3.28 is now certified against WMS 1.3.0.
This formal OGC certification process is performed once a year, specifically for the Long Term Release versions. But, as every change in QGIS source code is now tested against the formal OGC test suites (using OGC TeamEngine) to avoid any kind of regressions, you can always check any revision of the code against OGC failures in our Github continuous integration results.
All this has been possible thanks to the QGIS’s sustaining members and contributors.
Sorry, this entry is only available in Dutch.
Sorry… no English text as of yet. However, you’re welcome to have a look at the Dutch version (and use some automagic translation device)…
After a long hiatus, we are happy to announce that there will be a another international QGIS Contributor Meeting in conjunction with this year’s FOSS4G in Firenze, Italy from 18 to 22 August 2022.
QGIS Contributors Meetings are volunteer-driven events where contributors to the QGIS project from around the world get together in a common space – usually a university campus. The event is normally three days in duration and we hold two such events each year. During these events, contributors to the QGIS project take the opportunity to plan their work, hold face-to-face discussions and present new improvements to the QGIS project that they have been working on. Everybody attending the event donates their time to the project for the days of the event. As a project that is built primarily through online collaboration, these meetings provide a crucial ingredient to the future development of the QGIS project. The event is planned largely as an ‘unconference’ with minimal structured programme planning. We do this to allow attendees the freedom to meet dynamically with those they encounter at the event. Those sessions that are planned are advertised on the event web page and we try to enable remote participation through video conferencing software. Although our hosts are not funded and donate the working space to us, we show our appreciation by making one of our software release’s splash screens in honour of that host, which is a great way to gain exposure of your institution and country to the hundreds of thousands of users that make use of QGIS.
For more details and to sign up, please visit the corresponding wiki page.
This is a public service announcement:
Our developers have discovered a critical issue in QGIS 3.16.12 which may cause plugins to hang on Windows. All users are encouraged to upgrade to 3.16.13

Megaphone icon made by BomSymbols from www.flaticon.com
Sometimes after a Windows update, or after a QGIS update Windows users see the dreaded “Oops, looks like an error loading QGIS’… Could not load qgis_app.dll…” message In short it means that one of the main libraries of QGIS cannot be fully loaded, because it is actually depending on other libraries, which (apparently) are not […]
Mostly interesting for dutchies: there is a new version of the PDOKServiceplugin, a plugin which makes it easier to set a WMS/WFS/WCS layer into QGIS from our national OWS services: PDOK. Best addition for now: free High Resolution images of almost the whole of The Netherlands. To show of the old and the new version: […]
Dear QGIS Users
On Friday, 24 September 2021 we will be holding our monthly QGIS Open Day!
Programme
My QGIS. Each of us has a specialty in QGIS and our own workflows and tricks join this months QGIS Openday to learn from each other.
Where to watch
Please see the event wiki page at for all the details of times and links for participation.
All of the YouTube live-streamed events will be recorded and made available on the QGIS Open Day Youtube channel.
If you missed the last event, have a look at the excellent contributions by Leonardo Nazareth (Brazil), Victoria Neema (Kenya), and Tim Sutton (Portugal):

(YouTube live streams sometimes take 24 hours to be available for catch-up viewing. Be sure to check back here for updates!)
Participants are kindly reminded to please read and observe our QGIS Code of Conduct and Diversity Statement to make these events a great experience for everyone!
Please contact Amy on Twitter @amzenviro or via the Telegram Channel if you have any queries or need help setting up events.
We look forward to seeing you there!
Regards
The QGIS Open Day Organising Team!
Being part of an open community like QGIS is a unique experience. We get to engage with and become friends with people from many different backgrounds and walks of life. Each person brings their unique flavour to the project and helps create something that is more than just the sum of its parts. The QGIS community is blessed enough to also have attracted some of the greatest minds in the Open Source Geospatial community.
Martin Isenburg was one of these great minds – his work on LASTools and making LiDAR data accessible to the world was truly groundbreaking. The .LAS/.LAZ formats for point cloud data have become ubiquitous, supported by virtually all point cloud processing tools in existence.
This week we received the incredibly sad news that Martin is no longer with us. Martin was a regular fixture at QGIS Hackfests, sitting quietly to one side doing incredible things with his plugin that integrates LASTools into QGIS or sharing a stand-up paddleboard outing with fellow QGISers.
Beyond being a gifted software developer, Martin was acutely aware of our impact on the world and its perilous ecological state. Like many in the QGIS community, he cared not only about technology but also about the potential of technology to transform lives and improve the planet and the human condition. With great sadness, we say a last goodbye to Martin Isenburg and wish his loved ones our deepest condolences.
Thank you, Martin, we will miss you.
The QGIS Community
It is with a heavy heart that we announce that on 2021-05-31, our friend and colleague Håvard Tveite has passed away at the age of 59 after a period of illness.
Håvard was a very active member of the QGIS community, providing valuable input to the documentation, developing numerous plugins, and taking care of the QGIS Resources Sharing Repository to name just a few of his contributions.
Besides his contributions to the QGIS project, Håvard was also an active volunteer in the Norwegian Orienteering Federation and in the International Orienteering Federation Map Commission (more: https://orienteering.sport/norwegian-great-havard-tveite-has-passed-away/)
The QGIS community would like to extend our heartfelt condolences to Håvard’s wife Ingrid and son Nils. Håvard’s contributions to the QGIS Project will leave a lasting impact on the lives of many people around the world as they benefit from the work he has done on a daily basis.
R.I.P. Håvard
Dear QGIS Users
On Friday, 26 March 2021 we will be holding our monthly QGIS Open Day! What is a QGIS Open Day you may be wondering to yourself? It is an initiative to replace the wonderful community meetups we used to hold every six months when times were different. Like our in-person meetings, the event is organised on the principle of self-organisation and community participation.
Programme
Where to watch
Please see the event wiki page at QHF-March-2021 Wiki for all the details of times and links for participation.
All of the YouTube live-streamed events will be recorded and made available to users who couldn’t make the live events. YouTube live streams sometimes take 24 hours to be available for catch-up viewing. Be sure to check back here for updates!
Participants are kindly reminded to please read and observe our QGIS Code of Conduct and Diversity Statement to make these events a great experience for everyone!
Please contact me, Zinziswa Xakayi by email [email protected] or via the Telegram Channel username @zinzixakayi if you have any queries or need help setting up events.
We look forward to seeing you there!
Regards

The QGIS Open Day Organising Team!
Short notice that there is a new version of the PDOKservices plugin for QGIS, adding aerials 2020 and a way to set two favourite layers.
We are running out of space on our server running https://plugins.qgis.org – a sign of success, given the large number of plugins and plugin versions hosted on the platform. On Thursday 28 January at 9am West European Time, we will bring the server offline for a scheduled upgrade to the storage space on the server. We anticipate that the work will be completed within an hour. We thank you for your patience whilst we undertake this critical maintenance.
The maintenance of QGIS infrastructure is undertaken largely by volunteers and the cost of servers and hosting related costs are funded by your donations and sustaining memberships. If you would like to help support this (and the many other excellent initiatives carried out by QGIS.org), please consider heading over to https://qgis.org/en/site/getinvolved/governance/sustaining_members/sustaining_members.html#how-can-you-support-the-qgis-development to find out how you can help!
Sorry, this entry is only available in Dutch.
QGIS more and more get’s to be installed ‘organisation wide’ by Windows Administrators (eg using SCCM, now Microsoft Endpoint Configuration Manager ), instead of personal installations by the GIS-people on their personal machines. I get more and more questions about this (eg here) So a short post about this. The good thing is that peeps […]
Dear Community,
2020, as we all know, has been an unusual year. In addition to all the other issues we have all faced, we also had to cancel our beloved hackfests. Since we first started holding bi-annual hackfests in 2009, this will be the first year without an in-person event where our friendly community can meet.
That can’t be! We are a modern and thriving community based on exchange, discussion and collaboration and should foster this even when physical meetings are not possible.
I’m super excited to announce that after some very motivating discussions on the HackFest telegram channel and in the PSC, starting from next week on every last Friday of each month we will hold an informal online virtual meeting to hack around, document, discuss and in general meet the awesome QGIS community.
There will normally be no formal agenda, no fixed schedule nor moderators, simply join the QHackFriday (pronounced KwakFriday) jitsi room and say hi!
I added a page to the wiki, so if you have topics that you like to discuss/present you can put them there and others might join you.
Stay safe and see you next Friday!
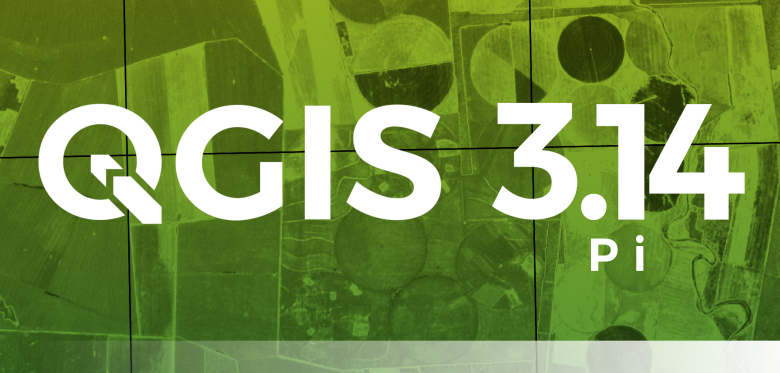
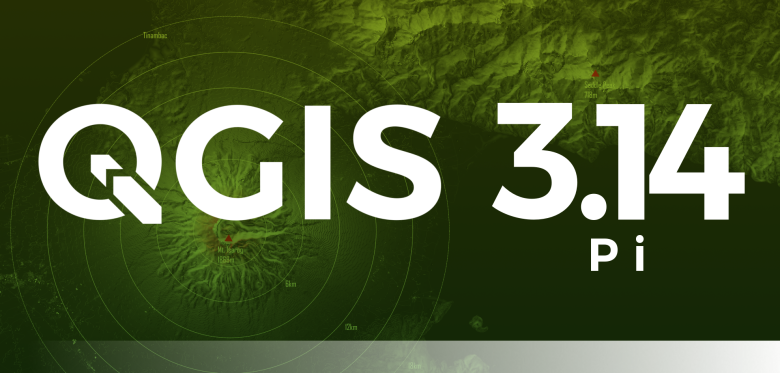
As you may have noticed, the next release version will be 3.14 and therefore, we will call it ‘Pi’.
Usually our versions are named for community meeting locations and the splash screen shows a map related to this location.
For 3.14 we were looking for creative maps that capture the essence of Pi.
The submission phase was open for two weeks and we received numerous inspiring submissions:

From these submissions, a short list of top 3 candidates was compiled and put up for the public vote:
Candidate #1 Ezequiel Orquera writes about his submission: “As an agronomist, Pi is used every single time that you need to develop a pivot irrigation system (those nice circles we can see on sat. images), making most use of Pi number and the radius. In this image, we can see the circles in contrast with rectangles shapes. The interest thing is that on most of the circles you can see the irrigation system arm that is coming from the center of each circle, making it the radius. Furthermore we all know that Pi x r^2 = circle area. This is useful to estimate for example, crop yields.”
Candidate #2 Francis Josef Gasgonia writes about his submission: “This map would not be complete without the use of Pi. Multicentric ring buffers represent potential danger zones in this map of Mt. Isarog in the Philippines. The calculations necessary to develop the ring buffers depend on Pi. Mt. Isarog is classified as a potentially active stratovolcano. This map best represents the use of Pi in a map because these buffers are crucial in disaster planning, especially now in a Covid-19 pandemic world; wherein ring buffers, and other types of buffers are in use for humanitarian and logistics planning.”
Candidate #3 Michel Stuyts writes about his submission: “Since Pi is very much linked to circles, I looked for the most circular place I could find. The place I made a map of is Vahanga, an atoll in the Pacific Ocean. I decorated the map with angles of a circle in radians as divisions of Pi. Because QGIS splash screens usually show a map of a location where a developer meeting was, the chance it would ever have a map of this part of the world is just as irrational as Pi, because the closest inhabited place is more than a 1000km away. My map is also linked to Corona (the reason there was no dev meeting in the first place), because the atoll is crown shaped and Corona means crown. Besides being linked to Pi and Corona, my map is also very much linked to QGIS, because it’s 100% made with QGIS. The angles in radians where made with “geometry generators” from the central point. The fills where made using “random marker fills” combined with an expression using “randf()” to set the size of the markers with a “Data defined override”. For the shallow water on the inside of the atoll I used a “Shapeburst fill”.“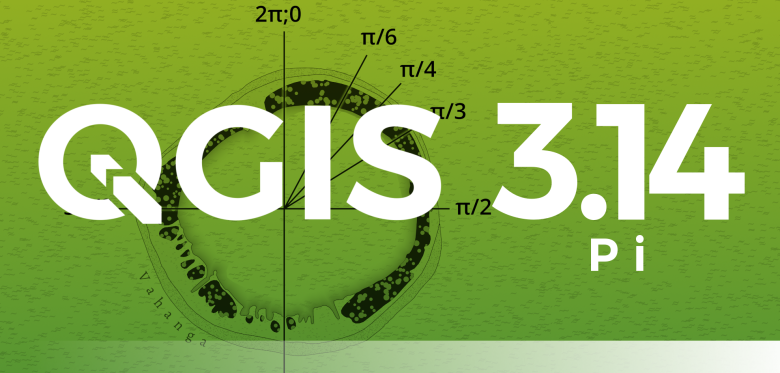
In the public vote, Francis Josef Gasgonia’s map received the most votes (46%):

Congratulations Francis and thank you again to everyone who participated in this fun contest to ensure that QGIS 3.14 Pi will have great visuals!
Dear QGIS Community
We recently held our 2020 QGIS Annual General Meeting. The minutes of this meeting are available for all to view.
I would like to welcome our new QGIS Board Chair: Marco Bernasocchi and our new QGIS Board Vice-Chair and QGIS PSC Member, Alessandro Pasotti. In case you are not familiar with Marco and Alessandro, you can find short introductions to them below. I will continue to serve on the PSC and am pleased also to say that the project governance is in good hands with Jürgen Fischer, Andreas Neumann and Anita Graser kindly making themselves available to serve on the PSC for another two years. It is also great to know that our project founder, Gary Sherman, as well as long-term PSC member Tim Sutton continue to serve on the PSC as honorary PSC members. They both set the standard for our great project culture and it is great to have his continued presence.
QGIS has been growing from strength to strength, backed by a really amazing community of kind and collaborative users, developers, contributors and funders. I am looking forward to seeing how it continues to grow and flourish and I am excited and confident it will do so with Marco acting as the project chair and representative. Rock on QGIS!
Marco Bernasocchi (http://berna.io @mbernasocchi)
I am an open source advocate, consultant, teacher and developer. My background is in geography with a specialization in geographic information science. I live in Switzerland in a small Romansh speaking mountain village where I love scrambling around the mountains to enjoy the feeling of freedom it gives me. I’m a very communicative person, I fluently speak Italian, German, French English and Spanish and love travelling.
I work as director of OPENGIS.ch which I founded in 2011. Since 2015 I share the company ownership with Matthias Kuhn. At OPENGIS.ch LLC we (6 superstar devs and myself) develop, train and consult our client on any aspect related to QGIS.
My first QGIS (to be correct for that time QuantumGIS) ever was “Simon (0.6)” during my BSc when the University of Zurich was teaching us proprietary products and I started looking around for Open Source alternatives. In 2008, when starting my MSc, I made the definitive switch to ubuntu and I started working more and more with QGIS Metis (0.11) and ended developing some plugins and part of Globe as my Masters thesis. Since three years the University of Zurich invites me to hold two seminars on Entrepreneurship and Open Source. In November 2011 I attended my first Hackfest in Zürich where I started porting all QGIS dependencies and developing QGIS for Android under a Google Summer of Code. A couple of years and a lot of work later QField was born. Since then I’ve always tried to attend at least to one Hackfest per year to be able to feel first hand the strong bonds within our very welcoming community. In 2013 i was lucky enough to have a release named after a suggestion I saved you all from having QGIS 2.0 – Hönggerberg and giving you instead QGIS 2.0 – Dufour. In 2018 I’ve been honored to be nominated Co-chair of the QGIS PSC, since then I’ve been taking care of GitHub, the user groups, running votes, elections, doing some small work on the website, giving more talks on opensource advocacy and foremost helping in the day to day work needed to help our amazing project keep on growing.
Beside my long story with QGIS as user and passionate advocate I have a long story as QGIS service provider where we are fully committed to its stability, feature richness and sustainable development. For that in 2019 we started our own QGIS sustainability initiative financed through our support contracts.
Alessandro Pasotti (@elpaso https://www.itopen.it, https://www.qcooperative.net)
I am an open source software developer and I live in Italy. By education I’m an agronomist with some topography and pedology background, but I turned to the dark side early in my career and I started programming any kind of device that has a chip inside as soon as their price dropped low enough. I started using Linux in 1994 and after some real work as an R&D data analyst for a big pharmaceutical company I started my own small business that was making map-based web applications for the touristic market (there was no Google Map and such at that time) and it is for this reason that I discovered GRASS, Mapserver, PostGIS and finally QGIS when I needed a GIS viewer.
Over the years I’ve made minor contributions to several open source projects and I created a bunch of QGIS Python plugins, but it is from the QGIS Lisbon Hack-Fest in 2011 that I really got involved within the community and my first big contribution was a new website for the fast growing set of QGIS Python plugins (the one that it is already in production today at https://plugins.qgis.org ).
8 years ago I re-started to write some C++ code and I’m now a QGIS core developer and a proud member of this amazing community.
Regards
Paolo Cavallini (outgoing Chair)
