


QGIS Annual General Meeting – 2020
Dear QGIS Community
We recently held our 2020 QGIS Annual General Meeting. The minutes of this meeting are available for all to view.
I would like to welcome our new QGIS Board Chair: Marco Bernasocchi and our new QGIS Board Vice-Chair and QGIS PSC Member, Alessandro Pasotti. In case you are not familiar with Marco and Alessandro, you can find short introductions to them below. I will continue to serve on the PSC and am pleased also to say that the project governance is in good hands with Jürgen Fischer, Andreas Neumann and Anita Graser kindly making themselves available to serve on the PSC for another two years. It is also great to know that our project founder, Gary Sherman, as well as long-term PSC member Tim Sutton continue to serve on the PSC as honorary PSC members. They both set the standard for our great project culture and it is great to have his continued presence.
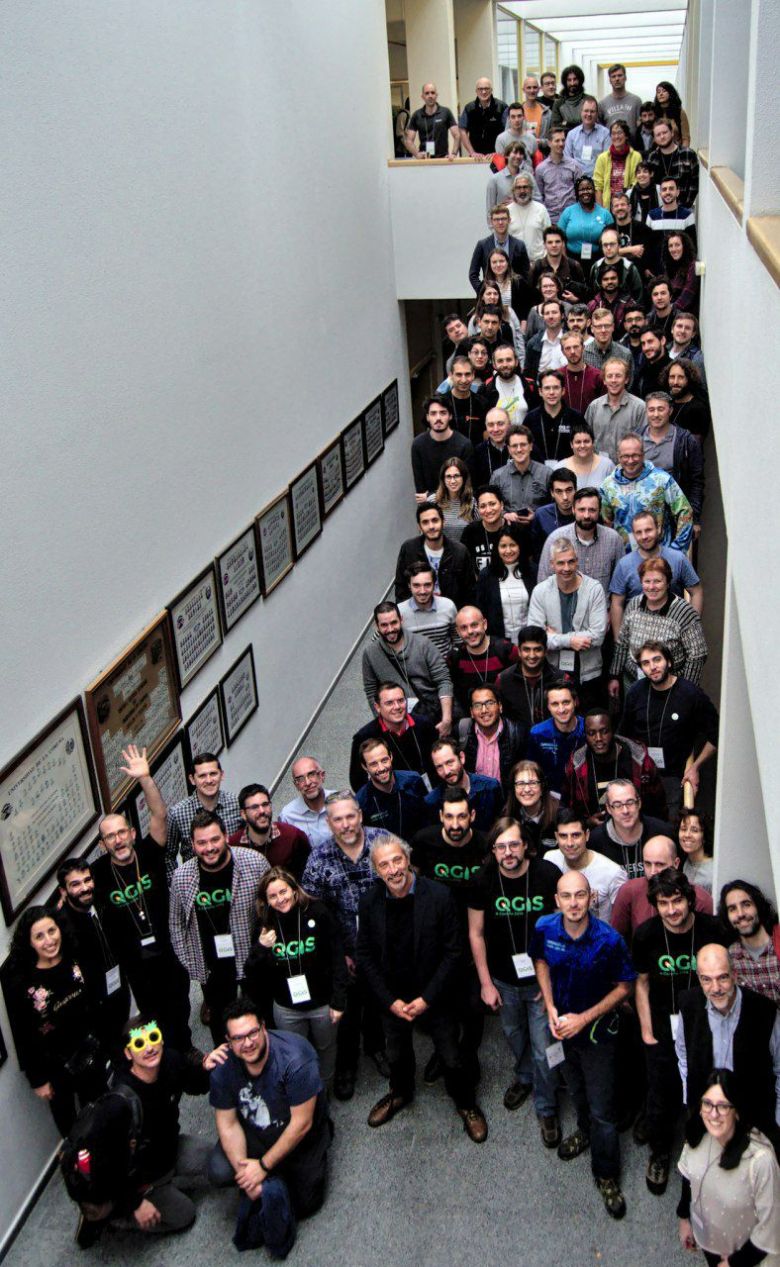
QGIS has been growing from strength to strength, backed by a really amazing community of kind and collaborative users, developers, contributors and funders. I am looking forward to seeing how it continues to grow and flourish and I am excited and confident it will do so with Marco acting as the project chair and representative. Rock on QGIS!
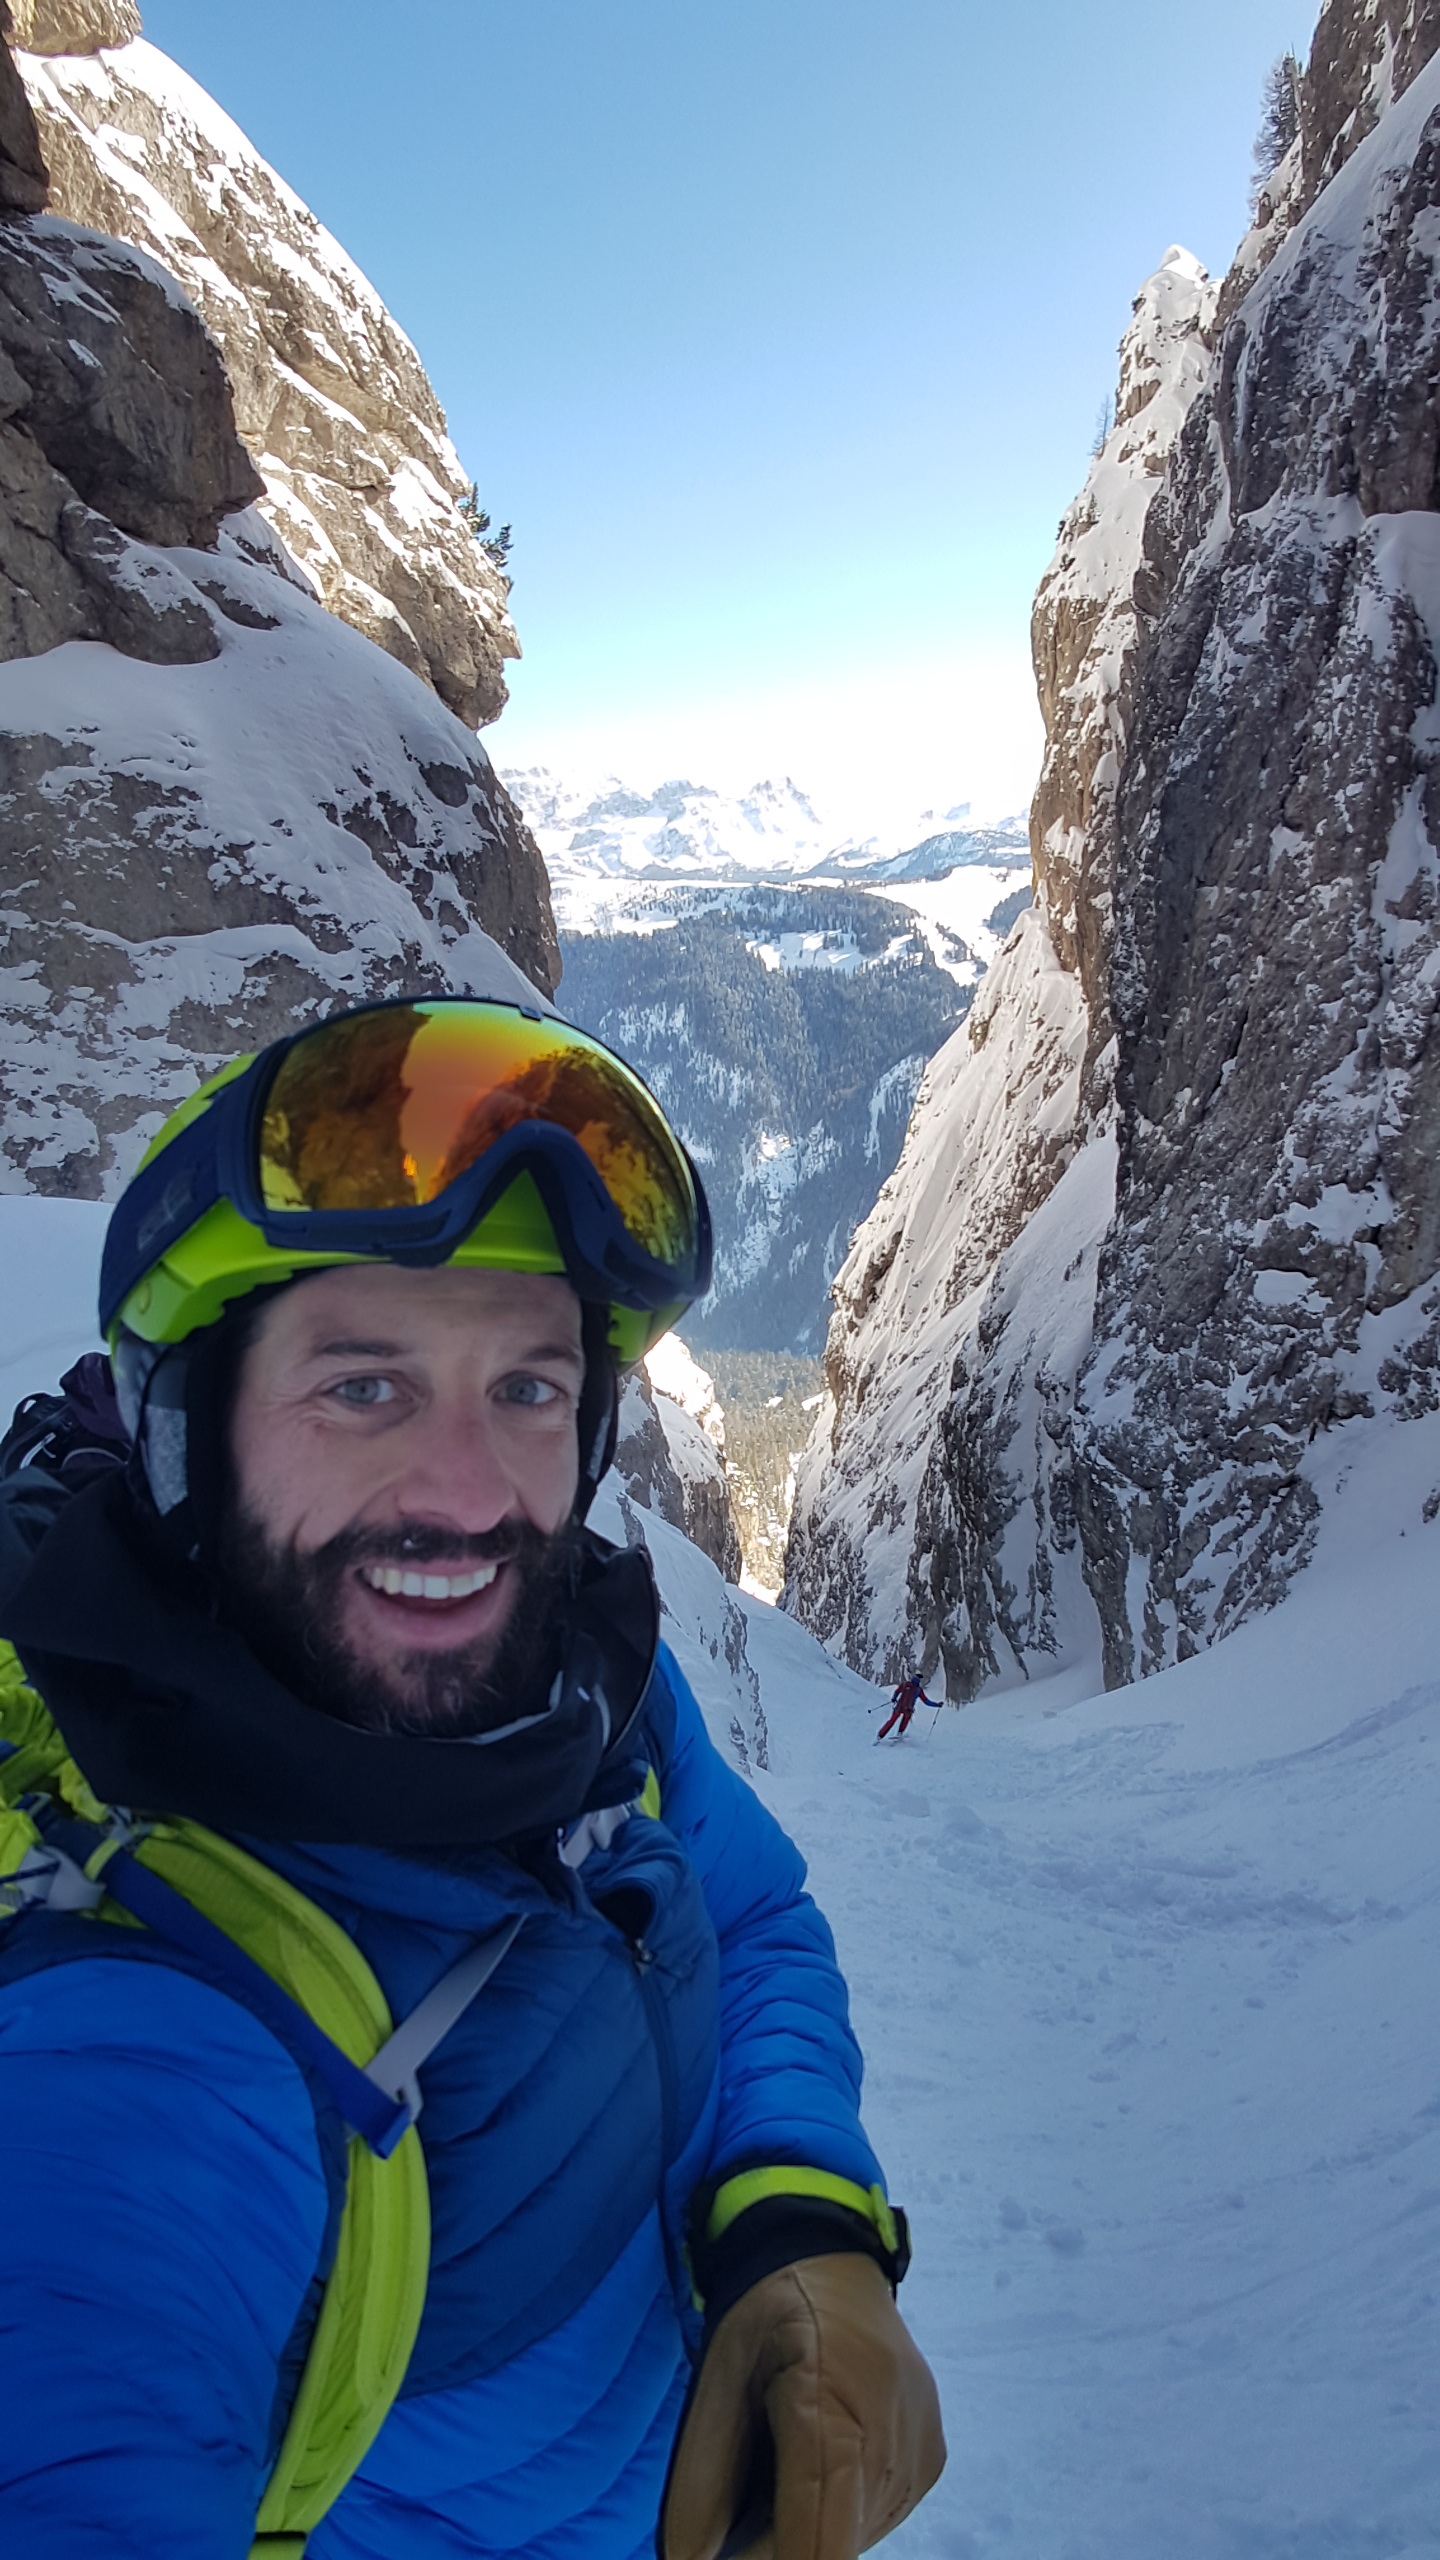
Marco Bernasocchi (http://berna.io @mbernasocchi)

I am an open source advocate, consultant, teacher and developer. My background is in geography with a specialization in geographic information science. I live in Switzerland in a small Romansh speaking mountain village where I love scrambling around the mountains to enjoy the feeling of freedom it gives me. I’m a very communicative person, I fluently speak Italian, German, French English and Spanish and love travelling.
I work as director of OPENGIS.ch which I founded in 2011. Since 2015 I share the company ownership with Matthias Kuhn. At OPENGIS.ch LLC we (6 superstar devs and myself) develop, train and consult our client on any aspect related to QGIS.
My first QGIS (to be correct for that time QuantumGIS) ever was “Simon (0.6)” during my BSc when the University of Zurich was teaching us proprietary products and I started looking around for Open Source alternatives. In 2008, when starting my MSc, I made the definitive switch to ubuntu and I started working more and more with QGIS Metis (0.11) and ended developing some plugins and part of Globe as my Masters thesis. Since three years the University of Zurich invites me to hold two seminars on Entrepreneurship and Open Source. In November 2011 I attended my first Hackfest in Zürich where I started porting all QGIS dependencies and developing QGIS for Android under a Google Summer of Code. A couple of years and a lot of work later QField was born. Since then I’ve always tried to attend at least to one Hackfest per year to be able to feel first hand the strong bonds within our very welcoming community. In 2013 i was lucky enough to have a release named after a suggestion I saved you all from having QGIS 2.0 – Hönggerberg and giving you instead QGIS 2.0 – Dufour. In 2018 I’ve been honored to be nominated Co-chair of the QGIS PSC, since then I’ve been taking care of GitHub, the user groups, running votes, elections, doing some small work on the website, giving more talks on opensource advocacy and foremost helping in the day to day work needed to help our amazing project keep on growing.
Beside my long story with QGIS as user and passionate advocate I have a long story as QGIS service provider where we are fully committed to its stability, feature richness and sustainable development. For that in 2019 we started our own QGIS sustainability initiative financed through our support contracts.
Alessandro Pasotti (@elpaso https://www.itopen.it, https://www.qcooperative.net)

I am an open source software developer and I live in Italy. By education I’m an agronomist with some topography and pedology background, but I turned to the dark side early in my career and I started programming any kind of device that has a chip inside as soon as their price dropped low enough. I started using Linux in 1994 and after some real work as an R&D data analyst for a big pharmaceutical company I started my own small business that was making map-based web applications for the touristic market (there was no Google Map and such at that time) and it is for this reason that I discovered GRASS, Mapserver, PostGIS and finally QGIS when I needed a GIS viewer.
Over the years I’ve made minor contributions to several open source projects and I created a bunch of QGIS Python plugins, but it is from the QGIS Lisbon Hack-Fest in 2011 that I really got involved within the community and my first big contribution was a new website for the fast growing set of QGIS Python plugins (the one that it is already in production today at https://plugins.qgis.org ).
8 years ago I re-started to write some C++ code and I’m now a QGIS core developer and a proud member of this amazing community.
Regards
Paolo Cavallini (outgoing Chair)


 QGIS 3.4 has recently become our new Long Term Release (LTR) version. This is a major step in our history – a long term release version based on the massive updates, library upgrades and improvements that we carried out in the course of the 2.x to 3x upgrade cycle.


