Related Plugins and Tags

QGIS Planet

QGIS Add to Felt Plugin – Phase 2

We have been continuing our work with the Flagship sponsor of QGISFelt to develop their QGIS Plugin – Add to Felt  that makes it even easier to share your maps and data on the web.

What is the ‘Add to Felt’ QGIS Plugin?

The ‘Add to Felt’ QGIS Plugin is a powerful tool that empowers users to export their QGIS projects and layers directly to a Felt web map. This update introduces two fantastic features:

  1. Single Layer Sharing: You can now share a single layer from your QGIS project to a Felt map. This means you have greater control over which specific data layers to share, allowing you to tailor your map precisely to your audience’s needs.
  2. Map Selection: With the updated plugin, you can choose which map on Felt to add your layer to – a new map, or an ongoing project. This flexibility simplifies your workflow and ensures that your data ends up in the right place.

Businesses that rely on QGIS love how these new features provide a seamless way to view and share results, ultimately allowing them to move more quickly and stay in sync:

“Felt helps us keep each other updated on what we’ve done, what we’ve modeled, how things are progressing.” – ICON Engineering

Why is this Update Important?

Web maps are invaluable tools for sharing data with a wider audience, be it colleagues, clients, or the public. They provide creators with the ability to control data visibility, display options, and audience access, all within an easily shareable digital format. However, creating web maps can be an arduous and complex task.

Here’s where the ‘Add to Felt’ QGIS Plugin update comes to the rescue:

1. Streamlining the Process: Creating web maps traditionally involves website development, data hosting, and map application development—tasks that require a diverse skill set. This complexity can be a significant barrier, especially for smaller operations with limited resources or budget constraints.

2. Felt Simplifies Web Mapping: Felt makes it effortless to create web maps, and share them as easily as you would a Google Doc or Sheet. Simply drag and drop your data, customize the symbology to your liking, and share the map with a link or by inviting collaborators. No need to send large data files or answer questions about the map’s data sources.

3. Integration with QGIS: Now, the ‘Add to Felt’ QGIS Plugin bridges the gap between QGIS and Felt. It seamlessly imports your QGIS data into Felt, eliminating the need for manual data transfers and reducing the complexity of web map creation.

In essence, the ‘Add to Felt’ QGIS Plugin update simplifies the process of sharing and collaborating on web maps. It empowers users to harness the full potential of web-based mapping, making it accessible to everyone, regardless of their technical expertise. The update makes it even easier to share progress updates or model re-run outputs without creating a new map, or sharing a new map link.

So, if you’re a QGIS user looking to enhance your map-sharing capabilities and streamline your workflow, make sure to take advantage of this fantastic update. Say goodbye to the complexities of web map creation and hello to effortless, data-rich web maps with Felt and the ‘Add to Felt’ QGIS Plugin.

How to install and upgrade

  • Open QGIS on your computer. You must have version 3.22 or later installed.
  • In the plugins tab, select Manage and Install Plugins.
  • Search for the ‘Add to Felt’ plugin, select and click Install Plugin.
  • Close the Plugins dialog. The Felt plugin toolbar will appear in your toolbar for use.
  • Sign into Felt and begin sharing your maps to the web.

If you want more features in this plugin, let us know or you’re interested in exploring how a QGIS plugin can make your service easily accessible to the millions of daily QGIS users, contact us to discuss how we can help!

Soar.Earth Digital Atlas QGIS Plugin

Soar banner

Growing up, I would spend hours lost in National Geographic maps. The feeling of discovering new regions and new ways to view the world was addictive! It’s this same feeling of discovery and exploration which has made me super excited about Soar’s Digital Atlas. Soar is the brainchild of Australian, Amir Farhand, and is fuelled by the talents of staff located across the globe to build a comprehensive digital atlas of the world’s maps and images. Soar has been designed to be an easy to use, expansive collection of diverse maps from all over the Earth. A great aspect of Soar is that it has implemented Strong Community Guidelines and moderation to ensure the maps are fit for purpose.

Recently, North Road collaborated with Soar to help facilitate their digital atlas goals by creating a QGIS plugin for Soar. The Soar plugin allows QGIS users to directly:

  • Export their QGIS maps and images straight to Soar
  • Browse and load maps from the entire Soar public catalogue into their QGIS projects

There’s lots of extra tweaks we’ve added to help make the plugin user friendly, whilst offering tons of functionality that power users want. For instance, users can:

  • Filter Soar maps by their current project extent and/or by category
  • Export raw or rendered raster data directly to Soar via a Processing tool
  • Batch upload multiple maps to Soar
  • Incorporate Soar map publishing into a Processing model or Python based workflow

Soar will be presenting their new plugin at the QGIS Open Day in August so check out the details here and tune in at 2300 AEST or 1300 HR UTC. You can follow along via either YouTube or Jitsi.

Browsing Soar maps from QGIS

One of the main goals of the Soar QGIS plugin was to make it very easy to find new datasets and add them to your QGIS projects. There’s two ways users can explore the Soar catalog from QGIS:

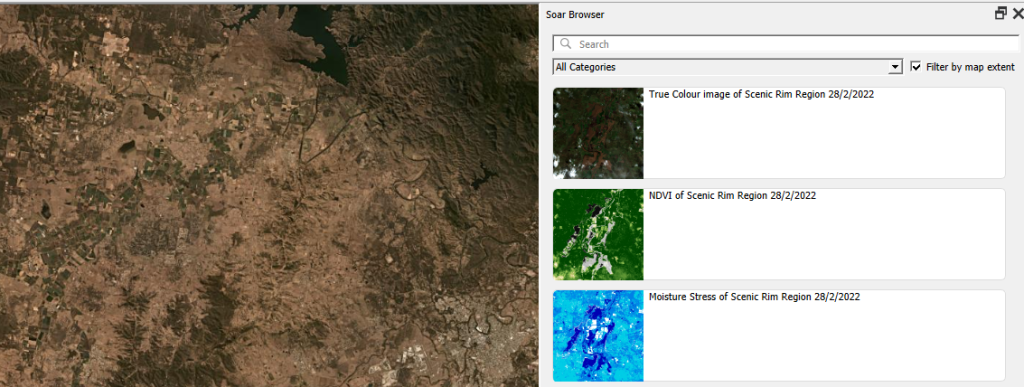
You can open the Soar Browser Panel via the Soar toolbar button  Soar browser . This opens a floating catalog browser panel which allows you to interactively search Soar’s content while working on your map.

Soar browser panel

Alternatively, you can also access the Soar catalog and maps from the standard QGIS Data Source Manager dialog. Just open the “Soar” tab and search away!

When you’ve found an interesting map, hit the “Add to Map” button and the map will be added as a new layer into your current project. After the layer is loaded you can freely modify the layer’s style (such as the opacity, colorization, contrast etc) just like any other raster dataset using the standard QGIS Layer Style controls.

Sharing your maps

Before you can share your maps on Soar, you’ll need to first sign up for a free Soar account.

We’ve designed the Soar plugin with two specific use cases in mind for sharing maps. The first use case is when you want to share an entire map (i.e. QGIS project) to Soar. This will publish all the visible content from your map onto Soar, including all the custom styling, labeling, decorations and other content you’ve carefully designed. To do this, just select the Project menu, Import/Export -> Export map to Soar option.

Upload via Project to Soar

You’ll have a chance to enter all the metadata and descriptive text explaining your map, and then the map will be rendered and uploaded directly to Soar.

Soar Metadata

All content on the Soar atlas is moderated, so your shared maps get added to the moderation queue ready for review by the Soar team. (You’ll be notified as soon as the review is complete and your map is publicly available).

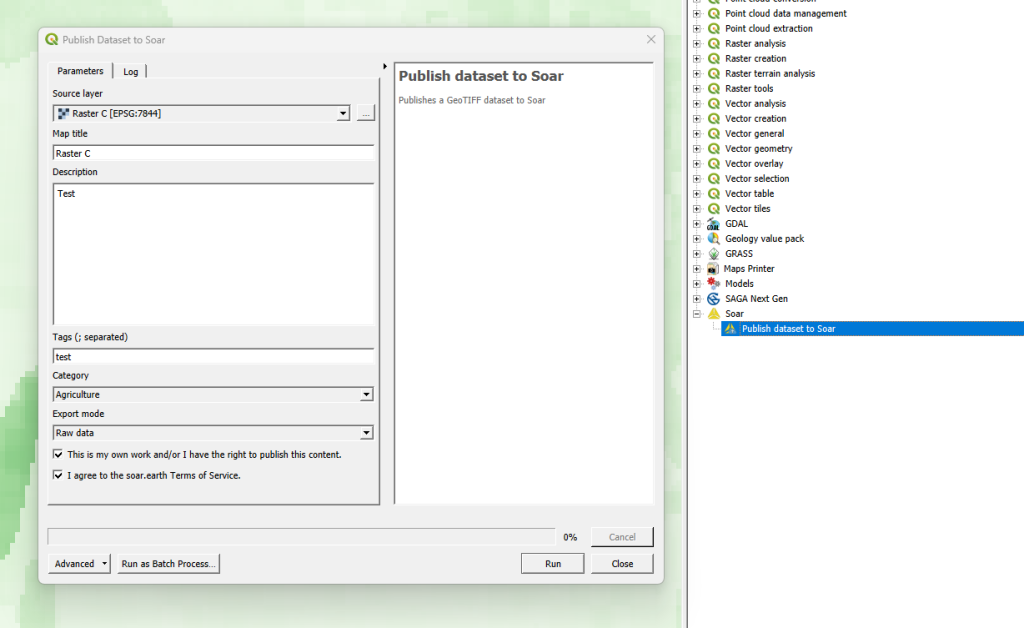
Alternatively, you might have a specific raster layer which you want to publish on Soar. For instance, you’ve completed some flood modelling or vegetation analysis and want to share the outcome widely. To do this, you can use the “Publish dataset to Soar” tool available from the QGIS Processing toolbox:

Upload product to Soar via processing tools

Just pick the raster layer you want to upload, enter the metadata information, and let the plugin do the rest! Since this tool is made available through QGIS’ Processing framework, it also allows you to run it as a batch process (eg uploading a whole folder of raster data to Soar), or as a step in your QGIS Graphical Models!

Some helpful hints

All maps uploaded to Soar require the following information:

  • Map Title
  • Description
  • Tags
  • Categories
  • Permission to publish

This helps other users to find your maps with ease, and also gives the Soar moderation team the information required for their review process.

We’ve a few other tips to keep in mind to successfully share your maps on Soar:

  • The Soar catalog currently works with raster image formats including GeoTIFF / ECW / JP2 / JPEG / PNG
  • All data uploaded to Soar must be in the WGS84 Pseudo-Mercator (EPSG: 3857) projection
  • Check the size of your data before sharing it, as a large size dataset may take a long time to upload

So there you have it! So simple to start building up your contribution to Soar’s Digital Atlas. Those who might find this useful to upload maps include:

  • Community groups
  • Hobbyists
  • Building a cartographic/geospatial portfolio
  • Education/research
  • Contributing to world events (some of the biggest news agencies already use this service i.e. BBC)

You can find out more about the QGIS Soar plugin at the QGIS Open Day on August 23rd, 2023 at 2300 HR AEST or 1300 HR UTC. Check here for more information or to watch back after.

If you’re interested in exploring how a QGIS plugin can make your service easily accessible to the millions of daily QGIS users, contact us to discuss how we can help!

‘Add to Felt’ QGIS Plugin

The gift economy of Open Source is community driven and filled by folks with ideas that just go for it!

We at North Road are blessed that we get to join these creatives on their journey in order to get their products to you. Recently, the first QGIS flagship sponsor, Felt, engaged us to further strengthen their support for the up to 600,000 daily QGIS users to integrate their workflows between QGIS and Felt.

The result is the “Add to Felt” QGIS Plugin, which makes it super-simple to publish your QGIS maps to the Felt platform.

To get started, install the Add to Felt Plugin from the QGIS Plugin manager.

If you don’t have a free Felt account, you’ll need to sign up for one online (or from the Add to Felt plugin itself once you have installed it).

Within QGIS, users can easily publish their maps and layers to Felt. You can either:

  • Publish a single layer by right-clicking the layer and selecting “Share Layer to Felt” from the Export sub-menu
  • Publish your whole QGIS project/map by selecting the Project Menu, Export, “Add to Felt” action

Whilst Felt is loading up your map, you can continue working and it will let you know once your map is ready to open on Felt and share with others.

We are happy to let you know that the collaboration does not stop there! As with our SLYR tool, there is ongoing development as the requirements of the community and technology grow.  So install the Add to Felt Plugin via the QGIS Plugin manager, and let us know where you want it to go via the Add to Felt GitHub page.

Read more about it here:

Announcing SLYR Community Edition

North Road are proud to announce the official release of SLYR Community Edition, a new open-source version of our powerful SLYR ESRI to Open Source compatibility suite. The Community Edition is available for download from the official QGIS plugin repository today, for QGIS versions 3.4 and above. It supports automated conversion of ESRI .style symbol databases, including conversion of markers, fills, line styles and color ramps to their closest QGIS symbology equivalent, allowing users to instantly transition their style libraries into QGIS!

If you’ve followed our work in the past, it will come as no surprise to hear that North Road are passionate about open source geospatial, and for reducing the barriers which users encounter when moving to open-source software. We see our SLYR tool as an integral part of this process, and the licensed version of the plugin currently supports automated conversion of MXD, LYR, PMF, and other ESRI-specific formats to QGIS documents.

Our intention all along has been to make this tool freely available for all users of open-source geospatial software, and to release our work under a permissive, open-source license so that other projects can take advantage of our reverse engineering efforts. That’s why we made an “open source pledge” a fundamental part of our SLYR tool development! By the terms of this pledge, exactly six months after we hit staged preset funding levels we will open-source more components of the code and update the community version of the plugin accordingly. (This approach gives motivated organisations instant access to the full functionality of the SLYR tool via a license purchase, or free access to a subset of this functionality via the community edition of the plugin. It allows us to heavily invest in further reverse-engineering efforts and improvements to the plugin, to QGIS, and to the wider open-source geospatial community.)

If you’re keen to explore transitioning your workplace from ESRI to open-source, send us an email to discuss what we can offer! North Road staff have years of experience in implementing open-source geospatial solutions within commercial workplaces, and for setting up dual commercial-and-open-source friendly environments.

The road to QGIS 3.0 – part 1

qgis_icon.svgAs we discussed in QGIS 3 is under way, the QGIS project is working toward the next major version of the application and these developments have major impact on any custom scripts or plugins you’ve developed for QGIS.

We’re now just over a week into this work, and already there’s been tons of API breaking changes landing the code base. In this post we’ll explore some of these changes, what’s motivated them, and what they mean for your scripts.

The best source for keeping track of these breaking changes is to watch the API break documentation on GitHub. This file is updated whenever a change lands which potentially breaks plugins/scripts, and will eventually become a low-level guide to porting plugins to QGIS 3.0.

API clean-ups

So far, lots of the changes which have landed have related to cleaning up the existing API. These include:

Removal of deprecated API calls

The API has been frozen since QGIS 2.0 was released in 2013, and in the years since then many things have changed. As a result, different parts of the API were deprecated along the way as newer, better ways of doing things were introduced. The deprecated code was left intact so that QGIS 2.x plugins would still all function correctly. By removing these older, deprecated code paths it enables the QGIS developers to streamline the code, remove hacky workarounds, untested methods, and just generally “clean things up”. As an example, the older labelling system which pre-dates QGIS 2.0 (it had no collision detection, no curved labels, no fancy data defined properties or rule based labelling!) was still floating around just in case someone tried to open a QGIS 1.8 project. That’s all gone now, culling over 5000 lines of outdated, unmaintained code. Chances are this won’t affect your plugins in the slightest. Other removals, like the removal of QgsMapRenderer (the renderer used before multi-threaded rendering was introduced) likely have a much larger impact, as many scripts and plugins were still using QgsMapRenderer classes and calls. These all need to be migrated to the new QgsMapRendererJob and QgsMapSettings classes.

Renaming things for consistency

Consistent naming helps keep the API predictable and more user friendly. Lots of changes have landed so far to make the naming of classes and methods more consistent. These include things like:

  • Making sure names use consistent capitalization. Eg, there was previously methods named “writeXML” and “writeXml”. These have all been renamed to consistently use camel case, including for acronyms. (In case you’re wondering – this convention is used to follow the Qt library conventions).
  • Consistent use of terms. The API previously used a mix of “CRS” and “SRS” for similar purposes – it now consistently uses “CRS” for a coordinate reference system.
  • Removal of abbreviations. Lots of abbreviated words have been removed from the names, eg “destCrs” has become “destinationCrs”. The API wasn’t consistently using the same abbreviations (ie “dest”/”dst”/”destination”), so it was decided to remove all use of abbreviated words and replace them with the full word. This helps keep things predictable, and is also a bit friendlier for non-native English speakers.

The naming changes all need to be addressed to make existing scripts and plugins compatible with QGIS 3.0. It’s potentially quite a lot of work for plugin developers, but in the long term it will make the API easier to use.

Changes to return and argument types

There’s also been lots of changes relating to the types of objects returned by functions, or the types of objects used as function arguments. Most of these involve changing the c++ types from pointers to references, or from references to copies. These changes are being made to strengthen the API and avoid potential crashes. In most cases they don’t have any affect on PyQGIS code, with some exceptions:

  • Don’t pass Python “None” objects as QgsCoordinateReferenceSystems or as QgsCoordinateTransforms. In QGIS 3.0 you must pass invalid QgsCoordinateReferenceSystem objects (“QgsCoordinateReferenceSystem()”) or invalid QgsCoordinateTransform (“QgsCoordinateTransform()”) objects instead.

Transparent caching of CRS creation

The existing QgsCRSCache class has been removed. This class was used to cache the expensive results of initializing a QgsCoordinateReferenceSystem object, so that creating the same CRS could be done instantly and avoid slow databases lookups. In QGIS 3.0 this caching is now handled transparently, so there is no longer a need for the separate QgsCRSCache and it has been removed. If you were using QgsCRSCache in your PyQGIS code, it will need to be removed and replaced with the standard QgsCoordinateReferenceSystem constructors.

This change has the benefit that many existing plugins which were not explicitly using QgsCRSCache will now gain the benefits of the faster caching mechanism – potentially this could dramatically speed up existing plugin algorithms.

In summary

The QGIS developers have been busy fixing, improving and cleaning up the PyQGIS API. We recognise that these changes result in significant work for plugin and script developers, so we’re committed to providing quality documentation for how to adapt your code for these changes, and we will also investigate the use of automated tools to help ease your code transition to QGIS 3.0. We aren’t making changes lightly, but instead are carefully refining the API to make it more predictable, streamlined and stable.

If you’d like assistance with (or to outsource) the transition of your existing QGIS scripts and plugins to QGIS 3.0, just contact us at North Road to discuss. Every day we’re directly involved in the changes moving to QGIS 3.0, so we’re ideally placed to make this transition painless for you!

QGIS 3 is underway – what does it mean for your plugins and scripts?

With the imminent release of QGIS 2.16, the development attention has now shifted to the next scheduled release – QGIS 3.0! If you haven’t been following the discussion surrounding this I’m going to try and summarise what exactly 3.0 means and how it will impact any scripts or plugins you’ve developed for QGIS.

qgis_icon.svgQGIS 3.0 is the first major QGIS release since 2.0 was released way back in September 2013. Since that release so much has changed in QGIS… a quick glance over the release notes for 2.14 shows that even for this single point release there’s been hundreds of changes. Despite this, for all 2.x releases the PyQGIS API has remained stable, and a plugin or script which was developed for use in QGIS 2.0 will still work in QGIS 2.16.

Version 3.0 will introduce the first PyQGIS API break since 2013. An API break like this is required to move QGIS to newer libraries such as Qt 5 and Python 3, and allows the development team the flexibility to tackle long-standing issues and limitations which cannot be fixed using the 2.x API. Unfortunately, the side effect of this API break is that the scripts and plugins which you use in QGIS 2.x will no longer work when QGIS 3.0 is released!

Numerous API breaking changes have already started to flow into QGIS, and 2.16 isn’t even yet publicly available. The best way to track these changes is to keep an eye on the “API changes” documentation.  This document describes all the changes which are flowing in which affect PyQGIS code, and describe how best they should be addressed by plugin and script maintainers. Some changes are quite trivial and easy to update code for, others are more extreme (such as changes surrounding moving to PyQt5 and Python 3) and may require significant time to adapt for.

I’d encourage all plugin and script developers to keep watching the API break documentation, and subscribe to the developers list for additional information about required changes as they are introduced.

If you’re looking for assistance or to outsource adaptation of your plugins and scripts to QGIS 3.0 – the team at North Road are ideally placed to assist! Our team includes some of the most experienced QGIS developers who are directly involved with the development of QGIS 3.0, so you can be confident knowing that your code is in good hands. Just contact us to discuss your QGIS development requirements.

You can read more about QGIS 3.0 API changes in The road to QGIS 3.0 – part 1.

QGIS OpenLayers alternative: ArcGIS online basemap

The QGIS Ireland user group posted a method of adding the ArcGIS Online global raster basemap to QGIS to use as an alternative to the openLayers plugin:

http://ieqgis.wordpress.com/2014/08/09/adding-esris-online-world-imagery-dataset-to-qgis/


Scottish QGIS User Group Overview

Scottish QGIS User Group
Stirling, 19th March 2014

It was a long time coming but the wait was worth it. Forty two excited QGIS users and open-source GIS enthusiasts arrived at the Stirling Management Centre on a brilliantly sunny March day.  People had traveled from all over the UK to make the day happen: Charley Glynn from OS in Southampton, Pete Wells, Martin Dobias and Saber Razmjooei from Brighton as well as others from Aberdeen, Inverness, Dundee, Edinburgh, Glasgow, Cumbria and most places inbetween. The event was supported by thinkWhere, based in Stirling, and Neil Benny and Heikki Vesanto provided suitably geeky geo entertainment.

Neil Benny, QGIS EvangelistFirst up was Neil Benny (thinkWhere) who provided us with an overview of QGIS through the years to the current top features available in version 2.2 “Valmiera”. The questions on everyone’s minds were answered when he presented a series of slides outlining the benefits of using open source software, highlighting the savings and investments and the importance of investing in training. His top 10 feature comparison of proprietary v open source desktop GIS provoked much discussion.

After a coffee break I presented a short talk on how Angus Council is moving to a mixed hybrid GIS environment to take advantage of the flexibility of the open source licence and the variety of tools available to deliver results. Available here http://vimeo.com/89959143

Martin Dobias of Lutra Consulting and core QGIS developer revealed some of the performance enhancements available in the development version of QGIS. The multi-threaded multi-core rendering impressed everyone and will prove a huge draw card to seasoned GIS’ers used to single threaded applications.Martin Dobias, Core Developer

Saber Razmjooei (Lutra) filled in an open slot talking about the autoTrace plugin they developed for a group of Local Authorities across the UK. Modeled on the MapInfo trace tool it forms a key part of a lot of Council workflows and is a good example of how future plugin development work can deliver savings.

Pete Wells, plugin developerPete Wells (Lutra) delivered a very comprehensive overview of Python and QGIS and how they interact at different levels through the python bindings. There was a lot of interest in this and this was reflected in the feedback forms we collected where Python, plugins, hands-on workshops and tutorials feature high on the list of wants.

Charley Glynn (OS) unveiled some fantastic cartography using the OS vector products of MasterMap, VectorMap Local and District. He also revealed the work OS has been doing to make corporate styles available to the public and the Ordnance Survey’s bias towards open source software. Again the feedback forms revealed a desire to get hands on with QGIS to create good looking custom cartography. The next Scottish user group meeting will definitely be having some hands-on workshops.Charley Glynn, OS Cartographer IMG_20140319_152620

Heikki Vesanto (thinkWhere) bravely ventured into live demos of how to connect to just about any spatial data format available. Local files, local databases, WMS feeds, WFS feeds, text files, CSV and URLs with images and custom map templates using the Atlas generator. An excellent overview of just how flexible QGIS is when it comes to consuming data and converting data to almost every format supported by OGR and GDAL.

Thanks must go to the generosity of thinkWhere in supporting a feature filled programme of presentations and keeping us topped up with coffee. As a result the first Scottish QGIS user group meeting was a success and there is definitely a desire for more events like this.

Slides and videos of the presentations will be available here shortly.


Oh God my plugins! My precious QGIS plugins

tl;dr

The API had to change. We don't like breaking plugins. It makes us sad. We did it now to save pain in the future. You will like the new version better. Trust me.

What happened to my cheese?

When updating to QGIS 2.0 you might have noticed two things. (Apart from all the new awesome stuff!)

  1. All your settings have been set back to defaults
  2. Some of your plugins are gone, or missing in the installer.

Resetting of settings is caused by QGIS now storing its 2.0 settings in a different folder then we used for 1.8. In 1.8, all your plugins, etc, were stored in the ./qgis folder in your home directory, in 2.0 these are now stored in ./qgis2. The reason will become evident later. All user settings, the UI layout, database connections, etc, are now stored in a QGIS location. In windows this in the registry key HKEY_CURRENT_USER\Software\QGIS\QGIS2. So this explains why your settings are missing when you first load QGIS 2.0.

Why did we have to move the settings location?

Good question.

2.0 is very different from 1.8. There has been a lot of work to make this the best version we have ever made, new features, more bug fixes, a bigger dev team, and a even bigger community. Being the next major release we had to make some calls to remove some of the old code and features that were weighing us down. Features such as the old labelling engine, old symbol engine, the old vector API. Carrying old code and old out dated features into the future can sometimes really hurt a project and they have to be cut loose. Because of the massive amount of changes in 2.0 people needed to be able to run 2.0 and 1.8 on the same machine without causing any issues. If they both store settings in the same location this would have had bad results.

Why move the settings. Part 2

Moving the settings was also a result of having non backwards compatible plugins between 1.x and 2.x. If we kept both plugins in the same folder it just wouldn't work. You would install a 1.8 version of a plugin, I would update my plugin to 2.0, you then install the same plugin in 2.0, and now you 1.8 version is broken. Fun!. To avoid this we moved all QGIS 2.0 stuff into ./qgis2.

Why did my plugins break anyway. Why not just leave them be.

In 1.x we were using SIP v1. This meant the framework we used, PyQt, felt more like C++ then it did Python. If you are a Python developer then this isn't a very fun thing to deal with. In SIP v1 you need to tell PyQt, and our QGIS API, what to convert the type to. feature['mycolumn'].toInt() that is pretty gross. In V2 you can just do feature['mycolumn'] and SIP will auto convert the type for you. This makes our API feel more like Python and less like C++. There are other changes when using SIP V2 but you get the idea. Unfortunately SIP v1 and v2 do not work together so we couldn't make the code backwards compatible. This was also a forced change for us. Once we switch to Python 3 at some stage in the future V2 would be the default and we have to change then. The bright side of this change is most of the time you are removing code. Consider it a good time to go though your code, give it a bit of a polish, and remove anything that is no longer needed.

There was another major API change that needed to happen. Vector API update. In order to allow for multithreading in the future, and we all know everyone is looking forward to that, we needed to change how code can ask for features from a layer. The old method would never work in a multithreaded structure and had to go.

What can I do if I need a plugin?

Having a plugin missing from the plugin installer when you really need it can be a bit of a pain. Plugin authors are working hard to update there plugins. I approve about two a day into the plugin repository. While most plugins might be updated at some stage. There are some things that you can do if you need a plugin update to work with 2.0.

  1. Email the author of the plugin to see where they are at with the update

  2. Email the author and offer your help to update the plugin. Remember a lot of plugins are written by volunteers who just need the plugin to get their work done and wanted to share it with everyone.

  3. If the author has no intention of updating the plugin, or can't be contacted. You are free to update you local copy and offer it back to the community as the updated copy. If you are going to upload it back to the plugin repository please try to contact the author and seek permission first. I will be watching for copies of plugins to make sure we don't end up with 10 versions of the same plugin. The GPL allows for you to modify and share your updated version but it's nice to keep the original author in the loop. If the author no longer wants to maintain the plugin and you are able to then contact me and I will make you the owner of the plugin. Overall be nice not evil, we are all friends here.

  4. If you don't have, or know someone with, the skills to update the plugin. You can contact a developer to help update the plugin for you. Companies like mine, or Faunalia, or a whole range of other open source devs, can normally be contracted to update a plugin if needed.

Moving forward

We like the new API. It makes the Python side of QGIS much cleaner. There is still more work to do, it's never ending, but this is a good step. We don't like breaking plugins, but breaking a few now is better then breaking heaps as the popularity of QGIS continues to grow.

Hepler modules for development of QGIS plugins

There are two things I have coded, re-coded and re-re-coded through all my plugins: the management of the settings and the management of combo boxes associated to layers and their fields.

I have decided to write two generic python modules to solve these tasks to avoid reinventing the wheel every time.

The first one is called QGIS setting manager.
This module allows you to:

  • manage different types of settings (bool, string, color, integer, double, stringlist)
  • read and write settings in QGIS application or in the QGIS project
  • automatically set widgets from corresponding setting
  • automatically write settings from widgets of a dialog

This means that the class of a dialog dedicated to editing the plugins settings can be reduced to just a few lines.
You just have to name widgets according to settings and the module automatically detect the widgets, sets/reads the value from the widget and read/write the settings accordingly.

A setting class would look like this

from qgissettingmanager import *

class MySettings(SettingManager):
    def __init__(self):
        SettingManager.__init__(self, myPluginName)
        self.addSetting("myVariable", "bool", "global", True)

reading and write settings are performed by doing

self.settings = MySettings()
self.settings.setValue("myVariable", False)
myVariable = self.settings.value("myVariable")

and a dialog looks like this

class MyDialog(QDialog, Ui_myDialog, SettingDialog):
    def __init__(self):
        QDialog.__init__(self)
        self.setupUi(self)
        self.settings = MySettings()
        SettingDialog.__init__(self, self.settings)

You can find a complete howto here and look at the code on github.

The second module is called QGIS combo manager. This module autmatically manages combo box widgets for layers, fields of vector layers and bands of raster layers.
You can associate a field combo to a layer combo: as soon as the layer has been modified, the fields are updated to the current layer.

Associating a combo box to layers and another one to its fields would look like this:

from qgiscombomanager import *

self.layerComboManager = VectorLayerCombo(self.layerComboWidget)
self.myFieldComboManager = FieldCombo(self.myFieldComboManager, self.layerComboManager)

You can find a complete howto here and look at the code on github.

Identify feature on map

A very awaited feature is now available in the master version of QGIS: identifying features in the map!

You can define the class of the map tool as follows:

from PyQt4.QtCore import *
from PyQt4.QtGui import *
from qgis.core import *
from qgis.gui import *

class IdentifyGeometry(QgsMapToolIdentify):
 def __init__(self, canvas):
  self.canvas = canvas
  QgsMapToolIdentify.__init__(self, canvas)

 def canvasReleaseEvent(self, mouseEvent):
  results = self.identify(mouseEvent.x(),mouseEvent.y(), self.TopDownStopAtFirst, self.VectorLayer)
  if len(results) > 0:
   self.emit( SIGNAL( "geomIdentified" ), results[0].mLayer, results[0].mFeature)

This class will try to identify a feature of any visible vector layer and returning the first found feature (using layer order). Then, it will emit the signal with the layer and the feature identified.
To customize this, you can use the identify method with different arguments:

  • type of layer
  • type of identification (current layer, top-down, top-down stop at first or the QGIS setting)
  • list of layers

There is two ways of calling the identify methods:

  • identify (x, y, layerList=[], IdentifyMode mode=self.DefaultQgsSetting)
  • identify (x, y, identifyMode, layerType=AllLayers)

Identify mode and layer types are defined here. Mainly the options can be:

  • Identify mode: self.DefaultQgsSetting, self.ActiveLayer, self.TopDownStopAtFirst, self.TopDownAll
  • Layer type: self.AllLayers, self.VectorLayer, self.RasterLayer

Both methods return a structure IdentifyResult defined in the API. Mainly, it contains:

  • the feature (mFeature) if the identified layer is a vector layer
  • the corresponding layer (mLayer)
  • the derived attributes (mDerivedAttributes): the raster value for raster layers

In your plugin main code, you can define a toolbox button to enable your map tool:

class myPlugin():
 def initGui(self):
  self.mapToolAction = QAction(QIcon(":/plugins/myPlugin/icons/myIcon.png"), "My Plugin", self.iface.mainWindow())
  self.mapToolAction.setCheckable(True)
  QObject.connect(self.mapToolAction, SIGNAL("triggered()"), self.mapToolInit)
  self.iface.addToolBarIcon(self.mapToolAction)
  self.iface.addPluginToMenu("&My Plugin", self.mapToolAction)

 def mapToolInit(self):
  canvas = self.iface.mapCanvas()
  if self.mapToolAction.isChecked() is False:
   canvas.unsetMapTool(self.mapTool)
   return
  self.mapToolAction.setChecked( True )
  self.mapTool = IdentifyGeometry(canvas)
  QObject.connect(self.mapTool , SIGNAL("geomIdentified") , self.doSometing )
  canvas.setMapTool(self.mapTool)
  QObject.connect( canvas, SIGNAL( "mapToolSet(QgsMapTool *)" ), self.mapToolChanged)</em>

 def doSomething(self, layer, feature):
  # do something

If you want your plugin to be back compatible with version before 1.9, you can select the features at the clicked point using a given tolerance and using the current layer:

try:
 from qgis.gui import QgsMapToolIdentify
except:
 from qgis.gui import QgsMapTool as QgsMapToolIdentify

class IdentifyGeometry(QgsMapToolIdentify):
 def __init__(self, canvas):
  self.canvas = canvas
  QgsMapToolIdentify.__init__(self, canvas)

 def canvasReleaseEvent(self, mouseEvent):
  try:
  results = self.identify(mouseEvent.x(),mouseEvent.y(), self.TopDownStopAtFirst, self.VectorLayer)
  if len(results) > 0:
   self.emit( SIGNAL( "geomIdentified" ), results[0].mLayer, results[0].mFeature)
  except: # qgis <1.9
   point = self.toMapCoordinates( mouseEvent.pos() )
   layer = self.canvas.currentLayer()
   if layer == None:
    return
   if layer.type() != QgsMapLayer.VectorLayer:
    return
   point = self.canvas.mapRenderer().mapToLayerCoordinates(layer, point)
   pixTolerance = 6
   mapTolerance = pixTolerance * self.canvas.mapUnitsPerPixel()
   rect = QgsRectangle(point.x()-mapTolerance,point.y()-mapTolerance,point.x()+mapTolerance,point.y()+mapTolerance)
   provider = layer.dataProvider()
   provider.select([], rect, True, True)
   subset = []
   f = QgsFeature()
   while (provider.nextFeature(f)):
    subset.append(f)
    if len(subset) == 0:
     return
    if len(subset) > 1:
     idx = QgsSpatialIndex()
    for f in subset:
     idx.insertFeature(f)
     nearest = idx.nearestNeighbor( point, 1 )
     layer.featureAtId(nearest[0],f, True, False)
    self.emit( SIGNAL( "geomIdentified" ), layer, f)

Note, that this last code (for version <1.9) does not consider scale dependent visibility and can therefore return a feature which is not visible in the map!

Script Runner: A Plugin to Run Python Scripts in QGIS

Following up on my last post, Running Scripts in the Python Console, I created a plugin to simplify running scripts:

The Script Runner plugin allows you to add your scripts to a list so they are readily available. You can then run them to automate QGIS tasks and have full access to the PyQGIS API. In addition, you can view information about the classes, methods, and functions in your module as well as browse the source:

In order for your script to work with ScriptRunner it has to implement a single function as an entry point. Here is some additional information from the Help tab of the plugin:

Requirements

In order for Script Runner to execute your script you must define a run_script function that accepts a single argument. This is the standard entry point used by Script Runner. A reference to the qgis.utils.iface object will be passed to your run_script function. You don’t have to use the iface object in your script but your run_script function must accept it as an argument.

Here is an example of a simple run_script function:

    def run_script(iface):
        ldr = Loader(iface)
        ldr.load_shapefiles('/vmap0_shapefiles')

In this example, the run_script creates an instance (ldr) of a class named Loader that is defined in the same source file. It then calls a method in the Loader class named load_shapefiles to do something useful—in this case, load all the shapefiles in a specified directory.

Alternatively, you could choose not to use classes and just do everything within the run_script function, including having it call functions in the same script or others you might import. The important thing is to be sure you have defined a run_script function. If not, Script Runner won’t load your script.

Working with Scripts

To run a script, you must add it to Script Runner using the Add Script tool on the toolbar. This will add it to a list in the left panel. This list of scripts is persisted between uses of QGIS. You can remove a script using the Remove Script tool. This just removes it from the list; it does nothing to the script file on disk.

Once you have a script loaded, you can click the Script Info tool to populate the Info and Source tabs in the panel on the right. The Info tab contains the docstring from your module and then a list of the classes, methods, and functions found in the script. Having a proper docstring at the head of your script will help you determine the puprose of script.

You can view the source of the script on the Source tab. This allows you to quickly confirm that you are using the right script and it does what you think it will.

Installing the Plugin

To install the plugin:

  1. Open the Python plugin installer: Plugins->Fetch Python Plugins
  2. Check to see if you have the new Official repository in your list of plugins by clicking on Repositories tab. The URL is http://plugins.qgis.org/plugins/plugins.xml.
  3. If you have it, skip to step 5. If the new repository isn’t in the list, add it by clicking the Add button. Give it a name and insert the URL http://plugins.qgis.org/plugins/plugins.xml
  4. Click on the Plugins tab
  5. Enter scriptrunner in the Filter box
  6. Select the ScriptRunner plugin and click Install

ScriptRunner adds an entry to the Plugins menu as well as a tool on the Plugins toolbar: . Click it and you are off and running.

QGIS Plugin of the Week: OpenLayers

This week we look at the OpenLayers plugin for QGIS. This plugin allows you to add a number of image services to your map canvas:

  • Google
    • Physical
    • Streets
    • Hybrid
    • Satellite
  • OpenStreetMap
  • Yahoo
    • Street
    • Hybrid
    • Satellite
  • Bing
    • Road
    • Aerial
    • Aerial with labels

Installing the Plugin

The OpenLayers plugin is installed like all other Python plugins. From the the Plugins menu in QGIS, choose Fetch Python Plugins. This brings up the plugin installer. To find the plugin, enter openlayers in the Filter box, then select OpenLayers Plugin from the list. Once it’s highlighted, click the Install plugin button. This will download the plugin from the repository, install it, and load it into QGIS.

Using the Plugin

The OpenLayers Plugin uses your view extent to fetch the data from the service you choose. For this reason you should load at least one of your own layers first. Since each of the services are expecting a request in latitude/longitude your layer either has to be geographic or you must enable on the fly projection.

To add one of the services you have two choices; you can pick the service from the Plugins->OpenLayers plugin menu or you can use the OpenLayers Overview. The Overview opens a new panel that allows you to choose a service from a drop-down list. Click the Enable map checkbox to enable the drop-down list and preview the service you want to add. If you are happy with what you see, you can add it to the map by clicking the Add map button.

In the screenshot below we have enabled the Overview panel, added the world boundaries layer1, zoomed to an area of interest, and added the Google terrain (physical) data:

You can add as many services as you want, previewing them using the OpenLayers Overview panel.

1 You can get the world boundaries layer from the Geospatial Desktop sample data set.

QGIS Plugin of the Week: Profile

This week we take a look at a how to plot a terrain profile using the Profile plugin. The plugin can be used with any raster format supported by QGIS. You can can display profiles from up to three rasters at once, allowing you to compare the results. To illustrate, we’ll create a simple profile using a DEM of a 1:63,360 quadrangle in Alaska.

Installing the Plugin

The Profile plugin is installed like all other Python plugins. From the the Plugins menu in QGIS, choose Fetch Python Plugins. This brings up the plugin installer. To find the plugin, enter profile in the Filter box, then select Profile from the list. Once it’s highlighted, click the Install plugin button. This will download the plugin from the repository, install it, and load it into QGIS.1

Using the Plugin

Here we have loaded the DEM as well as a raster (DRG) of the topography for the same quadrangle and zoomed in a bit to an area of interest:

The yellow line has been added to indicate where we will take the profile. While the Profile plugin allows you to interactively select the profile line it doesn’t display the line on the map.

To create a profile, first make sure the raster you want to profile is selected in the layer list, then activate the plugin from the Plugins toolbar by clicking on it. The cursor becomes a cross that you use to create the profile line: click at the start point, move to the end and click again. Once you have created the profile line, the plugin pops up the result:

The profile is taken from the northeast towards the southwest, based on where we clicked first. You can change the exaggeration of the profile by using the slider on the left. The X axis shows the distance along the profile line in map units and the Y axis shows the cell values from the raster—in this case, elevation in meters.

You can save the result as a PDF or SVG using the buttons at the bottom of the dialog.

The Statistics tab displays some information for the raster layer and the profile line:

If we had additional rasters loaded, we could use the Setup tab to add them to the profile analysis. This would display the results using the colors specified for each layer and we could compare them on the Profile tab.

This is just one of several QGIS plugins that deal with profiles. You can check out the rest of them using the Python Plugin installer.

1 The Profile plugin requires the Python module for QWT5. If you don’t have this installed, a warning will be displayed during the installation process.

QGIS Plugin of the Week: Points to Paths

This week we highlight the Points to Paths plugin, a handy way to convert a series of points into line features. This plugin lets you “connect the dots” based on an common attribute and a sequence field. The attribute field determines which points should be grouped together into a line. The sequence field determines the order in which the points will connected. The output from this plugin is a shapefile.

Let’s take a look at some example data. Here we have some fictional wildlife tracking data for two moose. The tracking data is in shapefile format, but you can use any vector format supported by QGIS. The tracking data is symbolized by our two animals: Moose1 and Moose2:

The moose_tracks layer has an animal tracking id field (animal_tid) and a sequence field (id). This is all we need to convert the individual observations into a line feature that represents the animals path.

Installing the Plugin

The Points to Paths plugin is installed like all other Python plugins. From the the Plugins menu in QGIS, choose Fetch Python Plugins. This brings up the plugin installer. To find the plugin, enter points to in the Filter box, then select Points to Paths from the list. Once it’s highlighted, click the Install plugin button. This will download the plugin from the repository, install it, and load it into QGIS.

Using the Plugin

Let’s convert the tracking data to paths. To get started, choose Plugins->Points to Paths from the menu or click on the Points to Paths tool on the Plugin toolbar. This brings up the PointsToPaths dialog box where we specify the paramaters needed to create the paths. Below is the completed dialog for our moose tracks:

The first drop-down box contains a list of the vector layers loaded in QGIS—in our case we have just one: moose_tracks. For the group field drop-down we chose the field that contains the tracking identifier for each animal. This determines which points will be selected and grouped to form an individual line. The point order field drop-down specifies the field that contains the ordering for the observations. In this case, the id field is incremented with each observation and can be used to construct the paths. We don’t have a date/time field in this data, but your observations may be sequenced in this way. The Python date format field allows you to specify a format string so the plugin can determine how to sequence your points based on date/time.

The last thing we need to specify is the output shapefile. You can do this by typing in the full path to a new shapefile or by using the Browse button.

With these options set, clicking the OK button will create the new shapefile containing the paths created from our point observations. Once the shapefile is created, the plugin gives you the option to add the new shapefile directly to QGIS.

The Result

The result of our simple example are shown below:

We symbolized the individual tracks using the Categorized renderer on the Style tab of the vector properties dialog. You can see we now have a track for each animal. The attribute table created by the plugin contains the following fields:

  • group – the name of the animal taken from the field we chose as the group field
  • begin – the value of the first point order field used to create the path
  • end – the value of the last point order field used to create the path

In our data, group contains the animal name, begin the value of the lowest id field for animal, and end contains the greatest id value. In a more typical data set, begin and end would contain the start and end date/time values for the observation. Labeling the observation points with our sequence field or date/time values would allow us to determine the direction of movement.

If you have point data that represent a movement of an object, this plugin is a great way to convert it into a path that can be used for visualization, analysis, or map composition.

QGIS Plugin of the Week: Time Manager

QGIS has a lot of plugins, including over 180 that have been contributed by users. If you aren’t using plugins, you are missing out on a lot that QGIS has to offer. I’m starting what I hope to be a regular feature: Plugin of the Week. This week we’ll take a look at Time Manager.


Time Manger and QGIS Users
Time Manager lets you browse spatial data that has a temporal component. Essentially this includes anything that changes location through time. Examples include:

  • Wildlife tracking
  • Vehicles
  • Storm centers
  • QGIS users

Data Preparation

Expanding on our last post about QGIS Users Around the World, we’ll use Time Manager to watch access to the QGIS Python plugin repository through time. If you refer to the previous post, you’ll see that all the IP addresses contacting the repository were extracted from the web server log and geocoded to get the approximate geographic coordinates. To use Time Manager all we need is the time for each access to the repository.

A important part (for our purpose) of the web server log entry looks like this:

66.58.228.196 - - [23/Oct/2011:21:17:54 +0000] "GET /repo/contributed HTTP/1.1" 200 256

Time Manager supports date/time in the following formats:

  • YYYY-MM-DD HH:MM:SS
  • YYYY-MM-DD HH:MM
  • YYYY-MM-DD

As you can see, this doesn’t work with the format in the web server log.

The geocoding process created a file containing IP address, country, city (where available), latitude and longitude. This file is used to create a Python dictionary to look up locations by IP address. Using this file and a bit of Python, the web server log entries were converted into a CSV file containing:

ip,date_time,country,latitude,longitude
66.58.228.196,2011-10-23 21:13:53,United States,61.2149,-149.258
66.58.228.196,2011-10-23 21:14:22,United States,61.2149,-149.258
66.58.228.196,2011-10-23 21:17:54,United States,61.2149,-149.258
66.58.228.196,2011-10-23 21:18:04,United States,61.2149,-149.258
...

The CSV file was first converted to a shapefile using the QGIS Delimited Text plugin. Performance with Time Manager was somewhat slow using a shapefile containing 134,171 locations. The shapefile was imported into a SpatiaLite database (you can do this using ogr2ogr or the SpatiaLite GUI).

Using Time Manager

To display the progression of access to the repository (and thus users of QGIS), we first have to have the Time Manager plugin installed.[1] Once installed, we enable it using the Plugin Manger.

As you can see from the screenshot above, Time Manager installs a new panel in QGIS that sits below the map canvas. You can set a number of options by clicking Settings; the most important being the layer to use in the visualization. For the QGIS users, we use the time_manager_req layer that was created from the web server logs. With the location and date/time data in the proper format, you can click the “Play” button to start the display. For each time interval, the plugin selects the appropriate entries and displays a frame for the duration specified in the settings.

You can use the time slider to move around or move the time interval forward or backward using the buttons on each end of the slider.

A really nice feature is the ability to export to video. At present this saves a PNG file and world file for each time interval. You can then use another software package to combine these to create a video animation of the time sequence. Once solution is to use mencoder[1]:

mencoder "mf://*.PNG" -mf fps=10 -o output.avi -ovc lavc -lavcopts vcodec=mpeg4

Putting all this together gives us the following visualization of QGIS user activity from October 23 through December 19, 2011:


QGIS User Activity

You can see the “wave” of activity progress from east to west as the daylight hours come and go.

Summary

If you have spatial data with a date or time component, the Time Manager plugin provides a convenient way to visualize the temporal relationships.

[1]http://www.geofrogger.net/trac/wiki

QGIS Users Around the World

One of the difficult things to track in the open source world is the number of people who actually use your software. In the proprietary commercial world you have licenses, invoices, and so forth. In the case of QGIS, we can track the total number of downloads from qgis.org, but this doesn’t represent the total installed base. It is impossible to accurately determine the actual number of people using QGIS, but we can get an approximation of the number and where they are in the world.

The analysis was done using the log files from the QGIS contributed repository:

  • The IP address of each entry that retrieved the plugin list from the server represents one or more users—these IPs were collected into a unique list
  • Using a Python script, each IP address in the log was geocoded to get the approximate latitude and longitude of the user
  • The IP address, country, latitude, and longitude were written to a CSV file
  • The CSV file was converted to a Spatialite layer to create the map of users

The map represents 35,603 unique IP addresses of users that accessed the repository between October 23, 2011 and December 17, 2011.

The geocoding process varies in precision—some IPs are located to the city level while others only return a general location for the country.

Some assumptions and observations:

  • Most (maybe all) users make use of Python plugins and therefore access the contributed repository at some point
  • Country-level points (blue) on the map represent more than one user
  • Some points represent organizations that use a single IP for all users accessing the Internet. These points will represent more than one user
  • Some users may access the repository from more than one IP address

So how many people use QGIS? At the very minimum, 35,000. We know that the downloads of just the Windows version exceeded 100,000. Given that there are 7,183 IP addresses that are generalized to a country location, we can safely assume that the number of actual users is much higher than that.

Considering the number of points that represent an organization and those that represent a country location, I think we can safely assume that the number of QGIS users easily exceeds 100,000 worldwide.

Using the QGIS Plugin Builder

The Plugin Builder allows you to quickly create a skeleton Python plugin by generating all that boring boilerplate that every plugin requires.

Here is a short video showing how to create, compile, and install a new plugin.

For more information, see QGIS Workshop Documentation and the PyQGIS Cookbook.

  • Page 1 of 1 ( 19 posts )
  • plugins

Back to Top

Sustaining Members