Related Plugins and Tags

QGIS Planet

QGIS Add to Felt Plugin – Phase 2

We have been continuing our work with the Flagship sponsor of QGISFelt to develop their QGIS Plugin – Add to Felt  that makes it even easier to share your maps and data on the web.

What is the ‘Add to Felt’ QGIS Plugin?

The ‘Add to Felt’ QGIS Plugin is a powerful tool that empowers users to export their QGIS projects and layers directly to a Felt web map. This update introduces two fantastic features:

  1. Single Layer Sharing: You can now share a single layer from your QGIS project to a Felt map. This means you have greater control over which specific data layers to share, allowing you to tailor your map precisely to your audience’s needs.
  2. Map Selection: With the updated plugin, you can choose which map on Felt to add your layer to – a new map, or an ongoing project. This flexibility simplifies your workflow and ensures that your data ends up in the right place.

Businesses that rely on QGIS love how these new features provide a seamless way to view and share results, ultimately allowing them to move more quickly and stay in sync:

“Felt helps us keep each other updated on what we’ve done, what we’ve modeled, how things are progressing.” – ICON Engineering

Why is this Update Important?

Web maps are invaluable tools for sharing data with a wider audience, be it colleagues, clients, or the public. They provide creators with the ability to control data visibility, display options, and audience access, all within an easily shareable digital format. However, creating web maps can be an arduous and complex task.

Here’s where the ‘Add to Felt’ QGIS Plugin update comes to the rescue:

1. Streamlining the Process: Creating web maps traditionally involves website development, data hosting, and map application development—tasks that require a diverse skill set. This complexity can be a significant barrier, especially for smaller operations with limited resources or budget constraints.

2. Felt Simplifies Web Mapping: Felt makes it effortless to create web maps, and share them as easily as you would a Google Doc or Sheet. Simply drag and drop your data, customize the symbology to your liking, and share the map with a link or by inviting collaborators. No need to send large data files or answer questions about the map’s data sources.

3. Integration with QGIS: Now, the ‘Add to Felt’ QGIS Plugin bridges the gap between QGIS and Felt. It seamlessly imports your QGIS data into Felt, eliminating the need for manual data transfers and reducing the complexity of web map creation.

In essence, the ‘Add to Felt’ QGIS Plugin update simplifies the process of sharing and collaborating on web maps. It empowers users to harness the full potential of web-based mapping, making it accessible to everyone, regardless of their technical expertise. The update makes it even easier to share progress updates or model re-run outputs without creating a new map, or sharing a new map link.

So, if you’re a QGIS user looking to enhance your map-sharing capabilities and streamline your workflow, make sure to take advantage of this fantastic update. Say goodbye to the complexities of web map creation and hello to effortless, data-rich web maps with Felt and the ‘Add to Felt’ QGIS Plugin.

How to install and upgrade

  • Open QGIS on your computer. You must have version 3.22 or later installed.
  • In the plugins tab, select Manage and Install Plugins.
  • Search for the ‘Add to Felt’ plugin, select and click Install Plugin.
  • Close the Plugins dialog. The Felt plugin toolbar will appear in your toolbar for use.
  • Sign into Felt and begin sharing your maps to the web.

If you want more features in this plugin, let us know or you’re interested in exploring how a QGIS plugin can make your service easily accessible to the millions of daily QGIS users, contact us to discuss how we can help!

Soar.Earth Digital Atlas QGIS Plugin

Soar banner

Growing up, I would spend hours lost in National Geographic maps. The feeling of discovering new regions and new ways to view the world was addictive! It’s this same feeling of discovery and exploration which has made me super excited about Soar’s Digital Atlas. Soar is the brainchild of Australian, Amir Farhand, and is fuelled by the talents of staff located across the globe to build a comprehensive digital atlas of the world’s maps and images. Soar has been designed to be an easy to use, expansive collection of diverse maps from all over the Earth. A great aspect of Soar is that it has implemented Strong Community Guidelines and moderation to ensure the maps are fit for purpose.

Recently, North Road collaborated with Soar to help facilitate their digital atlas goals by creating a QGIS plugin for Soar. The Soar plugin allows QGIS users to directly:

  • Export their QGIS maps and images straight to Soar
  • Browse and load maps from the entire Soar public catalogue into their QGIS projects

There’s lots of extra tweaks we’ve added to help make the plugin user friendly, whilst offering tons of functionality that power users want. For instance, users can:

  • Filter Soar maps by their current project extent and/or by category
  • Export raw or rendered raster data directly to Soar via a Processing tool
  • Batch upload multiple maps to Soar
  • Incorporate Soar map publishing into a Processing model or Python based workflow

Soar will be presenting their new plugin at the QGIS Open Day in August so check out the details here and tune in at 2300 AEST or 1300 HR UTC. You can follow along via either YouTube or Jitsi.

Browsing Soar maps from QGIS

One of the main goals of the Soar QGIS plugin was to make it very easy to find new datasets and add them to your QGIS projects. There’s two ways users can explore the Soar catalog from QGIS:

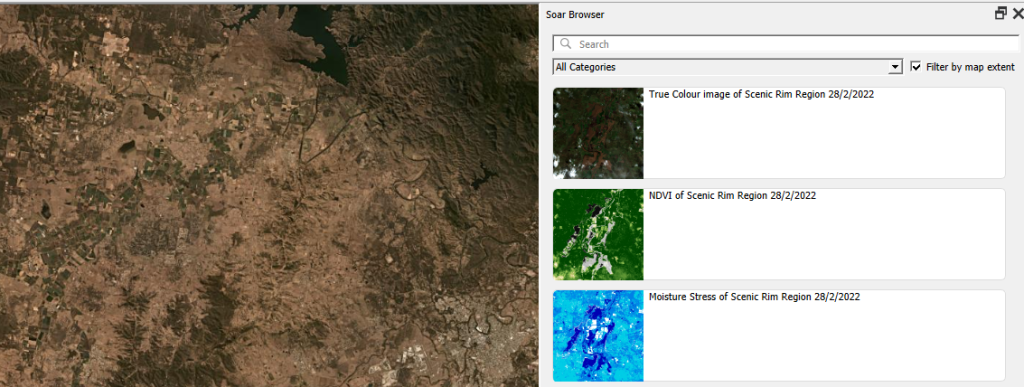
You can open the Soar Browser Panel via the Soar toolbar button  Soar browser . This opens a floating catalog browser panel which allows you to interactively search Soar’s content while working on your map.

Soar browser panel

Alternatively, you can also access the Soar catalog and maps from the standard QGIS Data Source Manager dialog. Just open the “Soar” tab and search away!

When you’ve found an interesting map, hit the “Add to Map” button and the map will be added as a new layer into your current project. After the layer is loaded you can freely modify the layer’s style (such as the opacity, colorization, contrast etc) just like any other raster dataset using the standard QGIS Layer Style controls.

Sharing your maps

Before you can share your maps on Soar, you’ll need to first sign up for a free Soar account.

We’ve designed the Soar plugin with two specific use cases in mind for sharing maps. The first use case is when you want to share an entire map (i.e. QGIS project) to Soar. This will publish all the visible content from your map onto Soar, including all the custom styling, labeling, decorations and other content you’ve carefully designed. To do this, just select the Project menu, Import/Export -> Export map to Soar option.

Upload via Project to Soar

You’ll have a chance to enter all the metadata and descriptive text explaining your map, and then the map will be rendered and uploaded directly to Soar.

Soar Metadata

All content on the Soar atlas is moderated, so your shared maps get added to the moderation queue ready for review by the Soar team. (You’ll be notified as soon as the review is complete and your map is publicly available).

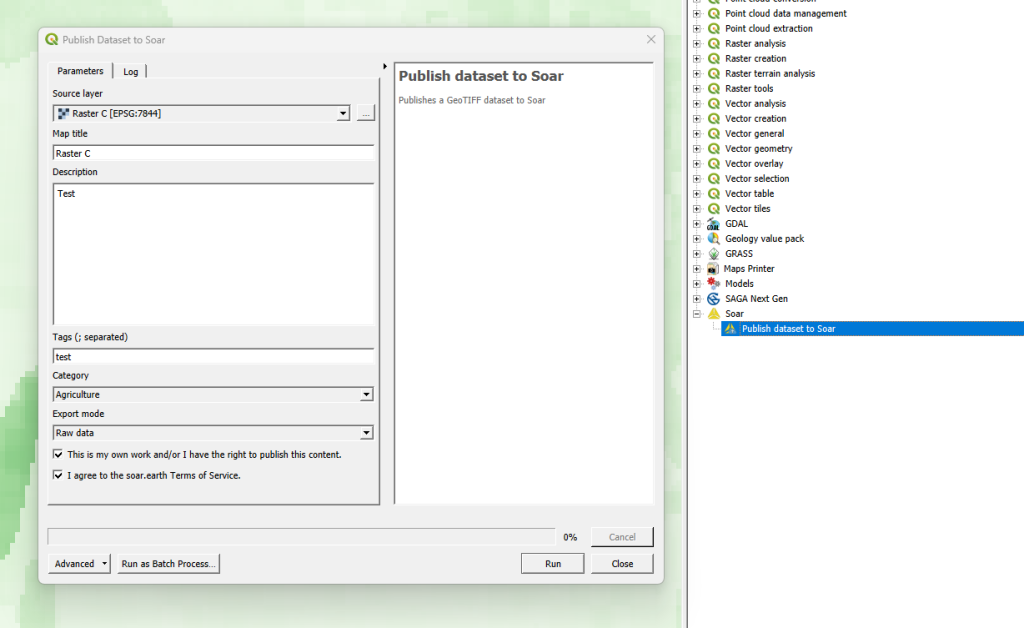
Alternatively, you might have a specific raster layer which you want to publish on Soar. For instance, you’ve completed some flood modelling or vegetation analysis and want to share the outcome widely. To do this, you can use the “Publish dataset to Soar” tool available from the QGIS Processing toolbox:

Upload product to Soar via processing tools

Just pick the raster layer you want to upload, enter the metadata information, and let the plugin do the rest! Since this tool is made available through QGIS’ Processing framework, it also allows you to run it as a batch process (eg uploading a whole folder of raster data to Soar), or as a step in your QGIS Graphical Models!

Some helpful hints

All maps uploaded to Soar require the following information:

  • Map Title
  • Description
  • Tags
  • Categories
  • Permission to publish

This helps other users to find your maps with ease, and also gives the Soar moderation team the information required for their review process.

We’ve a few other tips to keep in mind to successfully share your maps on Soar:

  • The Soar catalog currently works with raster image formats including GeoTIFF / ECW / JP2 / JPEG / PNG
  • All data uploaded to Soar must be in the WGS84 Pseudo-Mercator (EPSG: 3857) projection
  • Check the size of your data before sharing it, as a large size dataset may take a long time to upload

So there you have it! So simple to start building up your contribution to Soar’s Digital Atlas. Those who might find this useful to upload maps include:

  • Community groups
  • Hobbyists
  • Building a cartographic/geospatial portfolio
  • Education/research
  • Contributing to world events (some of the biggest news agencies already use this service i.e. BBC)

You can find out more about the QGIS Soar plugin at the QGIS Open Day on August 23rd, 2023 at 2300 HR AEST or 1300 HR UTC. Check here for more information or to watch back after.

If you’re interested in exploring how a QGIS plugin can make your service easily accessible to the millions of daily QGIS users, contact us to discuss how we can help!

Creating circular insets and other fun QGIS layout tricks

Thanks to the recent popularity of the “30 Day Map Challenge“, the month of November has become synonymous with beautiful maps and cartography. During this November we’ll be sharing a bunch of tips and tricks which utilise some advanced QGIS functionality to help create beautiful maps.

One technique which can dramatically improve the appearance of maps is to swap out rectangular inset maps for more organic shapes, such as circles or ovals.

Back in 2020, we had the opportunity to add support for directly creating circular insets in QGIS Print Layouts (thanks to sponsorship from the City of Canning, Australia!). While this functionality makes it easy to create non-rectangular inset maps the steps, many QGIS users may not be aware that this is possible, so we wanted to highlight this functionality for our first 30 Day Map Challenge post.

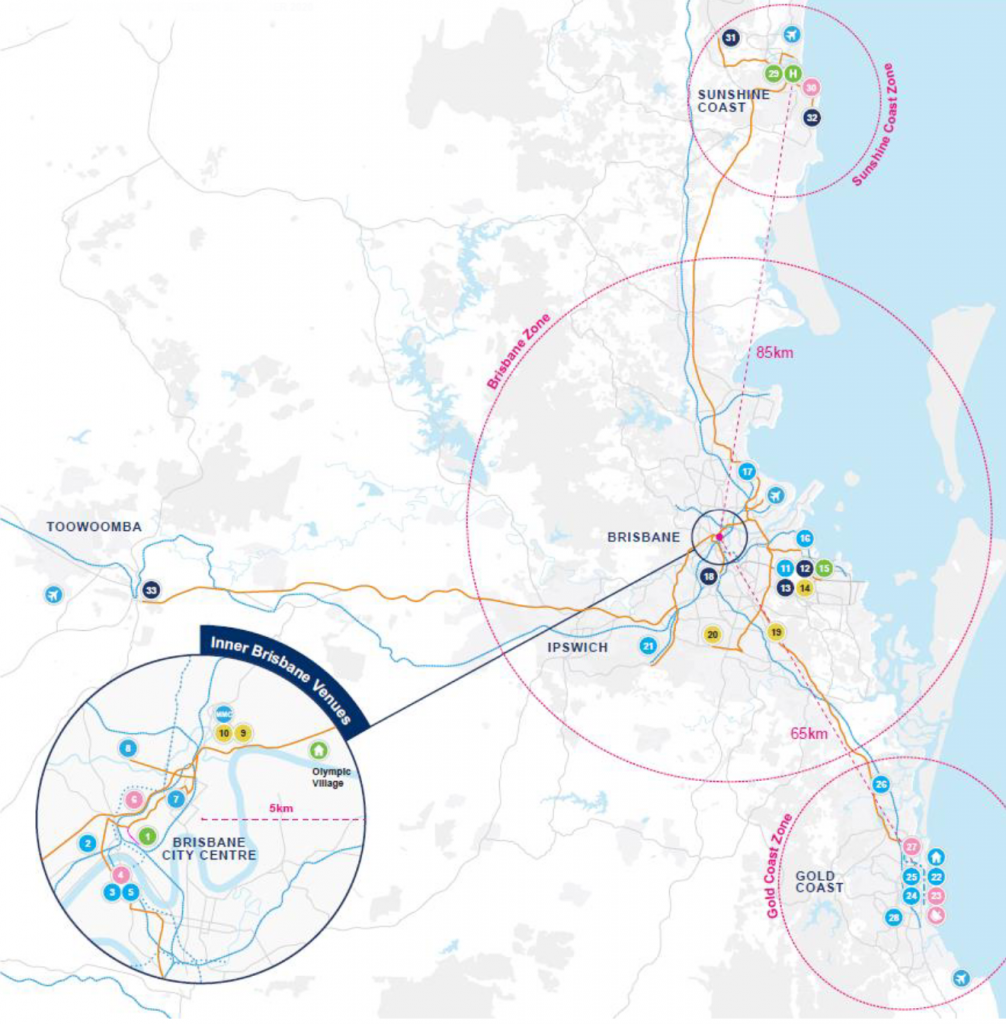
Let’s kick things off with an example map. We’ve shown below an extract from the 2032 Brisbane Olympic Bid that some of the North Road team helped create (on behalf of SMEC for EKS). This map is designed to highlight potential venues around South East Queensland and the travel options between these regions:

Venue Masterplan Brisbane 2032 Olympics
Venue Masterplan for 2032 Olympic Games, IOC Feasibility Assessment – Olympic Games, Brisbane February 2021

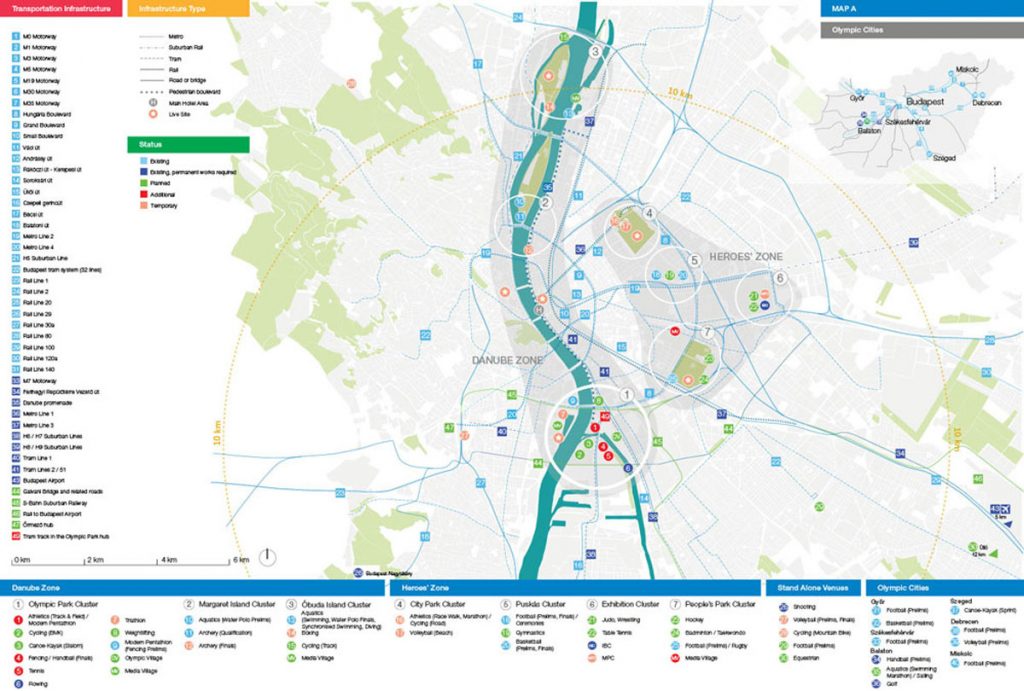
Circles featured heavily in previous Olympic bid maps (such as Budapest) where we took our inspiration from. This may, or may not, play a part in using the language of the target map audience – think Olympic rings!

Budapest Olympics 2024 MasterplanBudapest Olympics 2024 Masterplan


Step by Step Guide to Creating a Circle Inset

Firstly, prepare a print layout with both a main map and an inset map. Make sure that your inset map is large enough to cover your circular shape:

From the Print Layout toolbar, click on the Add Shape button and then select Add Ellipse:

Draw the ellipse over the middle of your inset map (hint: holding down Shift while drawing the ellipse will force it to a circular shape!). If you didn’t manage to create an exact circle then you can manually specify the width and height in the shape item’s properties. For this one, we went with a 50mm x 50mm circle:

Next, select the Inset Map item and in its Item Properties click on the Clipping Settings button:

In the Clipping Settings, scroll down to the second section and tick the Clip to Item box and select your Ellipse item from the list. (If you have labels shown in your inset map you may also want to check the “force labels inside clipping shape” option to force these labels inside the circle. If you don’t check this option then labels will be allowed to overflow outside of the circle shape.)

Your inset map will now be bound to the ellipse!

Here’s a bit more magic you could add to this map – in the Main Map’s properties, click on Overviews and set create one for the Inset map – it will nicely show the visible circular area and not the rectangle!

Bonus Points: Circular Title Text!

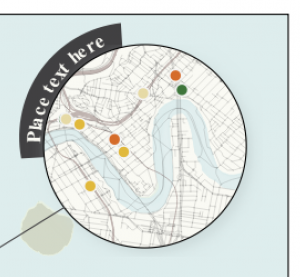
For advanced users, we’ve another fun tip…and when we say fun, we mean ‘let’s play with radians’! Here we’re going to create some title text and a wedged background which curves around the outside of our circular inset. This takes some fiddly playing around, but the end result can be visually striking! Here we’re going to push the QGIS print layout “HTML” item to create some advanced graphics, so some HTML and CSS coding experience is advantageous. (An alternative approach would be to use a vector illustration application like Inkscape, and add your title and circular background as an SVG item in the print layout).

We’ll start by creating some curved circular text:

First, add a “HTML frame” to your print layout:

HTML frames allow placement of dynamic content in your layouts, which can use HTML, CSS and JavaScript to create graphical components.

In the HTML item’s “source” box, add the following code:

<svg height="300" width="350">
        <defs>
            <clipPath id="circleView">
                <circle id="curve" cx="183" cy="156" r="25" fill="transparent" />
            </clipPath>
        </defs>
        <path id="forText" d="M 28,150, C 25,50, 180,-32,290,130" stroke="" fill="none"/>
            <text x="0" y="35" width="100">
                <textpath xlink:href="#forText">
                    <tspan font-weight="bold" fill="black">Place text here</tspan>
                </textpath>
            </text>
             <style>
    <![CDATA[
      text{
        dominant-baseline: hanging;
        font: 20px Arial;
      }
    ]]>
  </style>
</svg>

Now, let’s add in a background to bring more focus onto the title!

To add in the background, create another HTML item. We’ll again create the arc shape using an SVG element, so add the following code into the item’s source box:

<svg width="750" height="750" xmlns="http://www.w3.org/2000/svg">
  <path d="M 90 70
           A 56 56, 0, 0, 0, 133 140
           L 150 90 Z" fill="#414042" transform=" scale(2.1) rotate(68 150 150) " />/>
</svg>

(You can read more about SVG  curves and arcs paths over at MDN)

So there we go! These two techniques can help push your QGIS map creations further and make it easier to create beautiful cartography directly in QGIS itself. If you found these tips useful, keep an eye on this blog as we post more tips and tricks over the month of November. And don’t forget to follow the 30 day Map Challenge for a smorgasbord of absolutely stunning maps.

Mixed Format Labels in QGIS — coming soon!

For the QGIS 3.28 release North Road had the exciting opportunity to add some much desired new functionality to QGIS: the ability to mix font formatting and styles within a single map label! This enhancement was funded by the Swiss QGIS User Group, and offers a whole range of new cartographic possibilities for all QGIS users. Read on for more details on how this can impact your mapping…

QGIS has long supported the ability to combine different values inside a label for a feature, via the use of custom QGIS expressions. For example, the map below labels features from a rail station layer with the expression

"NAME" || '\n' || "PATRONAGE"

This expression concatenates the field values inside the “NAME” field with their “PATRONAGE” values, using a new line character to separate the two values. The end result looks something like this:

While custom expressions are extremely flexible and offer an almost unlimited range of possibilities to tweak label content, the limitation has been that all of this label text will always be displayed using a single font, font size, and font style. For example, there was no capacity to show the station names in a larger, bold font, and the patronage values in a smaller size.

That’s all changing thanks to the funding from the QGIS Swiss User Group! Now, in QGIS 3.28, users can combine label text with HTML formatting tags in order to customise exactly how each individual word or character in the label is drawn. Let’s revisit the map shown above and flex these new cartographic muscles…

The first thing we need to do is enable the HTML formatting tags for our labels by checking the “Allow HTML formatting” option in the text properties:

With this option enabled, we can now use a range of HTML and CSS tags to format individual parts of our label. For instance, “<b>bold text</b>” will show the text between the <b> and </b> tags in a bold font. By revising our previous labelling expression we can now get the station names to render in a bold font. Here’s the revised expression:

'<b>' || "NAME" || '</b><p>' || "PATRONAGE"

There’s one other important change we’ve made in the above expression. When using HTML formatting for labels, we need to replace the ‘\n’ newline character with the HTML new paragraph tag “<p>”. Otherwise, our expression is very similar to the previous one, with the exception that we’re wrapping the “NAME” field in <b>…</b> tags.

Here’s how it looks:

That’s already a dramatic improvement in the readability of the map! Let’s try refining it further by dropping down the font size of the patronage values. We can do that by inserting some CSS into the label string, specifically the “font-size” property. Here’s our new expression:

'<b>' || "NAME" || '</b><p><span style="font-size: 10pt">' || "PATRONAGE" || '</span>'

It’s so beautiful now! (Go on, scroll back up to our original map, we dare you to compare!).

So which HTML/CSS formatting options are supported? For QGIS 3.28, these options are:

  • Font family, via the CSS font-family tag. E.g. <span style=”font-family: Comic Sans MS”>…</span>
  • Font size, via the CSS font-size tag. E.g. <span style=”font-size: 30pt”>…</span>
  • Font weights, via the HTML <b> tag or CSS font-weight tag
  • Italic, via the HTML <i> tag or CSS “font-style: italic”
  • Font color, via the CSS “color: #rrggbb” tag
  • Underline, via the HTML <u> tag or CSS “text-decoration: underline” tag
  • Strikethrough, via the HTML <s> tag or CSS “text-decoration: line-through” tag
  • Overline, via the CSS “text-decoration: overline” tag

Oh, one last thing we nearly forgot to mention: all these wonderful styling options also apply perfectly to curved label text!

Our thanks go out to the members of the Swiss QGIS User Group for funding this feature! It’s an exciting addition to QGIS and can offer new ways to dramatically improve your mapping creations.

Got any QGIS needs you’d like to discuss? Or want to see additional formatting options added in a future QGIS release? Just contact our friendly team to discuss your needs — we’d love to assist!

Forget label buffers! Better maps with selective label masks in QGIS

Cartographers use all kind of tricks to make their maps look deceptively simple. Yet, anyone who has ever tried to reproduce a cartographer’s design using only automatic GIS styling and labeling knows that the devil is in the details.

This post was motivated by Mika Hall’s retro map style.

There are a lot of things going on in this design but I want to draw your attention to the labels – and particularly their background:

Detail of Mike’s map (c) Mike Hall. You can see that the rail lines stop right before they would touch the A in Valencia (or any other letters in the surrounding labels).

This kind of effect cannot be achieved by good old label buffers because no matter which color we choose for the buffer, there will always be cases when the chosen color is not ideal, for example, when some labels are on land and some over water:

Ordinary label buffers are not always ideal.

Label masks to the rescue!

Selective label masks enable more advanced designs.

Here’s how it’s done:

Selective masking has actually been around since QGIS 3.12. There are two things we need to take care of when setting up label masks:

1. First we need to enable masks in the label settings for all labels we want to mask (for example the city labels). The mask tab is conveniently located right next to the label buffer tab:

2. Then we can go to the layers we want to apply the masks to (for example the railroads layer). Here we can configure which symbol layers should be affected by which mask:

Note: The order of steps is important here since the “Mask sources” list will be empty as long as we don’t have any label masks enabled and there is currently no help text explaining this fact.

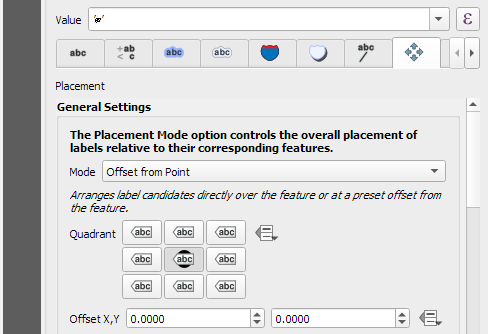
I’m also using label masks to keep the inside of the large city markers (the ones with a star inside a circle) clear of visual clutter. In short, I’m putting a circle-shaped character, such as ◍, over the city location:

In the text tab, we can specify our one-character label and – later on – set the label opacity to zero.
To ensure that the label stays in place, pick the center placement in “Offset from Point” mode.

Once we are happy with the size and placement of this label, we can then reduce the label’s opacity to 0, enable masks, and configure the railroads layer to use this mask.

As a general rule of thumb, it makes sense to apply the masks to dark background features such as the railways, rivers, and lake outlines in our map design:

Resulting map with label masks applied to multiple labels including city and marine area labels masking out railway lines and ferry connections as well as rivers and lake outlines.

If you have never used label masks before, I strongly encourage you to give them a try next time you work on a map for public consumption because they provide this little extra touch that is often missing from GIS maps.

Happy QGISing! Make maps not war.

Dynamic Infographic Map Tutorial

This is a guest post by Mickael HOARAU @Oneil974

As an update of the tutorial from previous years, I created a tutorial showing how to make a simple and dynamic color map with charts in QGIS.

In this tutorial you can see some of interesting features of QGIS and its community plugins. Here you’ll see variables, expressions, filters, QuickOSM and DataPlotly plugins and much more. You just need to use QGIS 3.24 Tisler version.

Here is the tutorial.

Snowy day map style now available on the QGIS hub

Today’s post is a follow-up and summary of my mapping efforts this December. It all started with a proof of concept that it is possible to create a nice looking snowfall effect using only labeling:

After a few more iterations, I even included the snowflake style in the first ever QGIS Map Design DLC: a free extra map recipe that shows how to create a map series of Antarctic expeditions. For more details (including project download links), check out my guest post on the Locate Press blog:

If you want to just use the snowflake style in your own projects, the easiest way is to grab the “Snowy Day” project from the QGIS hub (while the GeoPackage is waiting for approval on the official site, you can get it from my Dropbox):

The project is self-contained within the downloaded GeoPackage. One of the most convenient ways to open projects from GeoPackages is through the browser panel:

From here, you can copy-paste the layer style to any other polygon layer.

To change the snowflake color, go to the project properties and edit the “flake_color” variable.

Happy new year!

Introducing Annotation Layers in QGIS 3.22!

The QGIS 3.22 release is just around the corner, and we’d love to introduce you to one of the exciting changes included in this version. Just like all QGIS major releases, 3.22 brings a whole swag of improvements designed to enhance and simplify your mapping needs. In this post we’ll be highlighting one of these improvements — “Annotation Layers”. Before we dive further in, we need to extend our heartfelt thanks to the Swiss QGIS User Group who provided the funding required for this work. The Swiss User Group has invested heavily in cartographic enhancements to QGIS over many years, and it’s great to see this tradition continue for the 3.22 release!

So… let’s dive into Annotation Layers in QGIS 3.22, and what this new functionality allows you to do! Before we can get started, we’ll need to enable the new “Annotations” toolbar (it’s hidden by default). You can do this through the “View” – “Toolbars” menu by checking the “Annotations Toolbar” option. This will show a new toolbar, full of useful actions for creating and working with annotation layers:

The new Annotations toolbar

Annotation layers can contain a whole mix of different annotation types. In QGIS 3.22 this includes markers, lines, polygons and text. (We anticipate this list will grow steadily in future QGIS releases!)

Annotation item types


Creating an annotation is as easy is picking the desired item type (marker, line, polygon or text), and then drawing directly onto your map:

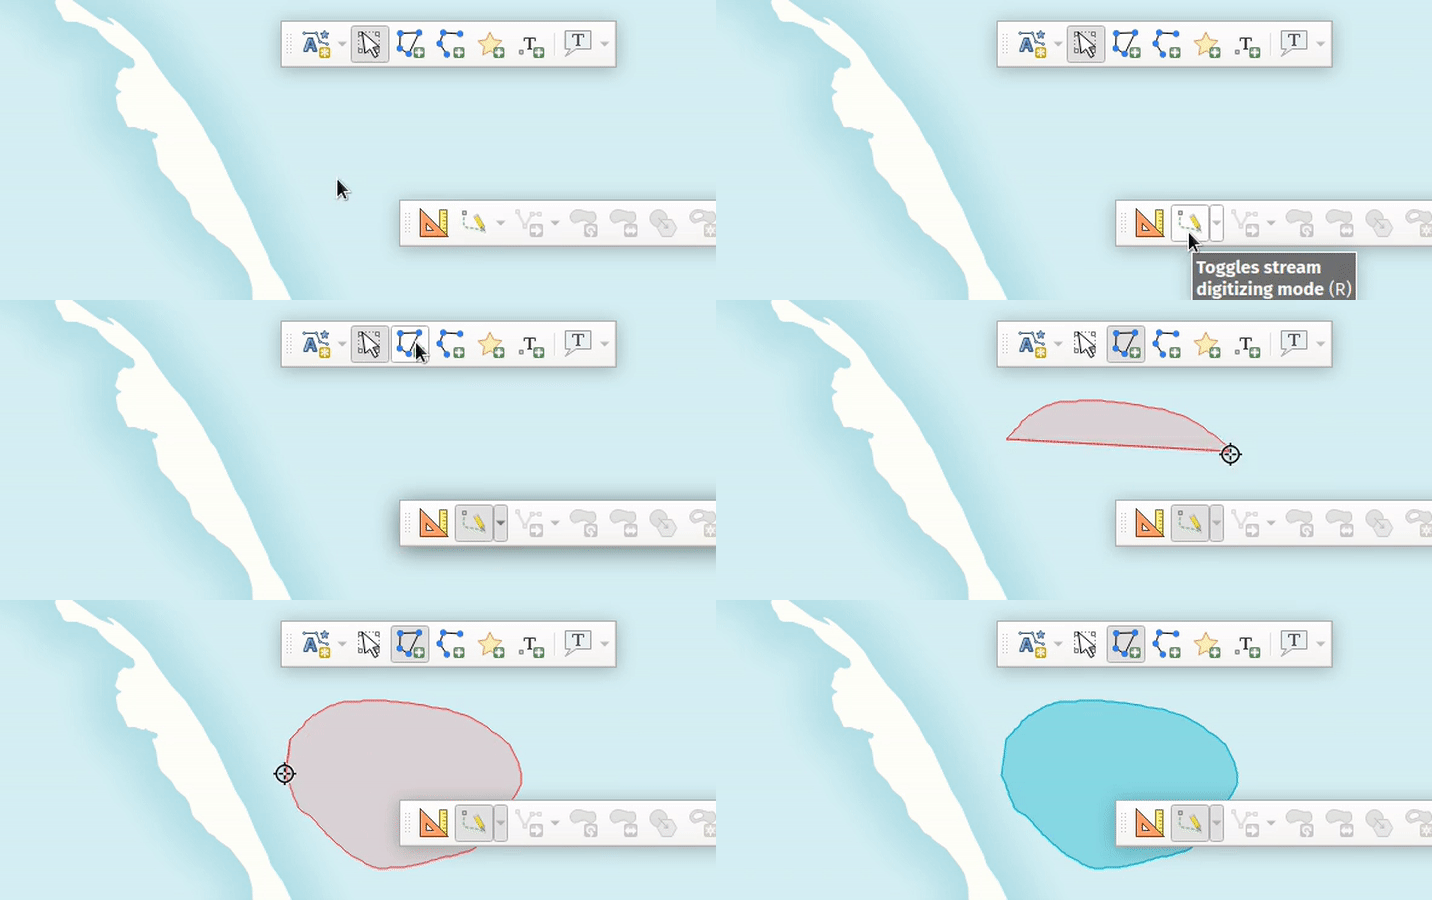
All the usual QGIS shortcuts for creating features apply when creating annotation items. A line or polygon annotation is drawn by left-clicking once for each vertex, with a final right mouse click to complete the shape. Snapping can be enabled while you draw, you can use the “Advanced Digitizing Tools” to precisely place vertices, and even switch the drawing tools to the streaming mode for completely free-form shapes!

Creating a polygon annotation using stream digitizing

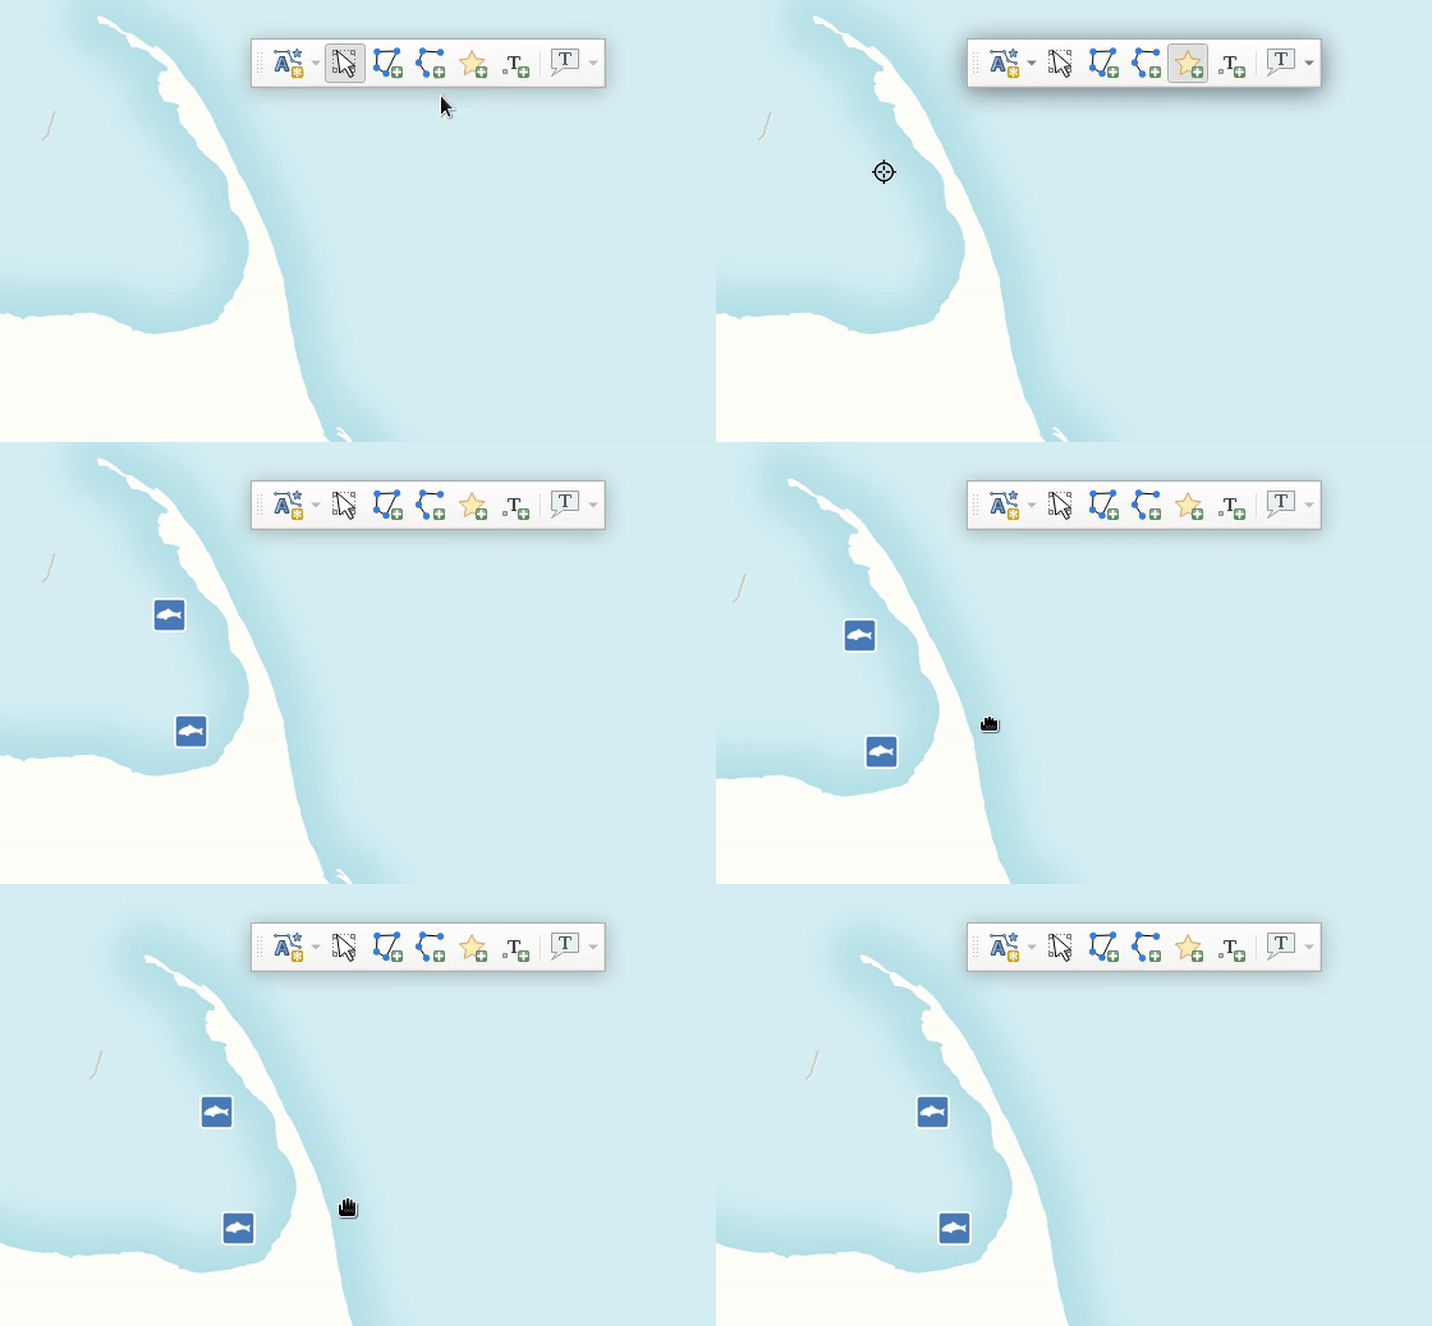
While annotations are created in this free-form way, every annotation item is still completely geo-referenced and tied to a particular geographic location. Moving your map, changing the scale or changing projection won’t cause your annotations to jump around the map. Rather, they’ll be locked in place to the location you’ve drawn them:

Annotations are tied to a geographic location

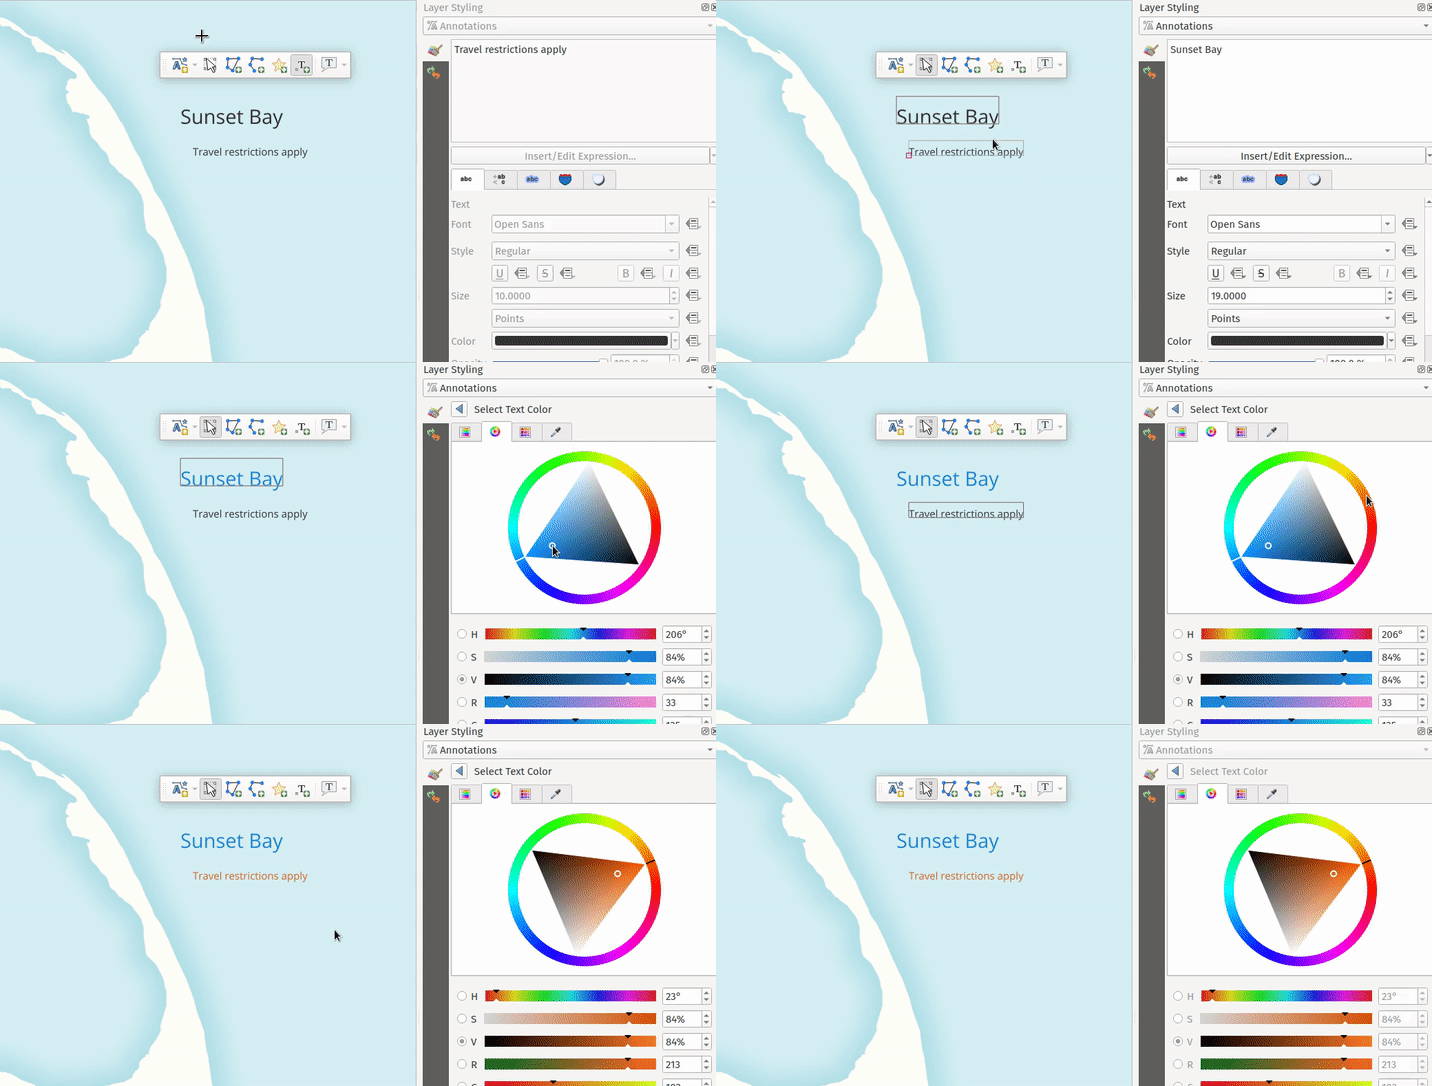
Unlike features in a traditional vector layer, it’s easy to interactively style annotation items on an item-by-item basis. (This is what makes them a great tool to help quickly create beautiful maps!). All the item appearance properties are set through the QGIS “Layer Styling” dock, which allows you to interactively tweak an item’s appearance without any annoying dialog windows getting in your way. Annotation items support all of QGIS’ rich symbology and labelling options, including layer effects (drop shadows, inner/outer glows), blending modes (multiply, overlay, etc), opacity, and even data-driven symbol property overrides!

Modifying items

Unlike traditional vector or raster (or mesh, or point cloud!) layers, an annotation layer isn’t linked to any external dataset. They exist within a single QGIS project only, so they are perfect for project-specific markups and cartographic notes. By default, any newly created annotation item will be placed on top of all your other map content. (Formally, they are added into a “main annotation layer” which is always drawn on the very top of the map.) This main annotation layer is a special beast, and you won’t see it listed alongside all the other layers in your project. If you need to interact with it, say to change a layer-level setting like the opacity or blend mode, just select the “Main Annotation Layer Properties” option from the annotations toolbar:

Setting the main annotation layer properties


In addition to this special main annotation layer, it’s also possible to create your own secondary annotation layers. From the annotations toolbar, select the “New Annotation Layer” option and a brand new annotation layer will be added to your project. Unlike the main annotation layer, you’ll see any secondary annotation layers appear in the list of your project’s layers. Just like any other map layer, you can toggle their visibility, rename them, and even reposition them to control whether the annotations show above or below particular layers in your map!

Creating a new annotation layer

(Note that whenever you have a secondary annotation layer selected as the current layer, any newly drawn annotation items will be placed into this layer instead of the main annotation layer.)

So there we go — that’s a quick dive into annotation layers in QGIS 3.22, and some of the new cartographic capabilities they unlock for your maps! We see this as the starting point of an exciting journey, and North Road developers have many plans for further enhancement of annotation layers in future QGIS releases. (And naturally, we’ve also added full support for ArcGIS drawings to QGIS annotation layer conversion to our SLYR ESRI conversion toolkit!) If you’ve something specific you’d love to see added to annotations layers, just contact us at [email protected] to discuss sponsorship options.


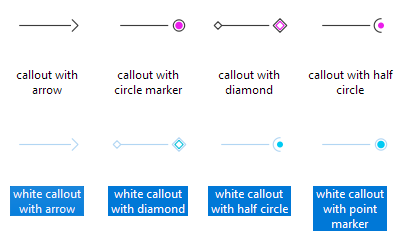
Great label callout lines

One of the new features in QGIS 3.20 is the option to trim the start and end of simple line symbols. This allows for the line rendering to trim off the first and last sections of a line at a user configured distance, as shown in the visual changelog entry

This new feature makes it much easier to create decorative label callout (or leader) lines. If you know QGIS Map Design 2, the following map may look familiar – however – the following leader lines are even more intricate, making use of the new trimming capabilities:

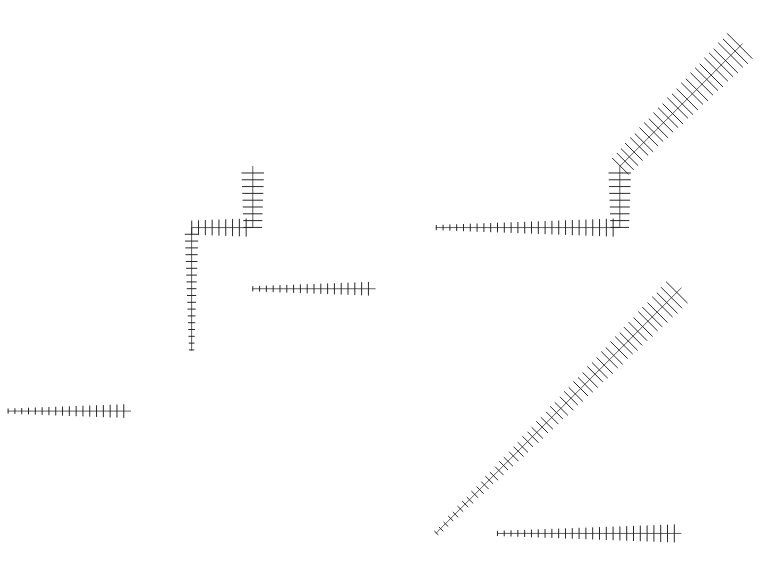
To demonstrate some of the possibilities, I’ve created a set of four black and four white leader line styles:

You can download these symbols from the QGIS style sharing platform: https://plugins.qgis.org/styles/101/ to use them in your projects. Have fun mapping!

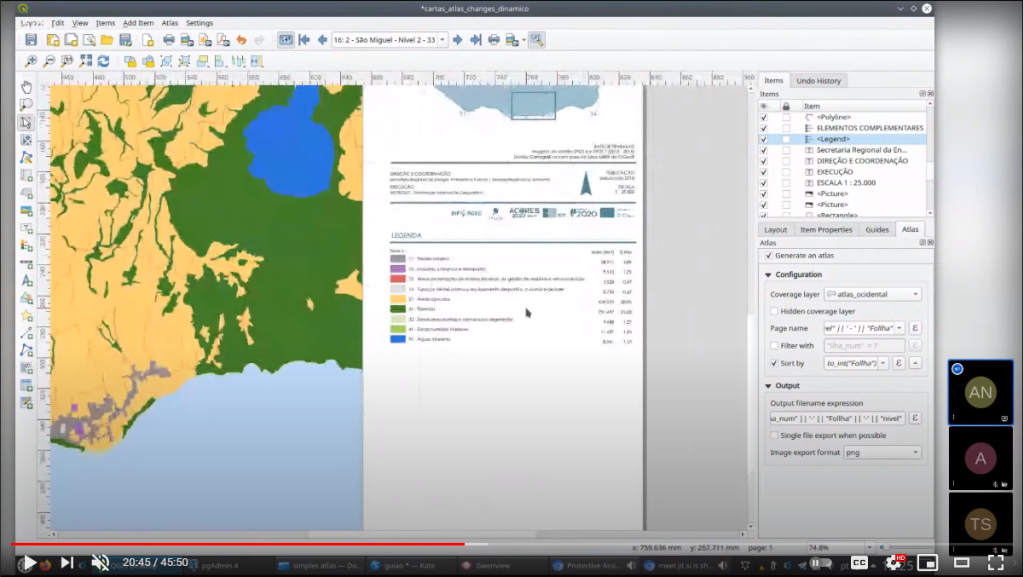
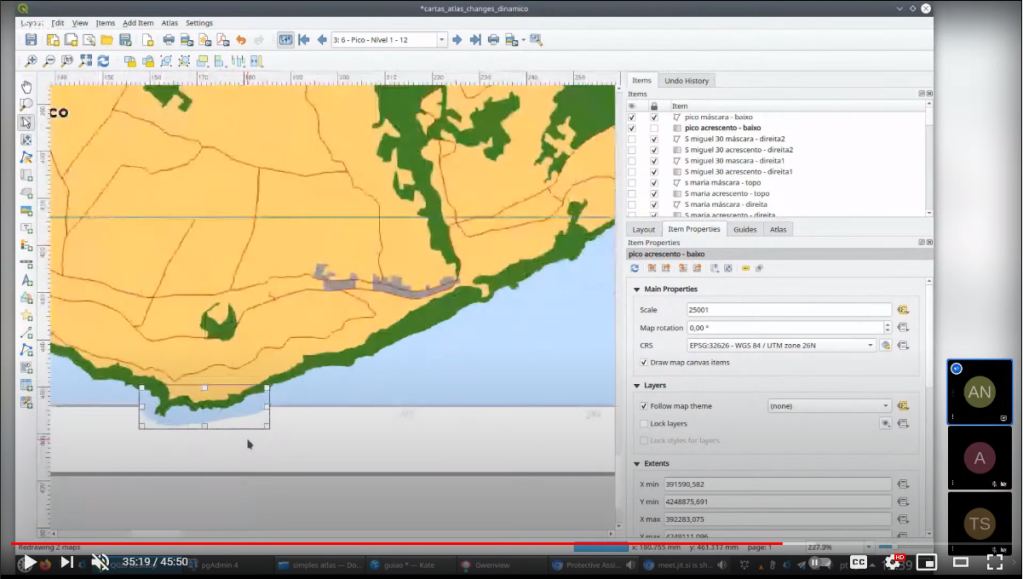
QGIS Atlas on steroids

Today’s post is a video recommendation. In the following video, Alexandre Neto demonstrates an exciting array of tips, tricks, and hacks to create an automated Atlas map series of the Azores islands.

Highlights include:

1. A legend that includes automatically updating statistics

2. A way to support different page sizes

3. A solution for small areas overshooting the map border

You’ll find the video on the QGIS Youtube channel:

This video was recorded as part of the QGIS Open Day June edition. QGIS Open Days are organized monthly on the last Friday of the month. Anyone can take part and present their work for and with QGIS. For more details, see https://github.com/qgis/QGIS/wiki#qgis-open-day

Line Label Placement: Our gift to the QGIS community!

If you’re a follower of North Road’s social media accounts, it probably comes as no surprise to hear that we love sharing regular tips and useful suggestions about working with spatial data on these channels. Recently, we realised we were close to a new milestone of 4k followers of our Twitter stream. This milestone gave us the perfect excuse to give something back to all these followers! So we ran a little promo, where we promised that if we hit 4k followers we’d implement a new feature in QGIS, as determined by a popular vote:

Given we’ve now reached the target milestone, it was our turn to deliver! So we’re proud to introduce a new feature coming in QGIS 3.16: the ability to control exactly where labels are positioned along line feature! Let’s take a look!…

In previous QGIS releases, whenever labels are enabled for a line layer these labels will automatically gravitate towards the center of the line features:

In certain situations, it’s desirable for these labels to be positioned in specific positions along these line features (e.g. at the start of lines, or at the end of lines). With this new feature gift to the community, QGIS users have to option to precisely control the label placement for these lines:


There’s new options for placing the labels at the start of lines, end of lines, or at a custom offset along the line.

This option can be super-handy when combined with Rule Based Labelling, as it allows you to have different labels at the start versus end of lines:

So there we go! Another great QGIS cartography enhancement, heading your way in QGIS 3.16, and just a little thank you back to the community for all your support of North Road.

And if you’re not following us on social media yet, it’s a great to start… because who knows when our next little giveaway will be?!


QGIS video tutorials: election maps, hydrology, and more

Mapping spatial decision patterns, such as election results, is always a hot topic. That’s why we decided to include a recipe for election maps in our QGIS Map Design books. What’s new is that this recipe is now available as a free video tutorial recorded by Oliver Burdekin:

This video is just one of many recently published video tutorials that have been created by QGIS community members.

For example, Hans van der Kwast and Kurt Menke have recorded a 7-part series on QGIS for Hydrological Applications:

and Klas Karlsson’s Youtube channel is also always worth a follow:

For the Pythonically inclined among you, there is also a new version of Python in QGIS on the Automating GIS-processes channel:


QGIS Print Layouts Graphs and Charts — Beta Out Now!

Thanks to the success of our recent QGIS Print Layouts Graphs and Charts crowdfunding campaign, staff at North Road and Faunalia have been busy updating and improving the QGIS “DataPlotly” plugin with the goal of allowing beautiful charts inside your print layouts.

We’re super-excited to announce that the beta release of this new functionality is now available! With this beta installed, you’ll see a new icon in your QGIS Print Layout designer window:

Clicking this button will allow you to draw a new plot onto your print layout, just like you would any other standard layout item (like legends, scalebars, etc). Any print layout chart can be customised by right-clicking the chart and selecting “Item Properties“. This will open a panel with settings like position, size, frame, and other standard options. All the magic happens when you click the “Setup Plot” button inside this panel:

This exposes the vast array of styling and charting options available for use. If you’re an existing user of the DataPlotly QGIS plugin, you’ll recognise that these are the same settings you have available when creating interactive plots alongside the main map canvas. Every setting is now available for use in print layouts!


To grab the beta, head over to https://github.com/ghtmtt/DataPlotly/releases/tag/v3.9-beta and download the DataPlotly.zip file. Then, inside QGIS, select the Manage and Install Plugins option from the Plugins menu. Click on the “Install from ZIP” section, and point the dialog at your downloaded DataPlotly.zip file. Click “Install Plugin“, and then restart QGIS for good measure. When QGIS restarts you should see the new chart icon inside the print layout designer.

Note that you’ll need a recent QGIS release for this to work correctly — either QGIS 3.8.3 or 3.4.12. (The print layout functionality may not be compatible with earlier releases, as we’ve had to fix several issues inside QGIS itself to get this feature working as designed!). 

We are actively seeking feedback and user testing on this beta release. If you encounter any issues, just head over to https://github.com/ghtmtt/DataPlotly/issues and let us know.

We’ll be further refining this functionality, with the goal of releasing the final non-beta version of the plugin to coincide with the upcoming QGIS 3.10 release.

Happy charting!

QGIS 3.10 Loves GeoPDF!

Recently, we’ve been working on an exciting development which is coming soon in QGIS 3.10… support for Geospatial PDF exports! This has been a long-desired feature for many QGIS users, and it was only made possible thanks to a group of financial backers (listed below). In this post, we’re going to explore these new features and how they improve your QGIS PDF outputs.

Geospatial PDFs can now be created either by exporting the main QGIS map canvas, or by creating and exporting a custom print layout. For instance, when you select the “Save Map as PDF” option from the main QGIS window, you’ll see a new group of Geospatial PDF related options:

At its most basic, Geospatial PDF is a standard extension to the PDF format which allows for vector spatial datasets to be embedded in PDF files. If the “Include vector feature information” checkbox is ticked when creating a Geospatial PDF output, then QGIS will automatically include all the geometry and attribute information from features visible within the page. So if we export a simple map to PDF, we’ll get an output file which looks just like any old regular PDF map output…

…but, we can also pull this PDF back into QGIS and treat it just like any other vector data source! In the screenshot below we’re using the Identify tool to query on of the polygons and see all the attribute information from the original source layer.

This ability adds a lot of value to PDF exports. Anyone who has ever been supplied a non-spatial PDF as a “spatial dataset” will attest to the frustrations these cause… but if you create proper Geospatial PDFs instead, then there’s no loss of the valuable underlying spatial information or feature attributes! Furthermore, if these PDFs are opened within Acrobat Reader, tools are enabled which allow users to query features interactively.

Another nice benefit which comes with Geospatial PDF output is that layers can be interactively toggled on or off in the PDF viewer. The screenshot below shows a Geospatial PDF file created from a simple QGIS map. On the left we have a list of the layers in the PDF, each of which can be turned on or off inside the PDF viewer!

The really nice thing here is that, thanks to the underlying smarts in the GDAL library which is responsible for the actual Geospatial PDF creation, the PDF renders identically to our original QGIS map. While labels turn on and off alongside their corresponding map layer, they are still correctly stacked in the exact same way as you see in the QGIS window. Furthermore, the created PDFs keep labels and vector features as vector artwork… so there’s absolutely no loss in quality when zooming in to the map! These files look GREAT!

On that same note… the sponsorship allowed us to tackle another related issue, which is that in previous QGIS versions PDF (or SVG) exports would always export every single vertex from any visible feature! Ouch! This meant that if you had a complex polygon boundary layer, you would potentially be creating a PDF with millions of vertices per feature, even though most of these would be overlapping and completely redundant at the exported map’s scale. Now, QGIS automatically simplifies vector features while exporting them (using an appropriate, effectively invisible, level of simplification). The dramatically reduces the created file sizes and speeds up opening them and navigating them in other applications (especially Inkscape). (There’s an option at export time to disable this simplification, if you have a specific reason to!).

Creating Geospatial PDFs from print layouts gives even more options. For a start, whenever a print layout is exported to Geospatial PDFs, we ensure that the created PDF correctly handles stacking of layers alongside any other print layout items you have. In the image below we see a custom print layout which includes interactive layer visibility controls. If a layer is toggled, it’s hidden only from the map item — all the other surrounding elements like the title, north arrow and scalebar remain visible:

That’s not all though! When exporting a print layout to Geospatial PDF, QGIS also hooks into any map themes you’ve setup in your project. If you select to include these themes in your output, then the result is magical! The screenshot below shows the export options for a project with a number of themes, and we’ve chosen to export these themes in the PDF:

Opening the resultant PDF shows that our layer control on the left now lists the map themes instead of individual layers. Viewers can switch between these themes, changing the visibility of layers and their styling to match the QGIS map theme from the project! Additionally, you can even expand out a theme and expose layer-by-layer visibility control. Wow! This means you could create a single PDF output file which includes an environmental, social, cadastral, transport, …. view of your map, all in the one file.

Lastly, there’s even control for fine-tuning the combination of layers which are exposed in the output PDF file and which ones should be toggled on and off together. In the screenshot below we’ve opted to group the “Aircraft” and “Roads” map layers into a single logical PDF group called “Transport”. 

The resultant PDF respects this, showing an entry in the interactive layer tree for “Transport” which toggles both the aircraft and roads layers together:

So there you go — the power of Geospatial PDF, coming your way in QGIS 3.10!

One semi-related benefit of this work is that it gave us an opportunity to rework how “layered” exports from print layouts are created. This has had a significant flow-on impact on the existing ability to create layered SVG outputs from QGIS. Previously, this was a rather fragile feature, which created SVGs with lots of issues – overlapping labels, incorrectly stacked layers, and last-but-not-least, non-descriptive layer names! Now, just like Geospatial PDF exports, the layered SVG exports correctly respect the exact look of your map, and have much more friendly, descriptive layer names:

This should significantly reduce the amount of housekeeping required when working on these layered SVG exports. 

This work was funded by:

  • Land Vorarlberg
  • Municipality of Vienna
  • Municipality of Dornbirn
  • Biodiversity Information Service for Powys and BBNP Local
  • Kanton Zug
  • Canton de Neuchâtel
  • Canton de Thurgovia

North Road are leading experts in extending the QGIS application to meet your needs. If you’d like to discuss how you can sponsor development of features or fixes which you want in QGIS, just contact us for further details!


QGIS (and SLYR!), now with Hash Lines support

Thanks to an anonymous corporate sponsor, we’ve recently had the opportunity to add a new Hashed Line symbol type for QGIS 3.8. This allows for a repeating line segment to be drawn over the length of a feature, with a line-sub symbol used to render each individual segment.

There’s tons of options available for customising the appearance and placement of line hashes. We based the feature heavily off QGIS’ existing “Marker Line” support, so you can create hashed lines placed at set intervals, on line vertices, or at the start/end/middle of lines. There’s options to offset the lines, and tweak the rotation angle of individual hashes too. Added to QGIS’ rich support for “data defined” symbol properties, this allows for a huge range of new symbol effects.

E.g. using a data defined hash length which increases over the length of a feature gives us this effect:

Or, when using a complex line sub-symbol for rendering each hash, we can get something like this:

Or even go completely “meta” and use a hashed line sub symbol for the hash line itself!

With the right combination of symbol settings and QGIS draw effects you can even emulate a calligraphic pen effect:

Or a chunky green highlighter!

This same corporate sponsor also funded a change which results in a huge improvement to the appearance of both rotated hashed lines and marker lines. Previously, when marker or hash lines were rendered, the symbol angles were determined by taking the exact line orientation at the position of the symbol. This often leads to undesirable rendering effects, where little “bumps” or corners in lines which occur at the position of the symbol cause the marker or hash line to be oriented at a very different angle to what the eye expects to see.

With this improvement, the angle is instead calculated by averaging the line over a specified distance either side of the symbol. E.g. averaging the line angle over 4mm means we take the points along the line 2mm from either side of the symbol placement, and use these instead to calculate the line angle for that symbol. This has the effect of smoothing (or removing) any tiny local deviations from the overall line direction, resulting in much nicer visual orientation of marker or hash lines.

It’s easiest to show the difference visually. Here’s a before image, showing arrow markers following a line feature. Pay specific attention to the 3rd and last arrow, which seem completely random oriented due to the little shifts in line direction:

With new smoothing logic this is much improved:

The difference is even more noticeable for hashed lines. Here’s the before:

…and the after:

Suffice to say, cartographers will definitely appreciate the result!

Lastly, we’ve taken this new hash line feature as an opportunity to implement automatic conversion of ESRI hash line symbols within our SLYR ESRI to QGIS conversion tool. Read more about SLYR here, and how you can purchase this tool for .style, .lyr and .mxd document conversion.

My favorite new recipe in QGIS Map Design 2nd ed

If you follow me on Twitter, you have probably already heard that the ebook of “QGIS Map Design 2nd Edition” has now been published and we are expecting the print version to be up for sale later this month. Gretchen Peterson and I – together with our editor Gary Sherman (yes, that Gary Sherman!) – have been working hard to provide you with tons of new and improved map design workflows and many many completely new maps. By Gretchen’s count, this edition contains 23 new maps, so it’s very hard to pick a favorite!

Like the 1st edition, we provide increasingly advanced recipes in three chapters, each focusing on either layer styling, labeling, or creating print layouts. If I had to pick a favorite, I’d have to go with “Mastering Rotated Maps”, one of the advanced recipes in the print layouts chapter. It looks deceptively simple but it combines a variety of great QGIS features and clever ideas to design a map that provides information on multiple levels of detail. Besides the name inspiring rotated map items, this design combines

  • map overviews
  • map themes
  • graduated lines and polygons
  • a rotated north arrow
  • fancy leader lines

all in one:

“QGIS Map Design 2nd Edition” provides how-to instructions, as well as data and project files for each recipe. So you can jump right into it and work with the provided materials or apply the techniques to your own data.

The ebook is available at LocatePress.

Freedom of projection in QGIS3

If you have already designed a few maps in QGIS, you are probably aware of a long-standing limitation: Print Composer maps were limited to the project’s coordinate reference system (CRS). It was not possible to have maps with different CRS in a composition.

Note how I’ve been using the past tense? 

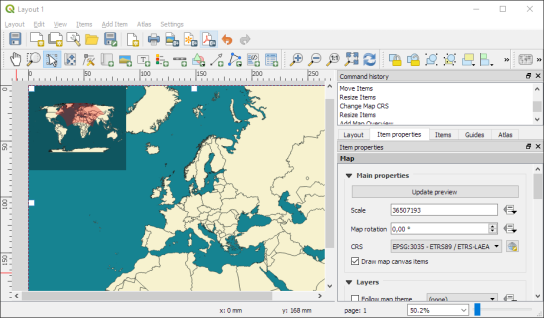
Rejoice! QGIS 3 gets rid of this limitation. Print Composer has been replaced by the new Layout dialog which – while very similar at first sight – offers numerous improvements. But today, we’ll focus on projection handling.

For example, this is a simple project using WGS84 as its project CRS:


In the Layouts dialog, each map item now has a CRS property. For example, the overview map is set to World_Robinson while the main map is set to ETRS-LAEA:

As you can see, the red overview frame in the upper left corner is curved to correctly represent the extent of the main map.

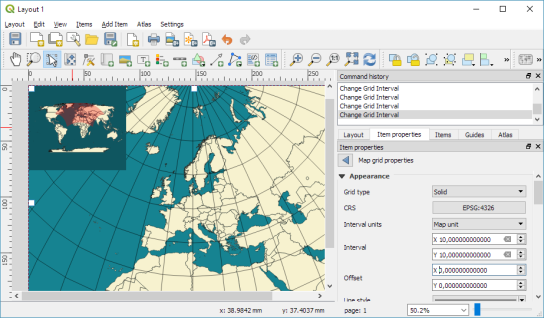
Of course, CRS control is not limited to maps. We also have full freedom to add map grids in yet another CRS:

This opens up a whole new level of map design possibilities.

Bonus fact: Another great improvement related to projections in QGIS3 is that Processing tools are now aware of layers with different CRS and will actively reproject layers. This makes it possible, for example, to intersect two layers with different CRS without any intermediate manual reprojection steps.

Happy QGIS mapping!

Drive-time Isochrones from a single Shapefile using QGIS, PostGIS, and Pgrouting

This is a guest post by Chris Kohler .

Introduction:

This guide provides step-by-step instructions to produce drive-time isochrones using a single vector shapefile. The method described here involves building a routing network using a single vector shapefile of your roads data within a Virtual Box. Furthermore, the network is built by creating start and end nodes (source and target nodes) on each road segment. We will use Postgresql, with PostGIS and Pgrouting extensions, as our database. Please consider this type of routing to be fair, regarding accuracy, as the routing algorithms are based off the nodes locations and not specific addresses. I am currently working on an improved workflow to have site address points serve as nodes to optimize results. One of the many benefits of this workflow is no financial cost to produce (outside collecting your roads data). I will provide instructions for creating, and using your virtual machine within this guide.

Steps:–Getting Virtual Box(begin)–

Intro 1. Download/Install Oracle VM(https://www.virtualbox.org/wiki/Downloads)

Intro 2. Start the download/install OSGeo-Live 11(https://live.osgeo.org/en/overview/overview.html).

Pictures used in this workflow will show 10.5, though version 11 can be applied similarly. Make sure you download the version: osgeo-live-11-amd64.iso. If you have trouble finding it, here is the direct link to the download (https://sourceforge.net/projects/osgeo-live/files/10.5/osgeo-live-10.5-amd64.iso/download)
Intro 3. Ready for virtual machine creation: We will utilize the downloaded OSGeo-Live 11 suite with a virtual machine we create to begin our workflow. The steps to create your virtual machine are listed below. Also, here are steps from an earlier workshop with additional details with setting up your virtual machine with osgeo live(http://workshop.pgrouting.org/2.2.10/en/chapters/installation.html).

1.  Create Virutal Machine: In this step we begin creating the virtual machine housing our database.

Open Oracle VM VirtualBox Manager and select “New” located at the top left of the window.

VBstep1

Then fill out name, operating system, memory, etc. to create your first VM.

vbstep1.2

2. Add IDE Controller:  The purpose of this step is to create a placeholder for the osgeo 11 suite to be implemented. In the virtual box main window, right-click your newly-created vm and open the settings.

vbstep2

In the settings window, on the left side select the storage tab.

Find “adds new storage controller button located at the bottom of the tab. Be careful of other buttons labeled “adds new storage attachment”! Select “adds new storage controller button and a drop-down menu will appear. From the top of the drop-down select “Add IDE Controller”.

vbstep2.2

vbstep2.3

You will see a new item appear in the center of the window under the “Storage Tree”.

3.  Add Optical Drive: The osgeo 11 suite will be implemented into the virtual machine via an optical drive. Highlight the new controller IDE you created and select “add optical drive”.

vbstep3

A new window will pop-up and select “Choose Disk”.

vbstep3.2

Locate your downloaded file “osgeo-live 11 amd64.iso” and click open. A new object should appear in the middle window under your new controller displaying “osgeo-live-11.0-amd64.iso”.

vbstep3.3

Finally your virtual machine is ready for use.
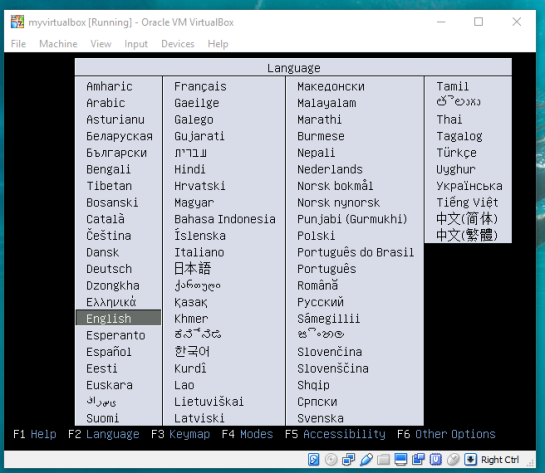
Start your new Virtual Box, then wait and follow the onscreen prompts to begin using your virtual machine.
vbstep3.4

–Getting Virtual Box(end)—

4. Creating the routing database, and both extensions (postgis, pgrouting): The database we create and both extensions we add will provide the functions capable of producing isochrones.

To begin, start by opening the command line tool (hold control+left-alt+T) then log in to postgresql by typing “psql -U user;” into the command line and then press Enter. For the purpose of clear instruction I will refer to database name in this guide as “routing”, feel free to choose your own database name. Please input the command, seen in the figure below, to create the database:

CREATE DATABASE routing;

You can use “\c routing” to connect to the database after creation.

step4

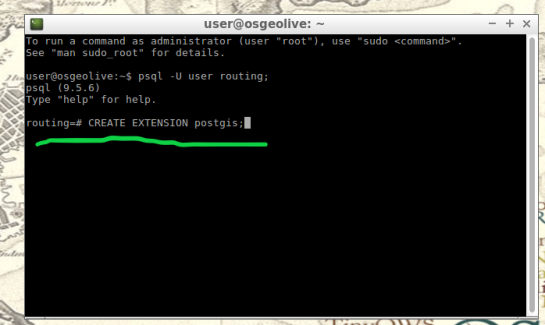
The next step after creating and connecting to your new database is to create both extensions. I find it easier to take two-birds-with-one-stone typing “psql -U user routing;” this will simultaneously log you into postgresql and your routing database.

When your logged into your database, apply the commands below to add both extensions

CREATE EXTENSION postgis;
CREATE EXTENSION pgrouting;
step4.2

step4.3

5. Load shapefile to database: In this next step, the shapefile of your roads data must be placed into your virtual machine and further into your database.

My method is using email to send myself the roads shapefile then download and copy it from within my virtual machines web browser. From the desktop of your Virtual Machine, open the folder named “Databases” and select the application “shape2pgsql”.

step5

Follow the UI of shp2pgsql to connect to your routing database you created in Step 4.

step5.2

Next, select “Add File” and find your roads shapefile (in this guide we will call our shapefile “roads_table”) you want to use for your isochrones and click Open.

step5.3

Finally, click “Import” to place your shapefile into your routing database.

6. Add source & target columns: The purpose of this step is to create columns which will serve as placeholders for our nodes data we create later.

There are multiple ways to add these columns into the roads_table. The most important part of this step is which table you choose to edit, the names of the columns you create, and the format of the columns. Take time to ensure the source & target columns are integer format. Below are the commands used in your command line for these functions.

ALTER TABLE roads_table ADD COLUMN "source" integer;
ALTER TABLE roads_table ADD COLUMN "target" integer;

step6

step6.2

7. Create topology: Next, we will use a function to attach a node to each end of every road segment in the roads_table. The function in this step will create these nodes. These newly-created nodes will be stored in the source and target columns we created earlier in step 6.

As well as creating nodes, this function will also create a new table which will contain all these nodes. The suffix “_vertices_pgr” is added to the name of your shapefile to create this new table. For example, using our guide’s shapefile name , “roads_table”, the nodes table will be named accordingly: roads_table_vertices_pgr. However, we will not use the new table created from this function (roads_table_vertices_pgr). Below is the function, and a second simplified version, to be used in the command line for populating our source and target columns, in other words creating our network topology. Note the input format, the “geom” column in my case was called “the_geom” within my shapefile:

pgr_createTopology('roads_table', 0.001, 'geom', 'id',
 'source', 'target', rows_where := 'true', clean := f)

step7

Here is a direct link for more information on this function: http://docs.pgrouting.org/2.3/en/src/topology/doc/pgr_createTopology.html#pgr-create-topology

Below is an example(simplified) function for my roads shapefile:

SELECT pgr_createTopology('roads_table', 0.001, 'the_geom', 'id')

8. Create a second nodes table: A second nodes table will be created for later use. This second node table will contain the node data generated from pgr_createtopology function and be named “node”. Below is the command function for this process. Fill in your appropriate source and target fields following the manner seen in the command below, as well as your shapefile name.

To begin, find the folder on the Virtual Machines desktop named “Databases” and open the program “pgAdmin lll” located within.

step8

Connect to your routing database in pgAdmin window. Then highlight your routing database, and find “SQL” tool at the top of the pgAdmin window. The tool resembles a small magnifying glass.
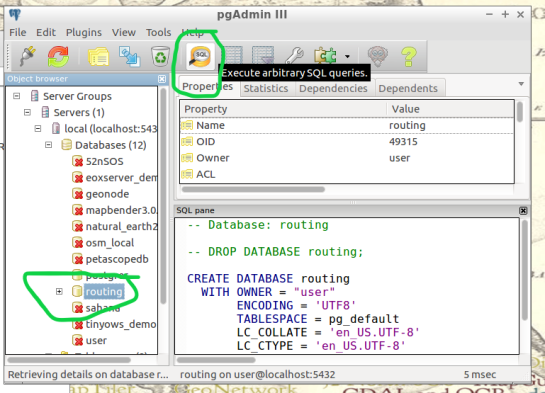
step8.2

We input the below function into the SQL window of pgAdmin. Feel free to refer to this link for further information: (https://anitagraser.com/2011/02/07/a-beginners-guide-to-pgrouting/)

CREATE TABLE node AS
   SELECT row_number() OVER (ORDER BY foo.p)::integer AS id,
          foo.p AS the_geom
   FROM (     
      SELECT DISTINCT roads_table.source AS p FROM roads_table
      UNION
      SELECT DISTINCT roads_table.target AS p FROM roads_table
   ) foo
   GROUP BY foo.p;

step8.3

  1.  Create a routable network: After creating the second node table from step 8,  we will combine this node table(node) with our shapefile(roads_table) into one, new, table(network) that will be used as the routing network. This table will be called “network” and will be capable of processing routing queries.  Please input this command and execute in SQL pgAdmin tool as we did in step 8. Here is a reference for more information:(https://anitagraser.com/2011/02/07/a-beginners-guide-to-pgrouting/)   

step8.2


CREATE TABLE network AS
   SELECT a.*, b.id as start_id, c.id as end_id
   FROM roads_table AS a
      JOIN node AS b ON a.source = b.the_geom
      JOIN node AS c ON a.target = c.the_geom;
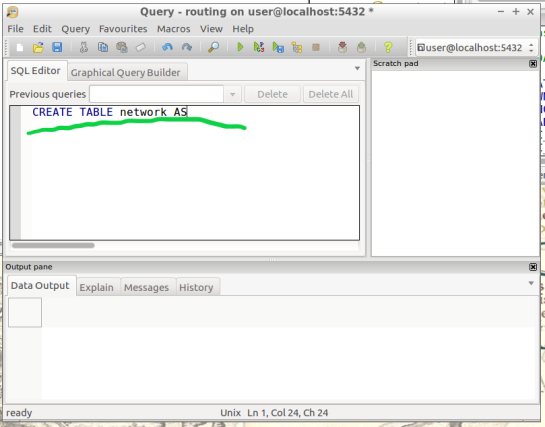
step9.2

10. Create a “noded” view of the network:  This new view will later be used to calculate the visual isochrones in later steps. Input this command and execute in SQL pgAdmin tool.

CREATE OR REPLACE VIEW network_nodes AS 
SELECT foo.id,
 st_centroid(st_collect(foo.pt)) AS geom 
FROM ( 
  SELECT network.source AS id,
         st_geometryn (st_multi(network.geom),1) AS pt 
  FROM network
  UNION 
  SELECT network.target AS id, 
         st_boundary(st_multi(network.geom)) AS pt 
  FROM network) foo 
GROUP BY foo.id;

step10

11.​ Add column for speed:​ This step may, or may not, apply if your original shapefile contained a field of values for road speeds.

In reality a network of roads will typically contain multiple speed limits. The shapefile you choose may have a speed field, otherwise the discrimination for the following steps will not allow varying speeds to be applied to your routing network respectfully.

If values of speed exists in your shapefile we will implement these values into a new field, “traveltime“, that will show rate of travel for every road segment in our network based off their geometry. Firstly, we will need to create a column to store individual traveling speeds. The name of our column will be “traveltime” using the format: ​double precision.​ Input this command and execute in the command line tool as seen below.

ALTER TABLE network ADD COLUMN traveltime double precision;
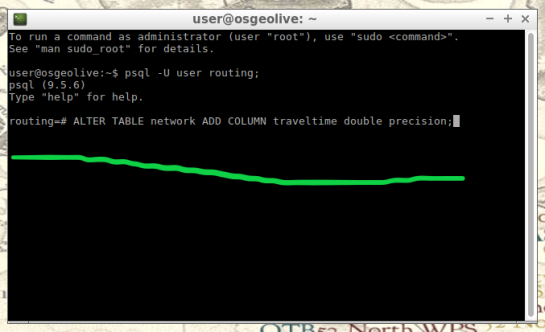
step11

Next, we will populate the new column “traveltime” by calculating traveling speeds using an equation. This equation will take each road segments geometry(shape_leng) and divide by the rate of travel(either mph or kph). The sample command I’m using below utilizes mph as the rate while our geometry(shape_leng) units for my roads_table is in feet​. If you are using either mph or kph, input this command and execute in SQL pgAdmin tool. Below further details explain the variable “X”.

UPDATE network SET traveltime = shape_leng / X*60
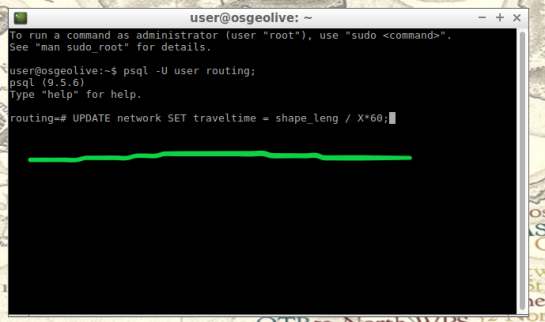
step11.2

How to find X​, ​here is an example​: Using example 30 mph as rate. To find X, we convert 30 miles to feet, we know 5280 ft = 1 mile, so we multiply 30 by 5280 and this gives us 158400 ft. Our rate has been converted from 30 miles per hour to 158400 feet per hour. For a rate of 30 mph, our equation for the field “traveltime”  equates to “shape_leng / 158400*60″. To discriminate this calculations output, we will insert additional details such as “where speed = 30;”. What this additional detail does is apply our calculated output to features with a “30” value in our “speed” field. Note: your “speed” field may be named differently.

UPDATE network SET traveltime = shape_leng / 158400*60 where speed = 30;

Repeat this step for each speed value in your shapefile examples:

UPDATE network SET traveltime = shape_leng / X*60 where speed = 45;
UPDATE network SET traveltime = shape_leng / X*60 where speed = 55;

The back end is done. Great Job!

Our next step will be visualizing our data in QGIS. Open and connect QGIS to your routing database by right-clicking “PostGIS” in the Browser Panel within QGIS main window. Confirm the checkbox “Also list tables with no geometry” is checked to allow you to see the interior of your database more clearly. Fill out the name or your routing database and click “OK”.

If done correctly, from QGIS you will have access to tables and views created in your routing database. Feel free to visualize your network by drag-and-drop the network table into your QGIS Layers Panel. From here you can use the identify tool to select each road segment, and see the source and target nodes contained within that road segment. The node you choose will be used in the next step to create the views of drive-time.

12.Create views​: In this step, we create views from a function designed to determine the travel time cost. Transforming these views with tools will visualize the travel time costs as isochrones.

The command below will be how you start querying your database to create drive-time isochrones. Begin in QGIS by draging your network table into the contents. The visual will show your network as vector(lines). Simply select the road segment closest to your point of interest you would like to build your isochrone around. Then identify the road segment using the identify tool and locate the source and target fields.

step12

step12.2

Place the source or target field value in the below command where you see ​VALUE​, in all caps​.

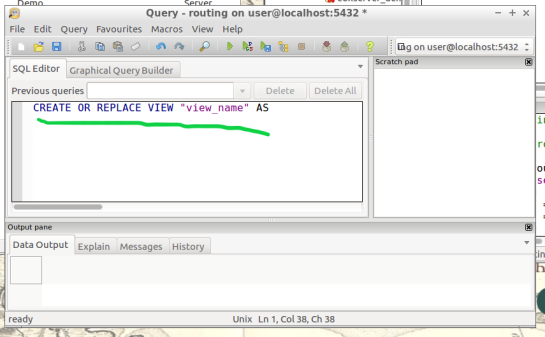
This will serve you now as an isochrone catchment function for this workflow. Please feel free to use this command repeatedly for creating new isochrones by substituting the source value. Please input this command and execute in SQL pgAdmin tool.

*AT THE BOTTOM OF THIS WORKFLOW I PROVIDED AN EXAMPLE USING SOURCE VALUE “2022”

CREATE OR REPLACE VIEW "​view_name" AS 
SELECT di.seq, 
       di.id1, 
       di.id2, 
       di.cost, 
       pt.id, 
       pt.geom 
FROM pgr_drivingdistance('SELECT
     gid::integer AS id, 
     Source::integer AS source, 
     Target::integer AS target,                                    
     Traveltime::double precision AS cost 
       FROM network'::text, ​VALUE::bigint, 
    100000::double precision, false, false)
    di(seq, id1, id2, cost)
JOIN network_nodes pt ON di.id1 = pt.id;
step12.3

13.Visualize Isochrone: Applying tools to the view will allow us to adjust the visual aspect to a more suitable isochrone overlay.

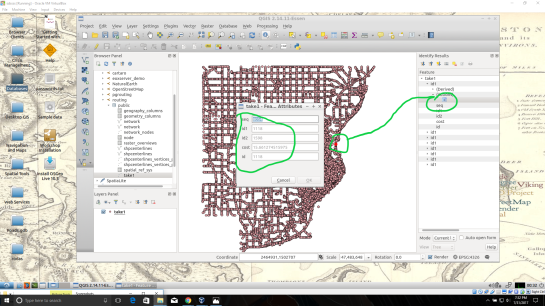
​After creating your view, a new item in your routing database is created, using the “view_name” you chose. Drag-and-drop this item into your QGIS LayersPanel. You will see lots of small dots which represent the nodes.

In the figure below, I named my view “take1“.

step13

Each node you see contains a drive-time value, “cost”, which represents the time used to travel from the node you input in step 12’s function.
step13.2

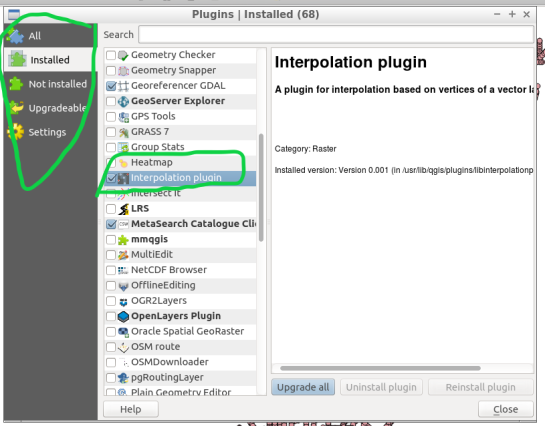
Start by installing the QGIS plug-in Interpolation” by opening the Plugin Manager in QGIS interface.
step13.3

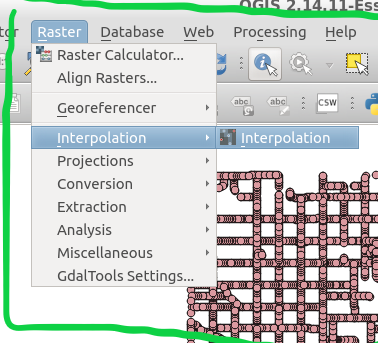
Next, at the top of QGIS window select “Raster” and a drop-down will appear, select “Interpolation”.
step13.4


A new window pops up and asks you for input.

step13.5

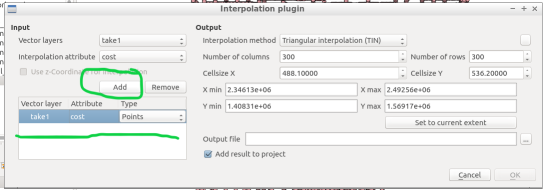
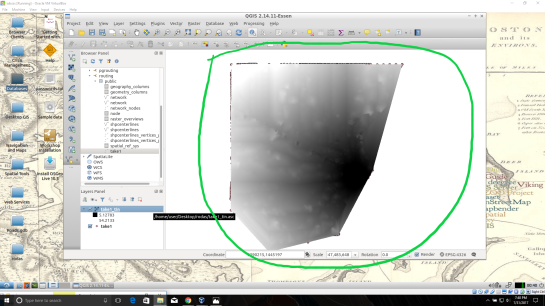
Select your “​view”​ as the​ vector layer​, select ​”cost​” as your ​interpolation attribute​, and then click “Add”.

step13.6

A new vector layer will show up in the bottom of the window, take care the type is Points. For output, on the other half of the window, keep the interpolation method as “TIN”, edit the ​output file​ location and name. Check the box “​Add result to project​”.

Note: decreasing the cellsize of X and Y will increase the resolution but at the cost of performance.

Click “OK” on the bottom right of the window.

step13.7

A black and white raster will appear in QGIS, also in the Layers Panel a new item was created.
step13.8

Take some time to visualize the raster by coloring and adjusting values in symbology until you are comfortable with the look.

step13.9

step13.10

14. ​Create contours of our isochrone:​ Contours can be calculated from the isochrone as well.

Find near the top of QGIS window, open the “Raster” menu drop-down and select Extraction → Contour.

step14

Fill out the appropriate interval between contour lines but leave the check box “Attribute name” unchecked. Click “OK”.

step14.2

step14.3

15.​ Zip and Share:​ Find where you saved your TIN and contours, compress them in a zip folder by highlighting them both and right-click to select “compress”. Email the compressed folder to yourself to export out of your virtual machine.

Example Isochrone catchment for this workflow:

CREATE OR REPLACE VIEW "2022" AS 
SELECT di.seq, Di.id1, Di.id2, Di.cost,                           
       Pt.id, Pt.geom 
FROM pgr_drivingdistance('SELECT gid::integer AS id,                                       
     Source::integer AS source, Target::integer AS target, 
     Traveltime::double precision AS cost FROM network'::text, 
     2022::bigint, 100000::double precision, false, false) 
   di(seq, id1, id2, cost) 
JOIN netowrk_nodes pt 
ON di.id1 = pt.id;

References: Virtual Box ORACLE VM, OSGeo-Live 11  amd64 iso, Workshop FOSS4G Bonn(​http://workshop.pgrouting.org/2.2.10/en/index.html​),

QGIS layouts rewrite – progress report #1

Following our recent successful QGIS Layout and Reporting Engine crowdfunding campaign, we’ve been hard at working ripping up the internals of the QGIS 2.x print composer and rebuilding a brand new, shiny QGIS layouts engine. This is exciting work – it’s very satisfying to be able to cleanup a lot of the old composer code in QGIS and take opportunities along the way to fix long standing bugs and add new features.

While it’s not ready for daily use yet, there’s already been a lot of interesting changes which have landed in the layouts work as a result of this campaign. Let’s take a look at what’s been implemented so far…

  • We’ve added support for different measurements units all throughout layouts. While this means it’s now possible to set page sizes using centimeters, inches, pixels, points, etc, it goes much deeper than just that. In layouts, everything which has a size or position can take advantage of this unit support. So you can have page sizes in centimeters, but a map item with a size set in points, and positioned in millimeters! Having pixels as a unit type makes creation of screen-based layouts much easier – even right down to pixel perfect positioning and sizing of items…
  • Page handling has been totally reworked. Instead of the single “number of pages” control available in QGIS 2.x, layouts have complete flexibility in page setup. It’s now possible to have a layout with mixed page sizes and orientations (including data defined page size for different pages in the layout!). 
  • A revised status bar, with improved layout interaction widgets. We’ve also taken the opportunity to add some new features like a zoom level slider and option to zoom to layout width:
  • Layout interaction tools (such as pan/zoom/insert item/etc) have been reworked. There’s now a much more flexible framework for creation of layout tools (based off the main QGIS map canvas approach), which even allows for plugins to implement their own layout interaction tools! As part of this we’ve addressed a long standing annoyance which meant that creating new items always drew the “preview” shape of the new item as a rectangle – even for non-rectangular items. Now you get a real shape showing exactly how the created item will be sized and positioned:
  • On the topic of plugins – the layout branch has full support for plugin-provided item types. This means that QGIS plugins can create new classes of items which can be added to a layout. This opens the door for plugins allowing charts and visualisations which take advantage of all the mature Python and JS charting libraries! This is a really exciting change – in 2.x there was no way for plugins to extend or interact with composer, so we’re really keen to see where the community takes this when 3.0 is released.
  • We’ve ported another feature commonly found in illustration/DTP applications. Now, when you’re creating a new item and just click in your layout (instead of click-and-drag), you get a handy dialog allowing you to specify the exact position and dimensions for the created item. You can again see in this dialog how layouts have full support for units for both the position and size:
  • Another oft-requested feature which we’ve finally been able to add (thanks to the refactored and cleaned code) is a context menu for layouts! It’s currently quite empty, but will be expanded as this work progresses…
  • Snapping to guides and grids has been reworked. We’ve added a new snapping marker to show exactly were items will be snapped to:
  • Snapping to guides now occurs when creating new layout items (this didn’t happen in Composer in 2.x – only snapping to grids occurred when drawing new items).
  • The snapped cursor position is shown in status bar whenever a snapped point will be used, instead of the unsnapped position.
  • Unlike in Composers in QGIS 2.x, Layouts in 3.0 adopt the standard UX of dragging out rulers to create guide lines (instead of clicking on a ruler position to create a new guide). Creation of a horizontal guide is now done by grabbing the top ruler and dragging it down, and a vertical guide is created by grabbing the left ruler and dragging it out to the layout.
  • Better feedback is given in the ruler when a guide can be dragged. We now show guide positions in the rulers, and give an indication (via mouse cursor change) when these guides can be repositioned by click-and-drag.
  • Another very exciting change is the addition of a new “Guide Manager”. The guide manager allows numeric modification of existing guides and creation of new guides. Finally it’s possible to position guides at exact locations! Again, you can see the full support for layout units in place here – guides can be positioned using any available unit.
  • There’s also a handy new shortcut in the Guide Manager to allow applying the guides from the current page to all other pages in your layout.
  • We’ve refined the snapping logic. In Composer in QGIS 2.x,  grids would always take precedence whenever both a grid and guide were within tolerance of a point. Now, guides will always take precedence – since they have been manually set by users we make the assumption that they have been explicitly placed at highly desirable snapping locations, and should be selected over the general background grid. Additionally, grid snapping was previously only done if BOTH the x and y of the point could be snapped to the grid. We now snap to the nearest grid line for x/y separately. This means if a point is close to a vertical grid line but not a horizontal one it will still snap to that nearby vertical grid line.
  • Lastly, we’ve added a handy context menu to the rulers:

This is just a taster of the great new functionality coming in QGIS 3.0. This is all a direct result of the forward-thinking investments and generosity of the backers in our QGIS Layout and Reporting Engine crowdfunding campaign. Without their contributions, none of this would be possible – so our thanks go out to those organisations and individuals once again!

Stay tuned for more updates as the work continues…


QGIS Layout and Reporting Engine Campaign – a success!

Thanks to the tireless efforts and incredible generosity of the QGIS user community, our crowdfunded QGIS Layout and Reporting Engine campaign was a tremendous success! We’ve reached the funding goal for this project, and as a result QGIS 3.0 will include a more powerful print composer with a reworked code base. You can read more about what we have planned at the campaign page.

We’d like to take this opportunity to extend our heartfelt thanks to all the backers who have pledged to support this project:

We’ve also received numerous anonymous contributions in addition to these – please know that the QGIS community extends their gratitude for your contributions too! This campaign was also successful thanks to The Agency for Data Supply and Efficiency, Denmark, who stepped up and have funded an initial component of this project directly.

We’d also like to thank every member of the QGIS community who assisted with promoting this campaign and bringing it to the attention of these backers. Without your efforts we would not have been able to reach these backers and the campaign would not have been successful.

We’ll be posting more updates as this work progresses. Stay tuned…


  • Page 1 of 5 ( 81 posts )
  • >>
  • cartography

Back to Top

Sustaining Members