Related Plugins and Tags

QGIS Planet

The 10th annual FOSS4G conference

The 10th annual FOSS4G conference was held from 8th-13th September in Portland, Oregon, USA. FOSS4G is the world’s premier global gathering of developers, users and key decision-makers involved in open source geospatial software. With over 180 talks presented covering topics from 3D printing maps with Grass GIS 7 to QGIS Map Server and beyond, FOSS4G 2014 was a resounding success. Don’t be disappointed if you could not attend, all the talks given at FOSS4G 2014 are now viewable on Vimeo, including 8 one hour invited presentations from staff at Amazon, MapZen, Boundless, Mapbox etc. These talks are well worth watching if you want to keep up to date with the latest developments in open source geospatial software.

FOSS4G 2014 General Sessions – Talks and Invited Presentations

Nautical Charts in QGIS – The Compass Rose

Before the advent of shipborne satellite navigation systems, navigation at sea required three precise measurements – Solar or Stellar Declination for Latitude, Time at Greenwich for Longitude and True North that determined the ship’s heading. True North was obtained from the ship’s Magnetic Compass, an instrument who’s name indicates at an additional complication.

A magnetic compass does not point towards True North. Magnetic North is 100s km from the Geographic North Pole and the Earth’s magnetic field is uneven, it is distorted by magnetic irregularities within the Outer Core and intrinsically magnetic Mantle and Crustal rock. Additionally, the position of Magnetic North is not fixed, it is presently drifting from Arctic Canada towards Russia at 15 km per year. Therefore True North has to be derived from Magnetic North using a correction called Magnetic Declination (or Magnetic Variation), the angular difference between Magnetic North and True North. Magnetic Declination varies from location to location and over time.

Nautical navigation charts typically contain one or more Compass Roses, also called a Windrose, these consist of two circles – an outer circle that displays the cardinal directions of North, East, South and West and a inner circle that displays the direction of Magnetic North. The Magnetic Declination and its annual rate of change is typically printed within the Compass Rose, it is therefore possible to calculate the Magnetic Declination several years after a map is printed.

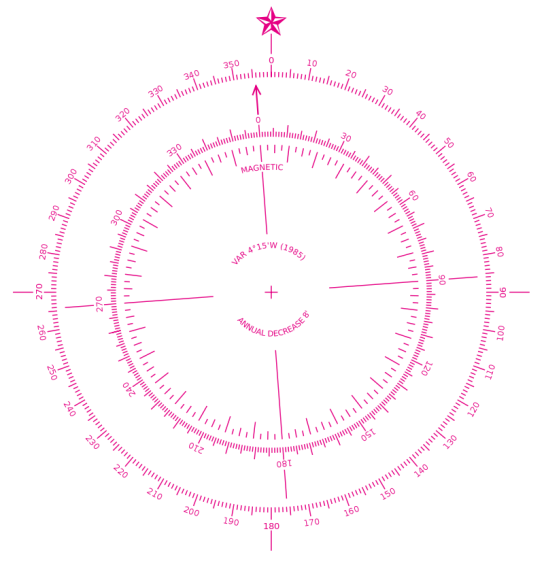
In this tutorial I will show you a process that to create a Compass Rose with the correct Magnetic Declination and Annual Rate of Change for any terrestrial location for use in QGIS. First we need to obtain a suitable Compass Rose graphic. Conveniently the United States National Oceanic and Atmospheric Administration (NOAA) published a Compass Rose in the Public Domain i.e. it is free to use without limitation. I downloaded a version of the NOAA Compass Rose from Wikimedia (or you can right click and save the Compass Rose below). Additionally, the background of this Compass Rose is transparent, this allows a map (or indeed a web page) to show though (note the Magnetic Declination in 1985 was 4 degrees 15 minutes west of True North and it had an annual decrease of 8 minutes of a degree per year).
800px-Modern_nautical_compass_rose.svg

There are several handy on-line utilities that can calculate Magnetic Declination and the Annual Rate of Change but we shall use Charles F. F. Karney’s excellent cross-platform GeographicLib in this case. GeographicLib is a suite of command line utilities for solving solving various geodesic problems such as conversions between geographic, UTM, UPS, MGRS, geocentric and local cartesian coordinates, gravity calculations, determining geoid height, and magnetic field calculations. The latest version can be obtained as a pre-compiled binary from Sourceforge or as source code.

The other essential step is to measure the precise map location in WGS84 coordinates. This can be done using the Coordinated Capture plug-in provided as standard with QGIS. To select the WGS84 coordinate reference system (CRS) click the sphere symbol in Coordinated Capture panel to open the Coordinate Reference System Selector. After setting the CRS to WGS84 (EPSG: 4326), click the icon left of the “Copy to Clipboard” button (this toggles real time display of captured coordinates) and then click “Start Capture”. The position in Decimal Degrees will be updated in the upper window as you move the cursor across the map, the lower window will display projected coordinates (in my case Pseudo Mercator EPSG: 3857). Clicking the map will select a coordinate point and the real time display will cease updating.

Wordpress

The MagneticField utility of GeographicLib is then used to calculate the Magnetic Declination and Annual Rate of Change for the captured coordinate, in this case a location east of Howth, Ireland.

$ MagneticField -r -t 2014-08-04 --input-string "53.37772 6.00935"

-3.57 67.81 18572.9 18536.9 -1152.2 45528.7 49171.3
0.17 -0.01 17.9 21.2 52.4 19.6 24.9

The results are: Magnetic Declination in degrees (-3.57); the inclination of the Magnetic Field in degrees (67.81); the horizontal strength of the magnetic field in nanotesla (18572.9 nT); the north component of the field (18536.9 nT); the east component of the field in (-1152.2 nT); the vertical component of the field in nT (45528.7 nT) and the total field (49171.3 nT). The numbers on the second line are the annual rate of change of these values, the first number is. We only need the first numbers on each line; the Magnetic Declination (-3.57) and Annual Rate of Change of Magnetic Declination (0.17). We can convert these to Degrees Minutes Seconds if required.

After calculating the Magnetic Declination and Annual Rate of Change, edit the NOAA Compass Rose in a graphics program such as  GIMP or Photoshop. In my case I copied the inner circle to a separate layer and I rotated it 3.57 degrees anticlockwise. I then added text to the Compass Rose stating the Magnetic Declination (Var.) and the Annual Rate of Change (Annual Decrease). After editing the Compass Rose graphic I finally added it to my Nautical Chart as a Image in Map Composer of QGIS.

Further Reading:

Bowditch, N. & ‎National Imagery and Mapping Agency, 2002. CHAPTER 3. NAUTICAL CHARTS. In: The American Practical Navigator: An Epitome of Navigation. Bethesda, MD : Washington, DC, Paradise Cay Publications, 9, 23–50. ISBN: 978-0939837540 http://msi.nga.mil/MSISiteContent/StaticFiles/NAV_PUBS/APN/Chapt-03.pdf


The Coastal Vignette

Vignette2

Coastal Vignette seen on an old Irish ‘6-Inch map’

Occasionally on old maps you may see a pleasing decorative effect on bodies of water called a “Coastal Vignette”, these are fine lines that highlight coastlines and lake shores. The example seen above is from a ca. 100 year old “6-inch map” of Lough Nafooey in County Galway, Ireland. I presume the Coastal Vignette effect in this example was hand drawn, it required considerable skill and patience.

These is no plugin for creating Coastal Vignettes in QGIS just yet, so I developed a simple technique to recreate the effect using the raster Proximity (Raster Distance)’ algorithm accessible in the Processing Toolbox.

In order to use the Proximity Analysis tool I first converted a Shapefile polygon depicting the sea off Dublin into a 10 by 10 metre resolution Raster using the menu command ‘Raster – Conversion – Rasterize (Vector to raster)’.

Box

This generated a Raster that coded the Sea as ‘1’ (white) and ‘0’ (black) for Land.

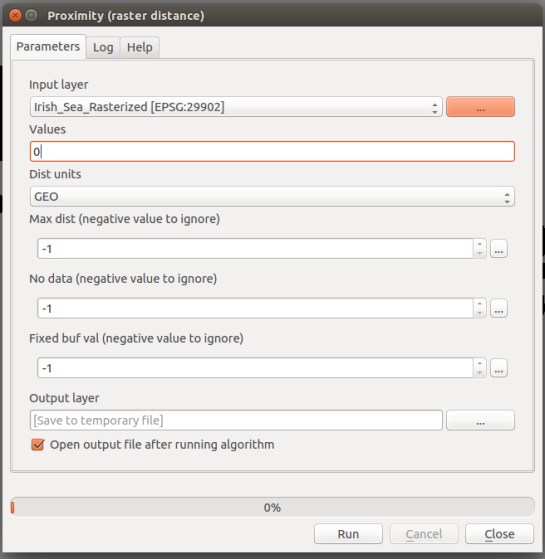
Next, I selected ‘Proximity (raster distance)’  from the Processing Toolbox – (GDAL/OGR) – [GDAL] Analysis – Proximity (raster distance). You can quickly find the command by typing the algorithm’s name in the box above the Processing Toolbox.

Screenshot5

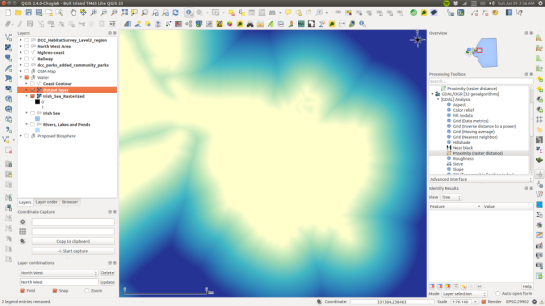
I entered 0 in the ‘Values’ box, this tells the Proximity algorithm to measure the distance away from land (a value of 0). The resulting Raster contains cell values that correspond to the distance away from the coast in metres, which I styled below.

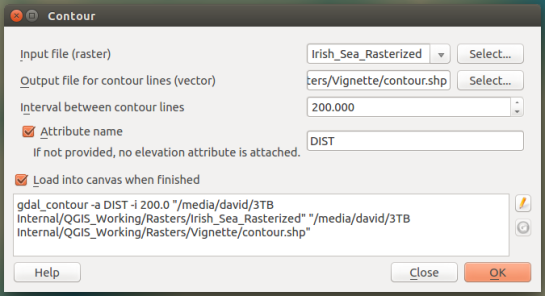
The final step is to create Contours Lines from the Proximity analysis result using the menu item Raster – Contour. In my case I used an “interval between the contour lines” of 200 metres and I added an Attribute name called “DIST”.

Screenshot7

The resulting contour lines have distance attributes attached to them can be used to create a Graduated colour style if needed, though in my cause I manually edited the attributes of 10 contour lines nearest the coast and I gradually increased the transparency of the mid-grey contour lines from opaque at the coast to fully transparent out at sea. I made the remaining contour lines transparent.

And here is the finished result, with the Sea and an OpenStreetMap base map styled to look just like Google Maps.

Finished Vignette 2


QGIS training (3 days) and Birdwatching/Field data collection (2 days) in South Portugal, January 2015

Faunalia and Imagine-Science are pleased to announce a QGIS training (3 days) course during a week that will include 2 days of field activities related to birdwatching and field data collection. Where: Portugal/Algarve, specifically “Ria de Alvor -Mexilhoeira Grande” near Portimão. When: 26 to 30 January 2015.   For more informations about QGIS training program, […]

Training courses calendar: QGIS (Desktop, Server and Web) and PostGIS

We just published our Training Courses calendar for the period September 2014 – January 2015. This includes training courses about QGIS (Desktop, Server and Web) and PostgreSQL/PostGIS in both Italy and Portugal. Training courses about QGIS python programming are available on demand. For details (locations, prices, discounts, etc.) about training courses in Portugal see: http://www.faunalia.eu/pt/training.html […]

Formação em SIG Open Source com QGIS (Quantum GIS) em Moura, 28-29-30 Maio 2014

A Faunalia, em colaboração com a ENCPB (Escola Nacional de Caça, Pesca e Biodiversidade), Comoiprel e Câmara Municipal de Moura, organiza um curso de SIG Open Source com QGIS (Quantum GIS) nos dias 28-29-30 Maio 2014. Para informações e inscrições contactar: ENCPB (Escola Nacional de Caça, Pesca e Biodiversidade) E-Mail: [email protected] Telefone: 285251354   Programa […]

Formação em SIG Open Source com QGIS (Quantum GIS) em Moura, 17-18-19 Março 2014

A Faunalia, em colaboração com a ENCPB (Escola Nacional de Caça, Pesca e Biodiversidade), Comoiprel e Câmara Municipal de Moura, organiza um curso de SIG Open Source com QGIS (Quantum GIS) nos dias 17-18-19 Março 2014. Data limite para inscrições: 3 de Março. Para informações e inscrições contactar: ENCPB (Escola Nacional de Caça, Pesca e […]

Corsi speciali: “GDAL/OGR avanzato” e “Sviluppare un’applicazione web geospaziale”

Un’occasione speciale: due corsi avanzati, tenuti da uno dei massimi esperti nazionali del settore. A Pontedera (PI), vedi http://www.faunalia.it/calendario per dettagli logistici. Costo per ciascun corso: 350 € (+ IVA per aziende/partite IVA). Sconto 10% per l’iscrizione simultanea ad entrambi i corsi. Scrivete a [email protected] per dettagli. GDAL/OGR avanzato 18-19-20 Novembre 2013 Primo giorno: lavorare […]

Some maps from trainees in our workshop in Dar es Salaam

Here is what our course attendees were producing after a day on our course.

A map by Msafiri Mwaikusa

And here is what attendee Nyarobi Makuru produced today...

A map by Nyarobi Makuru

Tomorrow is openModeller day. More to follow...

Reflecting on a month of internships at Linfiniti.com

Interns

Its been a busy month. A few months ago I set things in motion by advertising for interns to come and work and learn about FOSS GIS at linfiniti.com. In tandem with that I invited Anne Ghisla to come out to South Africa from Italy to act as mentor for the interns.

When Anne arrived we interviewed various candidates and selected two - Robert Makondo and Samantha Lee Pan. You will no doubt read postings from them elsewhere on this blog as I have encouraged them to start writing articles and sharing their learning post publicly.

The aim of the internship programme is simple: transfer real-world FOSS GIS skills to interns so that we can build up the skills base in South Africa and eventually greater Africa. One day I would love to be running a kind of academy where we have a continual succession of interns from all over Africa participating in our internship programme and taking FOSSGIS skills and enthusiasm back to their place of work or study. What we are doing now is a small step in that direction.

Unfortunately Samantha (Sam) could only stay with us for the month of February as she is going into permanent employment next month. I decided to bid Sam farewell by taking the group out for a morning at the Lion and Rhino park about 30 minutes from our Linfiniti Offices in Lanseria, near Johannesburg, SA. Of course being a bunch complete geogeeks we did a GPS drive as we went (i.e. we captured our route using the new GPS plugin for QGIS that Marco and I wrote). Here is a little map of our trip (click for larger image)!

GPS Drive in the Lion and Rhino Park

Capturing data in this way is a fun and entertaining way to expose interns to the process of primary data capture. The location was also a great choice as some in our group had never before seen lion, buffalo, wild dogs and other charismatic wild animals.

Buffalos on our GPS Drive

Sam and Robert sat in the back and learned to operate the GPS and the GPS Tracker plugin for QGIS.

Sam and Robert capturing data on our drive

We finished our little outing with a short walk to look at the hippos wallowing in a pond. Heres a shot of us all on the hippo viewing platform (sorry we couldnt get the hippos into the shot too :-( ).

Linfiniti Team @ Rhino and Lion Nature Reserve

Next week we will say 'goodbye' to Samantha and 'hello' to Petronella, a Zimbabwean lady who will be joining us as an intern for the months of March and April. We will also be joined for the week by two other interns from the start-up company of my friend Andiswa Silinga. Andiswa is going to be getting her interns to do some digitising work using FOSSGIS so they will come to Linfiniti for occasional visits to get up to speed with the FOSSGIS way of doing things.

Training Environment

One of the cornerstones of my setup for providing a training environment has been LTSP (the Linux Terminal Server Project). I have blogged previously about my testing experiences with LTSP. For the LTSP server, I purchased one fairly good spec quad core pc which then acts as a server for up to four thin clients. I bought 3 Fujitsu Futro 100 units for thin clients which connect to the LTSP server. The system works admirably well and we have had 'nary a hiccup over the month of solid production use. There have only been a few small issues. The GIMP for example causes X to hang when opening a file.

Using thin clients has many advantages - it is extremely simple for users to share files since they are all logged on to the same system. Also, there is only one server / machine to manage. We can get connected to the internet using a single 3G modem which we plug in to the server and then everyone on the thin clients gets internet access.

Since buying the Futro clients I have also being experimenting with using other clients. I dug out a very old and mostly dead thinkpad laptop and set its bios to do etherboot. I plugged it in to the power (its battery is long since deceased) and into an external CRT monitor (its lcd display has also given up the ghost) and voila we have another client for our network. I will probably avoid using old desktop PC's for this purpose since they consume a lot of power and make a lot of noise, but if you are in the position where you want to maximise value and minimise your landfill contribution, using old desktop pc's would also work fine.

One more thing I wanted to mention is the the iTalc application that you can run on top of LTSP. iTalc lets you view a gallery of connected thin clients, broadcast a message to any client, share your screen or a window with all clients (e.g. while doing a demo), lock, reboot etc. the clients. I think if I scale up to a classroom environment, it really is going to prove to be a great option.

Morning Sessions

We have established a pattern of having morning 'geekout' sessions of around an hour long where we discuss a topic for the day. I don't rigidly plan what the topics will be - they either relate to some work we are trying to produce, something I have been thinking about, or another piece of the FOSSGIS jigsaw puzzle I want to let the interns know about. Here is a pic of our whiteboard doodlings from such a session:

Intern Training Doodling

Mentors

After the morning 'geekout' session we task the interns with some work for the day and then I usually run off to a client or try to knuckle down to some work. Anne continues providing mentorship to the interns through the day. The system works really well - although if I had one complaint it would be that my productivity has been reduced somewhat by the extra activities surrounding the interns. I really can't praise Anne enough here - if it wasn't for her, having interns would probably consume far larger amounts of my time. She is patient and enthusiastic and she instills her sense of FOSSGIS enthusiasism into the interns. I will be really sad to see Anne go at the end of March. However, I've had a couple of other folks in europe interested in providing mentoring services so stay tuned for the musings of other FOSSGIS celebrity guest mentors on this blog!

Biting off more than I can chew

Maybe we are biting off more than we can chew trying to launch a internship / mentoring programme from such a small company, but the wheels of government and NGO support and funding turn slowly and I wield little to no influence in the circles where decent funding gets allocated for these activities. So in the spirit of Open Source we are starting something small (like a little bit of code to scratch and itch) and hoping that others will pick up on it and let us expand the concept out to the larger African audience out that is starving to get a leg up in a GIS world dominated by expensive proprietary software that does them no favours.

Note: Edited Feb 27 to fix some 2am typos and bad grammar.

  • Page 1 of 1 ( 10 posts )
  • training

Back to Top

Sustaining Members