


BGT import plugin
The Dutch Basisregistratie Grootschalige Topografie (BGT) is exchanged via gml. Unfortunately the used gml application schema is quite involved and leads to incomplete imports in QGIS. The BGT-import plugin is now available so that the gml files can be imported correctly. To illustrate the point two screen shots (one wrong, and one right):
Masking features in QGIS 2.4
Have you ever wondered how to mask features on a map, so that only a particular zone is highlighted ? There have been a simple plugin to do that for a while. Called ‘Mask’, it allowed to turn a vector selection into a new memory layer with only one geometry made by the geometric inversion of the selection: the polygons that were selected get transformed into holes of a squared polygon bigger than the current extent.
One could then use this new layer, like any other one and apply a vector symbology on it. An opaque color to mask everything but the selection, or some semi-transparent color in order to only highlight the selection. It was very useful but came with some limitations, and especially the fact that no update of the ‘mask’ layer was done during an atlas printing.
Thanks to the support of Agence de l’Eau Adour Garonne, Oslandia has been developing some evolutions to the core of QGIS, as well as to the mask plugin.
The core part consists of a new feature renderer that can be used on any polygon vector layer, as a symbology element. It is called inverted polygon renderer and allows to apply any other renderer to polygons that have been inverted.
It was designed originally to allow only simple filling mode to be applied to the exterior ring of polygons, but it now allows to use more complex renderers like graduated, categorized or even rule-based renderers.
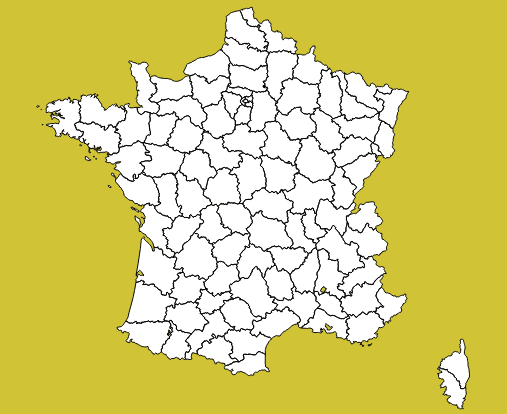
Inverted polygons: Simple usage
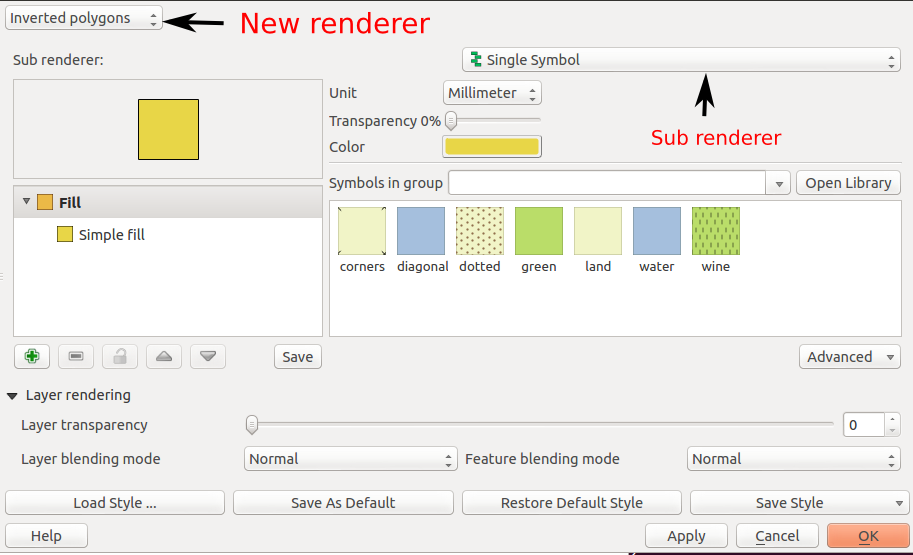
The simplest usage is to select the default sub renderer that is set to “single symbol” in order to have a uniform exterior fill of a layer.
Advanced usage
When the sub-renderer used by the inverted polygon renderer has different symbol categories, features are grouped by symbol category before being inverted and rendered. It then only makes sense when the symbology used is partly transparent, so that the different inverted polygons can be distinguished from each other.
This can be used for example to render a semi-transparent shapeburst fill around the current atlas feature.
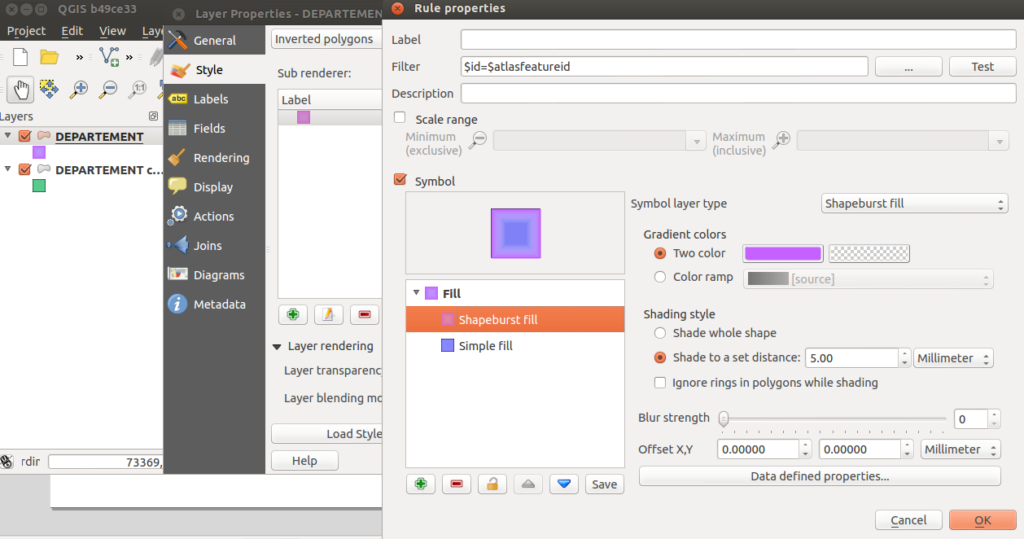
In this example, we have an inverted polygon renderer with a rule-based sub renderer. The rule will only select the current atlas geometry, thanks to the expression $id=$atlasfeatureid.
The symbol used is made of two symbol layers: a semi-transparent blue simple fill and a shapeburst fill on top of it.
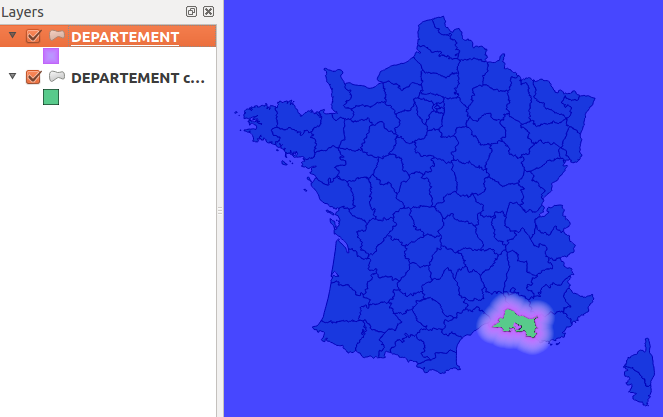
The polygon layer is then duplicated to also have a green “interior fill” for each polygon.
The output can be seen hereafter:
Label masking
When the map has labels enabled, this inverted polygon renderer is not sufficient to mask labels as well. When a user wants to highlight a particular zone on a map, she usually also wants to mask labels that are around, or at least make them less visible. The way QGIS handles labels out of the box is not directly compatible with this need. QGIS always displays labels on top of every other layers.
To circumvent this, the original ‘mask’ plugin has been enhanced in order to be aware of layers with labels. A new ‘mask’ layer can be computed and its geometry can be used to test whether a feature has to be labeled or not. The plugin exposes two special variables that are available for any expressions :
- in_mask(srid) will return a boolean that tests if the current feature is in the mask. The parameter srid is the SRID projection code of the layer where this function is used.
- $mask_geometry will return the current mask geometry
Different spatial predicates can be used to test if the current feature lies inside the highlighted zone. A different type of predicate will be used for polygon layers, line layers and point layers.
Suppose we have a map of some french départements with a background raster map, and some linear layer displaying rivers.
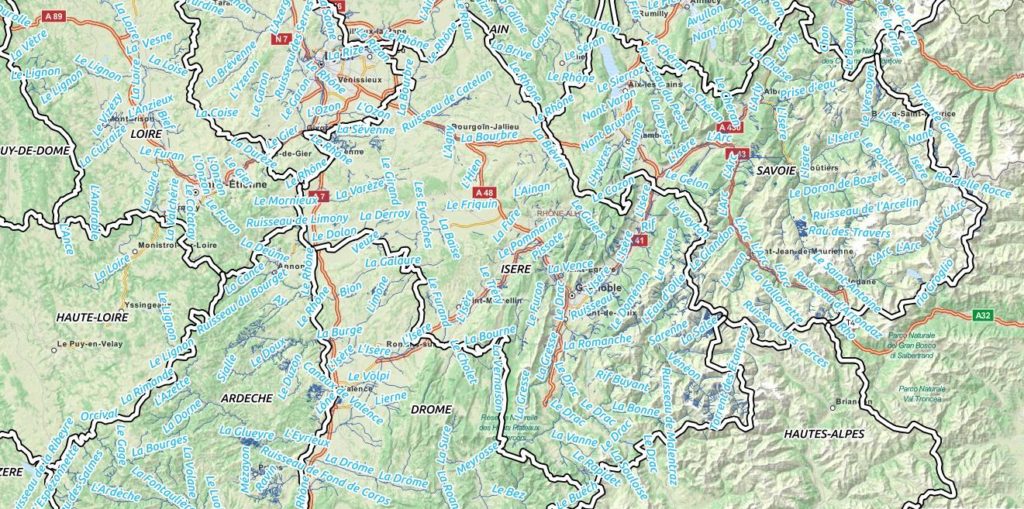
If we want to highlight only one département, we can use the mask plugin for that. We will first select it and call the plugin.
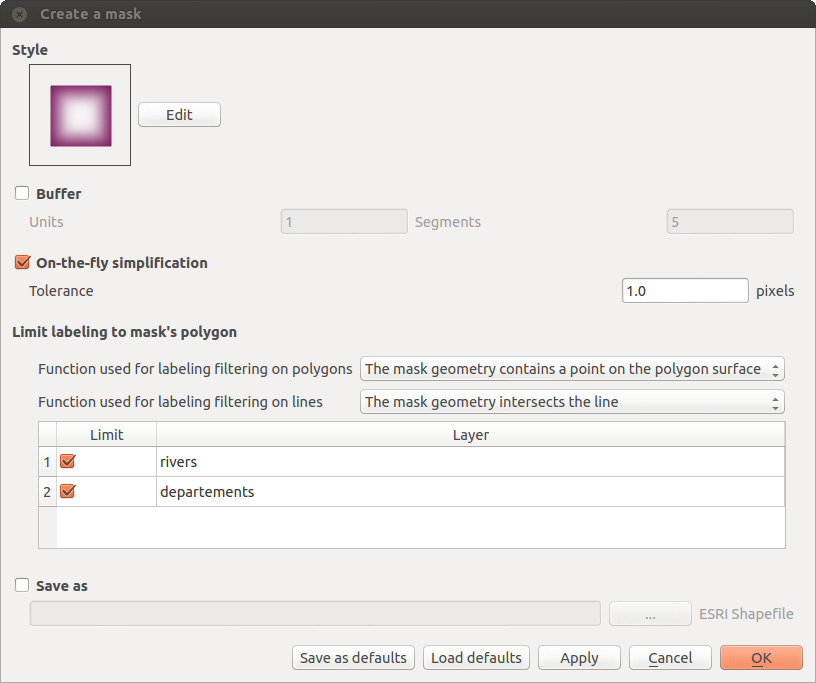
A fancy inverted polygon symbology, based on a shapeburst fill is created. We see here that we can choose the function that will be used for filtering the labeling. By default these functions are “pointOnSurface” for polygon layers and “intersects” for line layers.Here, we want both the départements layer and the rivers layers to see their labeling rules modified in order to hide the labels outside of the defined mask polygon.
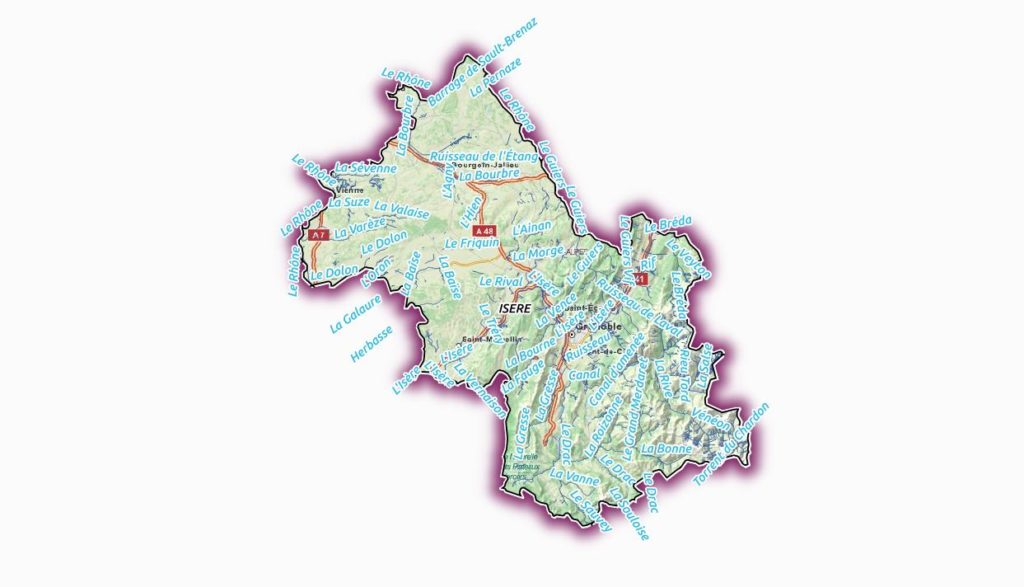
By modifying the mask symbology, adding a little bit of transparency, we obtain the following result :
The plugin is able to interact with the atlas printing and will update its mask geometry as well as the labels that are allowed to be displayed.
The mask layer can also be saved with the project, using a memory layer if you use the Memory Layer Saver plugin, or using an OGR vector file format.
Here is a short video that shows how the plugin can be setup for a simple mask with an atlas print.
How to get the plugin ?
The new mask plugin is available in its 1.0 version on the QGIS official repository of plugins. It requires QGIS 2.4. We are currently investigating the addition of this label masking feature to the QGIS core. The idea would be to have a concept of “label layer” that could then be hidden by others, or even made partly transparent.
It is not an easy task, though, since it would require to rework parts of the labeling and rendering engine.
If you are interested by such a feature, please let us know !
Creating a Tissot’s Indicatrix in QGIS
The task of projecting, or unfolding the spherical Earth onto a flat map, is an age old problem in cartography. Projection almost always introduces distortion, most projections cannot preserve angles, areas and distances at the same time, they may be conformal (angle-preserving), equal-area (area-preserving) or equidistant (distance preserving) but not all at once. The only exception is a Globe, which preserves angles, areas and distances perfectly. Thus a projection is a compromise.
The choice of projection depends on a map’s use, scale and audience. Conformal projections, for example, are preferred for nautical charts or small scale maps because they locally preserve angles necessary for navigation and survey drawings. Equal-area projections are best suited for maps of broad continental region as they preserve the relative sizes of countries, seas and oceans and allow comparison between regions. Finally, there are hybrid projections that minimise the distortion by merging conformal and equal-area projections, these can be used to create visually pleasing maps of the entire Earth (for a guide to selecting a map projection see Fig. 9 in Jenny (2011), link below).
But how does one measure the degree and type of distortion in a map projection?
One elegant method was developed in the 1880s century by the French cartographer Monsieur Nicolas Auguste Tissot, the Tissot’s Indicatrix (or Tissot’s Ellipse). This mathematical contrivance consists of a grid of infinitely small circles that measures the degree and type of distortion caused by projection. While Monsieur Tissot’s approach is mathematical, involving infinity small circles, his technique can be approximated overlaying a regular grid of large circles and crosses to a map.
The Indicatrix Mapper plugin for QGIS by Ervin Wirth and Peter Kun creates a Tissot’s Indicatrix by adding a vector layer of circles and crosses in a gridded pattern on a map. The degree and type of distortion of the Tissot’s Indicatrix reveals the class of map projection as follows: –
- If a projection is conformal, the area of circles and sizes of the crosses will change while the shapes of circles remain the same and intersection angle of the crosses will always meet at 90 degrees e.g. Mercator projection
- If a projection is equal-area, the area of the circles will remain the same while the shape of the circles change and intersection angle of the crosses will not always meet at 90 degrees e.g. Mollweide projection or Hammer projection
- If a projection preserves neither property, the area of the circles and their shape will change, and the intersection angle of the crosses will not always meet at 90 degrees e.g. Robinson
After adding the Indicatrix Mapper plugin to QGIS (menu Plugins – Manage and Install Plugins) first add a basemap using the OpenLayers plugin e.g. Bing Aerial layer, then click the Indicatrix Mapper icon and run the plugin using default settings. You can then select different projections (lower right in world icon QGIS) to see the effects of various protections on the Tissot Indicatrix. If the circles appear as squares after selecting a different projection, right click the Circles layer in the layers panel, then select the Rendering tab and deselect the Simplify geometry check box. Also, turn off the basemap layer when using different projections, unfortunately the OpenLayers plugin only supports Google Mercator projection (EPSG 3857). To create the basemap below, that can be displayed using different projections, I styled vector data downloaded from Natural Earth and OpenStreetMap.

Mercator Projection – the area of the circles and size of the crosses increase towards the poles but their shape remains the same.

Mollweide Projection – the area of the circles remain the same but their shapes are distorted, the crosses do not always intersect at 90 degrees.

Robinson Projection – both the area of the circles and intersection angle of the crosses circles vary.
It is important to note that a Tissot’s Indicatrix generated in QGIS is an approximation of mathematical ideal, we are not no longer dealing with infinity small circles. As a result, here will be some minor distortion visible towards the edge of a map independent of the projection used; notice that the circles in the Mercator projection nearest the poles are not quite symmetrical or the circles at the edge of the Mollweide projection do not appear to preserve area as they should. This anomalous distortion can be minimised by reducing the size and spacing of the circles and crosses created by the Indicatrix Mapper plugin. However, despite these limitations a Tissot’s Indicatrix elegantly reveals the distortion present. This is something to important to understand when when choosing a map projection.
References:
Jenny, B., 2012. Adaptive composite map projections [PDF]. Visualization and Computer Graphics, IEEE Transactions on, 18, 2575–2582.
Tissot, M.A., 1881. Mémoire sur la représentation des surfaces et les projections des cartes géographiques. Gauthier-Villars.
ArcGIS REST API Connector Plugin for QGIS
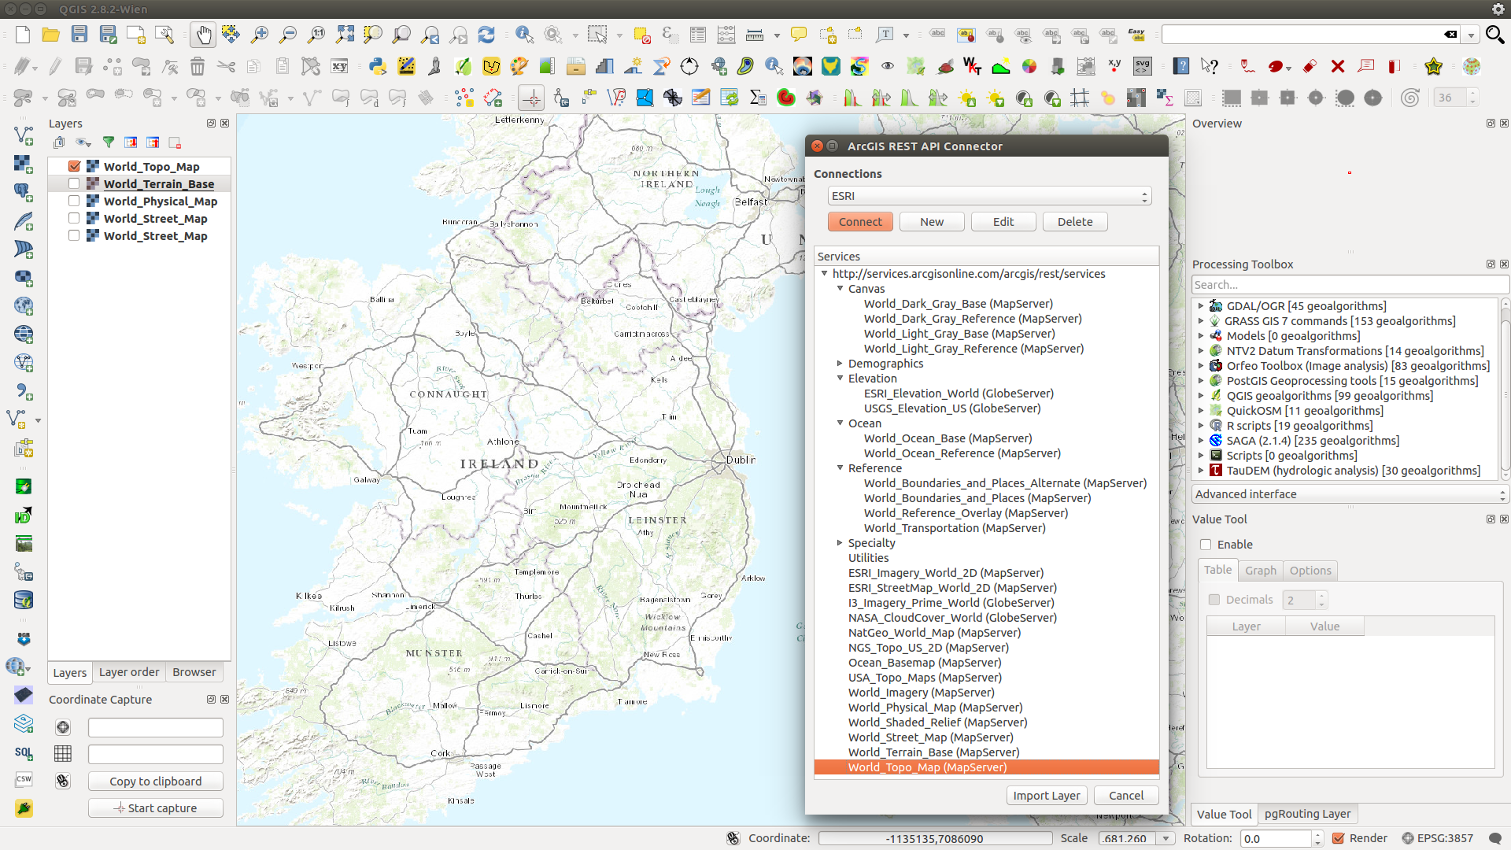
Last year we described a command line method that adds ESRI REST layers in QGIS. Well, a team at the Geometa Lab in the University of Applied Sciences Rapperswil (HSR) Switzerland, have released a plugin for QGIS that adds ESRI REST layers via a GUI (Github page). The plugin is experimental so you will need to tick the box “Show also experimental plugins” in the settings panel of the “Plugins – Manage and Install Plugins” dialogue in order to add the plugin to QGIS. The following URLs lists numerous REST layers in the plugin’s GUI:
http://services.arcgisonline.com/arcgis/rest/services
http://basemap.nationalmap.gov/arcgis/rest/services
http://services.nationalmap.gov/arcgis/rest/services
Reference:
A interactive command bar for QGIS
Something that has been on my mind for a long time is a interactive command interface for QGIS. Something that you can easily open, run simple commands, and is interactive to ask for arguments when they are needed.
After using the command interface in Emacs for a little bit over the weekend – you can almost hear the Boos! from heavy Vim users :) – I thought this is something I must have in QGIS as well. I’m sure it can’t be that hard to add.
So here it is. A interactive command interface for QGIS.


The command bar plugin (find it in the plugin installer) adds a simple interactive command bar to QGIS. Commands are defined as Python code and may take arguments.
Here is an example function:
@command.command("Name")
def load_project(name):
    """
    Load a project from the set project paths
    """
    _name = name
    name += ".qgs"
    for path in project_paths:
        for root, dirs, files in os.walk(path):
            if name in files:
                path = os.path.join(root, name)
                iface.addProject(path)
                return
    iface.addProject(_name)
All functions are interactive and if not all arguments are given when called it will prompt for each one.
Here is an example of calling the point-at function with no args. It will ask for the x and then the y

Here is calling point-at with all the args

Functions can be called in the command bar like so:
my-function arg1 arg2 arg2
The command bar will split the line based on space and the first argument is always the function name, the rest are arguments passed to the function. You will also note that it will convert _ to - which is easier to type and looks nicer.
The command bar also has auto complete for defined functions – and tooltips once I get that to work correctly.
You can use CTRL + ; (CTRL + Semicolon), or CTRL + ,, to open and close the command bar.
What is a command interface without auto complete

Use Enter to select the item in the list.
How about a function to hide all the dock panels. Sure why not.
@command.command()
def hide_docks():
    docks = iface.mainWindow().findChildren(QDockWidget)
    for dock in docks:
        dock.setVisible(False)
alias command
You can also alias a function by calling the alias function in the command bar.
The alias command format is alias {name} {function} {args}
Here is an example of predefining the x for point-at as mypoint
-> alias mypoint point-at 100
point-at is a built in function that creates a point at x y however we can alias it so that it will be pre-called with the x argument set. Now when we call mypoint we only have to pass the y each time.
-> mypoint
(point-at) What is the Y?: 200
You can even alias the alias command – because why the heck not :)
-> alias a alias
a mypoint 100
a is now the shortcut hand for alias
WHY U NO USE PYTHON CONSOLE
The Python console is fine and dandy but we are not going for a full programming language here, that isn’t the point. The point is easy to use commands.
You could have a function called point_at in Python that would be
point_at(123,1331)
Handling incomplete functions is a lot harder because of the Python parser. In the end it’s easier and better IMO to just make a simple DSL for this and get all the power of a DSL then try and fit into Python.
It should also be noted that the commands defined in the plugin can still be called like normal Python functions because there is no magic there. The command bar is just a DSL wrapper around them.
Notes
This is still a bit of an experiment for me so things might change or things might not work as full expected just yet.
Check out the projects readme for more info on things that need to be done, open to suggestions and pull requests.
Also see the docs page for more in depth information
Filed under: Open Source, python, qgis Tagged: plugin, pyqgis, qgis

Oceancolor Data Downloader v1.0 for QGIS

Sea Surface Temperature data downloaded by Oceancolor Data Downloader.
The Oceancolor Data Downloader is a new plugin for QGIS from the Mapping and Geographic Information Centre of the British Antarctic Survey that downloads Oceancolor and Sea Surface Temperature data from NASA’s Oceancolor website. The plugin currently downloads three datasets:
- MODIS AQUA chlorophyll concentration
- SeaWiFS chlorophyll concentration
- MODIS AQUA night time Sea Surface Temperatures
The data accessed includes daily, 8 day, monthly and yearly composites, all of which can be saved to disk while downloading. Future plans for the plugin include additional access to other datasets such as ocean Net Primary Production, selection by bounding box, the ability to save in other formats, a progress bar etc.
I used the plugin to download global Sea Surface Temperatures for the 13th Jan 2015. I then used shapefiles from Natural Earth to create a simple basemap. I finally chose the IBCAO Polar Stereographic projection (EPSG: 3996) to create a map centred on the North Pole.
If you use the plugin to produce published research, please cite:
![]()
Go2streetview plugin for QGIS
A very handy plugin for QGIS I use day to day is go2streetview by Enrico Ferreguti. The plugin adds an icon to the tool bar in QGIS and when selected I can click a road or street on a base map and a window will open that displays the Google Street or a Bing Maps Bird’s Eye view of the location. The camera’s direction and location is highlighted by a blue marker. I use the plugin when tracing boundaries of parks, open spaces and foot paths from aerial imagery. If the imagery is blurred or the view is obscured by trees, I click a point on a nearby street to see the location up close. The plugin works wherever Google Street view and Bing Birds Eye has coverage.
For example, in the screen-shot below notice there is a footpath leading to a bus shelter that’s not mapped by OpenStreetMap. I know where it is now, I will add it to my map.

How the West was Won (or QGIS rocks!)
 !<tl><dr>
Local Authorities work with people and assets. Most people have an address and assets are mostly located somewhere. As my old geography teacher used to say, “everything has geography, geography is everything”. For people who work in Local Authorities being able to find an accurate and up-to-date address easily is key to being able to deliver a service quickly and efficiently. If GIS officers had their way even more of the Council back office systems across the country would hook up to the corporate GI database and do cool stuff with spatial information.
At the recent AGI GeoCom and FOSS4G conferences in Nottingham during Maptember QGIS 2.0 was launched and garnered a lot of attention from people interested in finding solutions to save money and time and still deliver great results. I came away with a resolution to push for the use of QGIS at work in an attempt to get a desktop GIS onto more desktops while not breaking the bank. I had also met Simon Miles (@geosmiles) and eagerly followed his talk of creating a hybrid GI infrastructure using a mix of open-source and proprietary software.
QGIS fitted the bill with its extensive range of functionality, growing list of available plugins, super easy connectivity to a range of data sources including Oracle, SQL Server and PostGIS, all of which we use. The one thing it was lacking was a search plugin to let the users search the corporate address gazetteer for postal address and street names. Our existing GIS has such a plugin and it works well but not with the imminent upgrades. There had to be something that could connect to the gazetteer table in our PostGIS database, search and display an address.
 Enter the QGIS Gazetteer Plugin developed by Astun Technology, Nathan Woodrow and Matt Walker. Add some keen peeps from the UK QGIS User Group and some social networking and stuff begins to happen.
After downloading and installing the plugin I soon hit a brick wall – or rather a firewall – the security at work wouldn’t let the Yahoo and Geonames gazetteers work and we don’t have Astun’s iShareGIS software stack. I delved into the code to see if I could work out what was happening and hit another wall – how does this Python stuff work? Nought for two after one over.
After some chat on the UK QGIS Google+ group I found some people in Local Government across the UK who have managed to get the plugin to work and work well. Simon Miles (Royal Borough of Windsor and Maidenhead), Kevin Williams (Neath-Port Talbot) and Matt Travis (Dartmoor National Park) rallied to my call and soon I had some code in my grubby mitts. An hour after that I had a working plugin searching our address and street gazetteers, postcodes and planning applications. Listed buildings, building warrants and others soon followed. I shared the plugin with some of our power users and they were very impressed and have even started asking for enhancements.
This whole process is a great example of how a User Group can work when coupled with FOSS4G fans, social media, open-source software and a common problem to solve. Being able to present a working solution to users and managers in just a few days certainly strengthens the case for using QGIS alongside the traditional GIS tools and maybe, in time, replacing them.
What follows is a rather more technical description of the installation and configuration of just about the single most useful application a Council officer could ask for. If you want the short version and can do the tech stuff then go to https://github.com/mixedbredie/qgis-gazetteer-search and get it, otherwise hang in there to the end…
What you need:
1. QGIS 2.0 installed
2. the QGIS Gazetteer plugin installed
3. a PostGIS database with some gazetteer tables
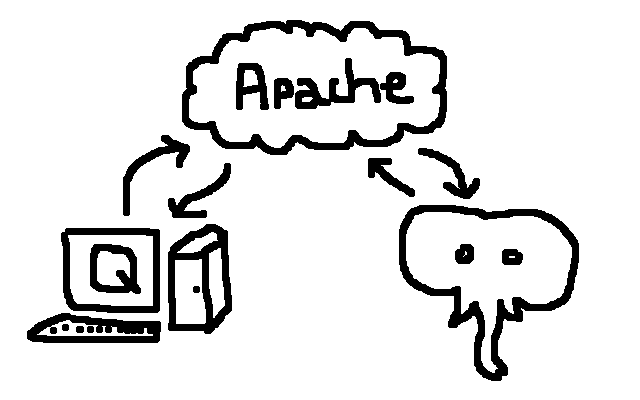
4. an Apache2 web server
1. QGIS
Install QGIS 2.0 – I used the standalone installer from http://www.qgis.org/en/site/forusers/download.html
2. QGIS Gazetteer Plugin
Install the QGIS Gazetteer plugin from https://github.com/AstunTechnology/QGIS-Gazetteer-Plugin by downloading the zip file and extracting into your .qgis2 folder. This is located at
C:\Documents and Settings\<Username>\.qgis2\python\plugins\ (Windows XP) or
C:\Users\<Username>\.qgis2\python\plugins\ (Windows 7+).
Make sure that the extracted directory is called “gazetteersearch”. Matt Walker (@_walkermatt) has upgraded the plugin to work with QGIS 2.0 and added a few enhancements like an OpenStreetMap search.
In the “gazetteers” sub directory there a “config.ini” file which needs to be edited to list the datasets we want to search. I’ll show how to connect to the address and street gazetteers and a table of postcode areas.
I deleted the GeoNames, Yahoo and AstunTechnology lines and inserted the following:
[LLPG]
gazetteer:llpg
[LSG]
gazetteer:lsg
[Postcode]
gazetteer:postcodes
Create three files in the gazetteers folder – llpg.py, lsg.py and postcodes.py
In the llpg.py file put:
import json
import collections
url = "http://10.135.1.69/cgi-bin/llpg_pg.py"
params = {
    'address': '##searchstring##'
}
def parseRequestResults (data):
json_result = json.loads (data)
    for item in json_result:
        result = collections.namedtuple ('Result', ['description','x','y','zoom', 'epsg'])
        result.description = item['address']
        result.x = float (item['easting'])
        result.y = float (item['northing'])
        result.zoom = 1250
        result.epsg = 27700
        yield result
In the lsg.py file put:
import json
import collections
url = "http://10.12.345.678/cgi-bin/lsg_pg.py"
params = {
    'address': '##searchstring##'
}
def parseRequestResults (data):
json_result = json.loads (data)
for item in json_result:
        result = collections.namedtuple ('Result', ['description','x','y','zoom', 'epsg'])
        result.description = item['address']
        result.x = float (item['easting'])
        result.y = float (item['northing'])
        result.zoom = 2500
        result.epsg = 27700
        yield result
In the postcodes.py file put:
import json
import collections
url = "http://10.12.345.678/cgi-bin/postcodes_pg.py"
params = {
    'postcode': '##searchstring##'
}
def parseRequestResults (data):
    json_result = json.loads (data)
    for item in json_result:
        result = collections.namedtuple ('Result', ['description','x','y','zoom', 'epsg'])
        result.description = item['postcode']
        result.x = float (item['easting'])
        result.y = float (item['northing'])
        result.zoom = 2500
        result.epsg = 27700
        yield result
You need to set the correct server IP address in the URL and link to the correct file in the cgi-bin. You can also set the zoom scale for the results and I use ESPG:27700 as everything we have is in British National Grid.
If you restart QGIS and enable the plugin you’ll see there are now four search options in the drop-down list. Right, now to make sure PostGIS has the correct information.
3. PostGIS Database
The installation and configuration of PostgreSQL and PostGIS is more than this post is going to address but you’ll need to have one. With some tables in it with some data that can be searched. We load our address and street gazetteers into PostGIS on a daily basis and these tables are used by the plugin for searching and displaying records. Our tables have a UPRN (Unique Property Reference Number) field and an ADDRESS field with a full address in it (name number street town locality postcode). The address gazetteer has a point geometry. The street gazetteer has a USRN (Unique Street Reference Number) and a NAME field with the full descriptive name of the street in it. It has a line geometry. Almost any table can be searched as long as it has a unique id, a text field for searching, and some geometry.
Our address gazetteer already had the correct fields in so nothing had to be done but the street gazetteer needed some changes. I created a view of the streets to change the name of the fields to fit with what the plugin was expecting:
CREATE OR REPLACE VIEW angusdata.search_lsg_streets AS
SELECT a.usrn AS uprn,
btrim(pg_catalog.concat('usrn:', btrim(a.usrn::text), ' ', btrim(a.street::text), ' ', btrim(a.locality::text), ' ', btrim(a.town::text))) AS address,a.geometry
FROM lsg_streets a;
This changes the USRN field to UPRN and concatenates USRN, STREET, LOCALITY and TOWN to create an ADDRESS field and then adds the geometry.
The Postcodes table has polygon geometry and a postcode field and the python script that creates the web service has been tweaked to work with this. The next section will explain how to create the web services on Apache2.
4. Apache
I have a local Apache2 webserver running on my PC but it’s pretty easy to get one set up on server if you chat to the right people :-) so get one installed (http://www.apachehaus.com/cgi-bin/download.plx). The plugin uses the web services running in the Apache2 cgi-bin to connect to the PostGIS database to query the gazetteers. You’ll also need to have Python (http://www.python.org/download/releases/2.7.5/) installed on the same machine. And the Python psycopg2 module (http://www.stickpeople.com/projects/python/win-psycopg/).
First up, the Apache2 server needs to be configured to allow use of the cgi-bin. Edit the httpd.conf file and make the following changes.
Uncomment the following lines to enable the modules:
LoadModule access_compat_module modules/mod_access_compat.so
LoadModule cgi_module modules/mod_cgi.so
LoadModule proxy_fcgi_module modules/mod_proxy_fcgi.so
LoadModule rewrite_module modules/mod_rewrite.so
Set the server name to its IP address:
ServerName 10.12.345.678:80
Allow access to the server:
<Directory />
  Options Indexes FollowSymLinks ExecCGI
  AllowOverride All
  Order allow,deny
  Allow from all
  Require all granted
</Directory>
Set the file that Apache will serve if a directory is requested:
<IfModule dir_module>
  DirectoryIndex index.html index.htm index.php index.php3
</IfModule>
Allow access to the CGI directory and enable it to handle python scripts:
<Directory "${SRVROOT}/cgi-bin">
  Options Indexes FollowSymLinks ExecCGI
  AllowOverride All
  Order allow,deny
  Allow from all
  Require all granted
  AddHandler cgi-script .cgi .py
</Directory>
This is a pretty basic configuration and it could probably be improved but it works on my system.
Then in the CGI-BIN directory create some files, one for each web service and to match the gazetteers listed in the config file. I created three files called llpg_pg.py, lsg_pg.py and postcodes_pg.py.
In the llpg_pg.py file the SQL query selects the records that match the search string and uses the point geometry of the records to return to the plugin.
#!D:/Python27/python.exe
# -*- coding: UTF-8 -*-
import cgi
import json
import psycopg2
sql = """select a.uprn, a.address, ST_X(a.geometry), ST_Y(a.geometry)
from angusdata.address_gazetteer a
where a.address ilike '%%' || (%(p_address)s) || '%%'
order by address"""
form = cgi.FieldStorage ()
connection = psycopg2.connect ("host='10.12.345.678' port='5432' dbname='postgisdb' user='username' password='password'")
cursor = connection.cursor ()
cursor.execute (sql, {"p_address": form["address"].value})
list = []
for record in cursor:
    data = dict (zip (["uprn", "address", "easting", "northing"], record))
    list.append (data)
print "Content-Type: application/json\n"
print json.dumps (list, indent = 4)
In the lsg_pg.py file the SQL query selects the records from the view and converts the line geometry to a centroid point.
#!D:/Python27/python.exe
# -*- coding: UTF-8 -*-
import cgi
import json
import psycopg2
sql = """select a.uprn, a.address, ST_X(ST_Centroid(a.geometry)), ST_Y(ST_Centroid(a.geometry))
from angusdata.search_lsg_streets a
where a.address ilike '%%' || (%(p_address)s) || '%%'
order by address"""
form = cgi.FieldStorage ()
connection = psycopg2.connect ("host='10.12.345.678' port='5432' dbname='postgisdb' user='username' password='password'")
cursor = connection.cursor ()
cursor.execute (sql, {"p_address": form["address"].value})
list = []
for record in cursor:
    data = dict (zip (["uprn", "address", "easting", "northing"], record))
    list.append (data)
print "Content-Type: application/json\n"
print json.dumps (list, indent = 4)
In the postcodes_pg.py file the SQL query turns the polygon geometry into a point geometry using the PostGIS ST_PointOnSurface function. The psycopg2 parameters have been tweaked to use the postcode tables fields.
#!D:/Python27/python.exe
# -*- coding: UTF-8 -*-
import cgi
import json
import psycopg2
sql = """select a.postcode, ST_X(ST_Pointonsurface(a.geometry)), ST_Y(ST_Pointonsurface(a.geometry))
from thirdparty.os_codepointpoly a
where a.postcode ilike '%%' || (%(p_postcode)s) || '%%'
order by postcode"""
form = cgi.FieldStorage ()
connection = psycopg2.connect ("host='10.12.345.678' port='5432' dbname='postgisdb' user='username' password='password'")
cursor = connection.cursor ()
cursor.execute (sql, {"p_postcode": form["postcode"].value})
list = []
for record in cursor:
    data = dict (zip (["postcode", "easting", "northing"], record))
    list.append (data)
print "Content-Type: application/json\n"
print json.dumps (list, indent = 4)
Make sure the #!shebang at the top of the python script has the correct path to your Python installation.
Check the Apache2 log files if there are any errors.
Right, we have QGIS installed with the gazetteer search plugin configured to use the new gazetteers. The PostGIS tables and views are presenting the data in format required by the web services. The Apache2 server is configure to allow access and the python scripts are in the cgi-bin. Fire up QGIS, refresh the plugin and enter a search term and hit GO! Awesome! Mine works, at least.
None of this would have been possible without the UK QGIS group and the input from Matt, Kevin and Simon. Big thanks to Matt Walker and Jo Cook for recent updates to the plugin. Use the comments to tell us how to do it better.

Video: how to create maps with webservices of the Dutch PDOK infrastructure in QGis throught the PDOK Plugin
On Eenvoudige PDOK services plugin voor QGIS (in Dutch) Richard already described how to use the PDOK plugin to connect to webservices of the Dutch PDOK infrastructure. This infrastructure offers nationwide and publicly available WMS, WFS and some tiling services of Dutch governments. This video http://www.youtube.com/watch?v=NjLG4KtpdYk shows how to use the plugin to create a [...]
3 Reasons to Move Your QGIS Plugins to the New Repository
- Since the release of QGIS 1.8, Plugin Installer no longer includes the “add 3rd party repositories” button. This was an intentional design choice!
- The new official plugin repository at plugins.qgis.org keeps everything in one place making it easier for users to find documentation and report issues. It will also provide many long-wanted features such as a rating system for plugins. You can already sort by number of downloads to discover the most popular plugins.
- Last but not least: New users will not be able to discover your plugin if it is not in the repository.
Go ahead to plugins.qgis.org and upload your plugin now!


A new QGIS plugin: Python Script Runner
Gary Sherman has just published a new Python plugin for QGIS that I think people will find very handy, I know I will. The plugin allows you to run Python scripts inside QGIS for tasks that don’t really require, or warrant, a whole plugin.
Go check out Gray’s post about the new plugin at http://spatialgalaxy.net/2012/01/29/script-runner-a-plugin-to-run-python-scripts-in-qgis/
The new plugin can be installed via the Plugin Installer using the “runner” or “script”. The Plugin Installer is another one of my favorite plugins for QGIS, being able to push out a new plugin and know that everyone can get it is a good feeling :)
Filed under: Open Source, qgis Tagged: FOSSGIS, gis, Open Source, osgeo, plugin, python, qgis, Quantum GIS


Easy Rectangles, Circles and Ellipses in QGIS
“Rectangles ovals digitizing” plugin by Pavol Kapusta adds editing tools that make it really easy to create rectangles, squares, circles and ellipses. These are the tools provided by the new plugin:

Tools in "Rectangles ovals digitizing"
Give it a try!


Fast SQL Layer for QGIS
For everyone working with spatial databases in QGIS there comes a time when “Add PostGIS/SpatiaLite Layer” and “RT Sql Layer” start to be annoying. You always have to retype or copy-paste your SQL queries into the user interface if you need to change the tiniest thing in the layer’s definition.
This is where “Fast SQL Layer” can be a real time saver. Fast SQL Layer is a new plugin for QGIS by Pablo T. Carreira. It basically adds an SQL console for loading layers from PostGIS/SpatiaLite into QGIS. And it even comes with syntax highlighting!
Installation
Fast SQL Layer comes with one dependency: Pygments, which is used for syntax highlighting.
On Ubuntu, all you have to do is install it with apt-get:
sudo apt-get install python-pygments
For Windows with OSGeo4W, @Mike_Toews posted this on gis.stackexchange:
I downloaded and extracted Pygments-1.4.tar.gz, then in an OSGeo4W shell within the Pygments-1.4 directory, type python setup.py build then python setup.py install
Usage
When you activate the plugin in plugin manager, a dock widget will appear which contains the console and some fields for specifying the database connection that should be used. Then, you can simply write your SQL query and load the results with one click.

Fast SQL plugin
In this example, I renamed “gid” to “id”, but you can actually edit the values in the drop down boxes to adjust the column names for id and geometry:

A second layer loaded using Fast SQL plugin
It certainly needs some polishing on the user interface side but I really like it.


OpenLayers plugin visits code sprint
A short visit and 7 hours train ride to the OpenLayers code sprint mainly for a presentation at the Swiss MapFish user group meeting in Lausanne, resulted in a new release of the QGIS OpenLayers plugin. The OpenLayers plugin adds WebKit based layers to QGIS and ships with OpenStreetMap-, Google- and Yahoo-Layers.
Changes in this release:
- Update to OpenLayers trunk
- Google Layers using API V3 (no API key necessary)
- Code refactoring for adding new layer types with one line of code (and some HTML…)
The next planned step is integrating this plugin with the very nice Openlayers Overview plugin from Luiz Motta.
Information for adding your own layers and a bug tracker is now available at hub.qgis.org/projects/openlayers
How to Sort a Shapefile by Attributes
If you ever need to sort the entries in a shapefile by one of its attributes, you might be happy to learn that somebody already did all the work for you and wrote a plugin for QGIS that can perform such sorting tasks: MMQGIS Sort plugin by Michael Minn

MMQGIS Sort plugin


Testing UMN Mapfiles with QGIS
The Sunday night session of the QGIS hackfest resulted in a new release of the Mapfile Tools plugin.
This QGIS plugin allows you to display an UMN Mapserver mapfile in QGIS without running a Mapserver instance. It depends only on Mapscript (apt-get install python-mapscript on Debian/Ubuntu) and allows you to zoom and pan on the mapfile layer.
In release 0.6, an output window has been added, which shows error messages and detailed layer information. This makes it a convenient tool to test your mapfiles.
