Related Plugins and Tags

QGIS Planet

Folium vs. hvplot for interactive maps of Point GeoDataFrames

In the previous post, I showed how Folium can be used to create interactive maps of GeoPandas GeoDataFrames. Today’s post continues this theme. Specifically, it compares Folium to another dataviz library called hvplot. hvplot also recently added support for GeoDataFrames, so it’s interesting to see how these different solutions compare.

Minimum viable

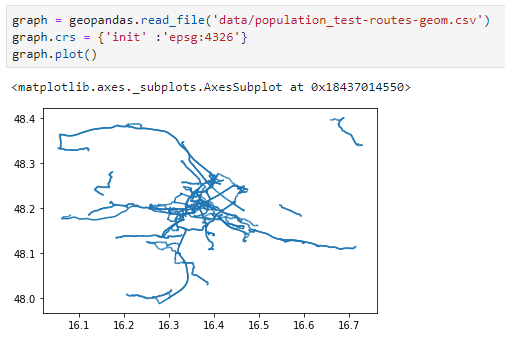
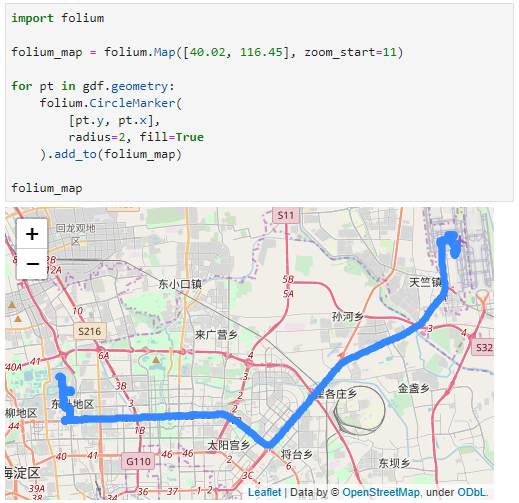
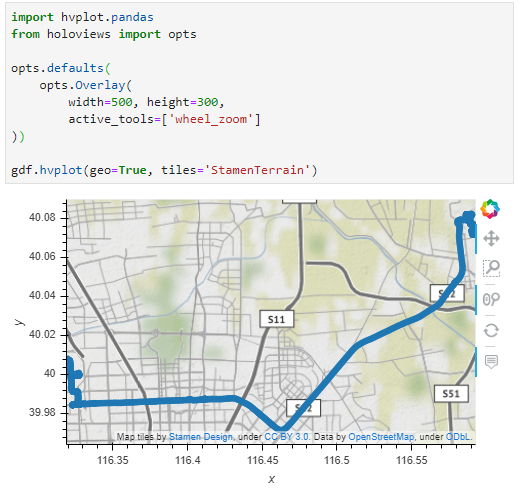
The following snippets show the minimum code I found to put a GeoDataFrame of Points onto a map with either Folium or hvplot.

Folium does not automatically zoom to the data extent and I didn’t find a way to add the whole GeoDataFrame of Points without looping through the rows individually:

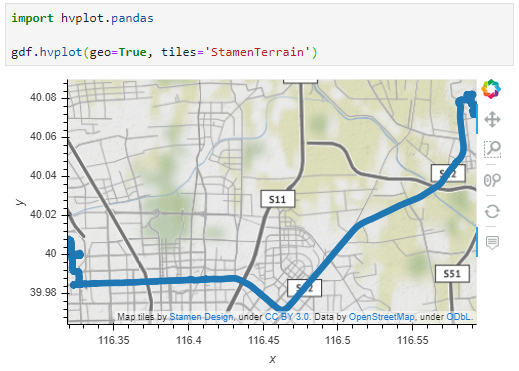
Hvplot on the other hand registers the hvplot function directly with the GeoDataFrame. This makes it as convenient to use as the original GeoPandas plot function. It also zooms to the data extent:

Standard interaction and zoom to area of interest

The following snippets ensure that the map is set to a useful extent and the map tools enable panning and zooming.

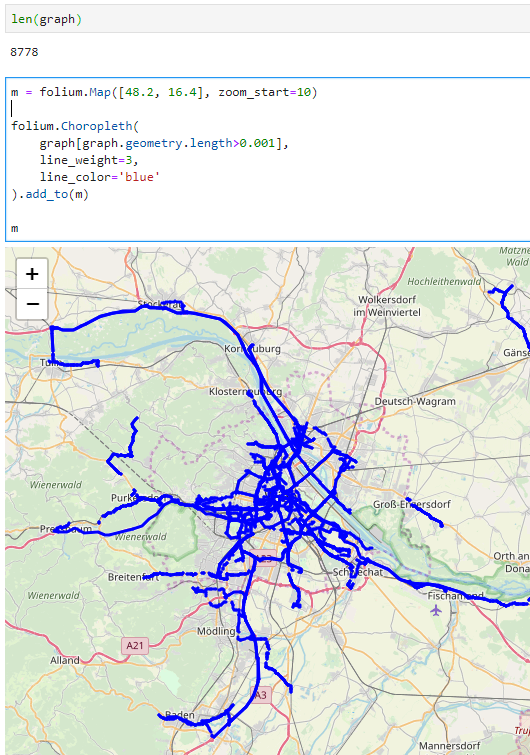
With Folium, we have to set the map center and the zoom. The map tools are Leaflet defaults, so panning and zooming work as expected:

Since hvplot does not come with mouse wheel zoom enabled by default, we need to set that:

Color by attribute

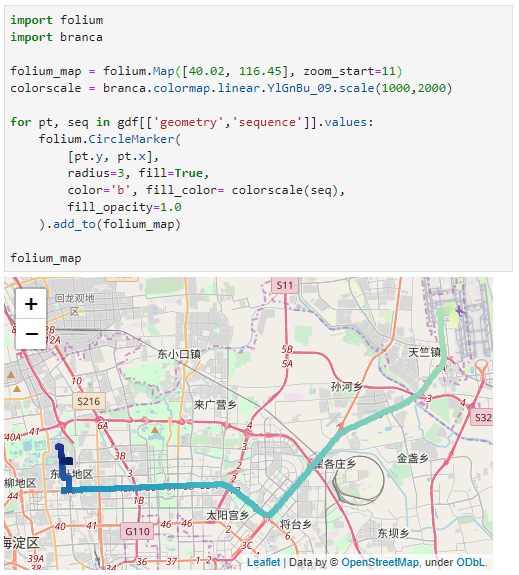
Finally, for many maps, we want to show the point location as well as an attribute value.

To create a continuous color ramp for a numeric value, we can use branca.colormap to define the marker fill color:

In hvplot, it is sufficient to specify the attribute of interest:

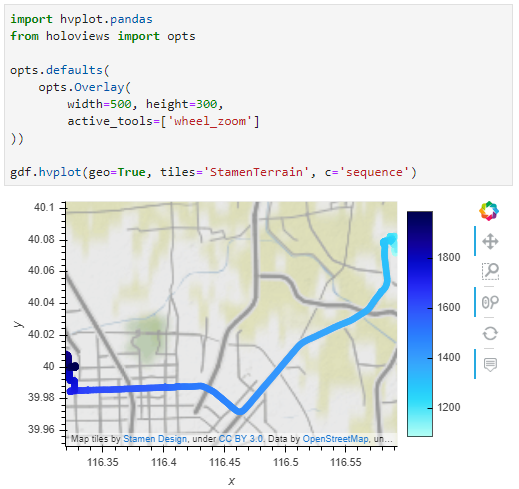
I’m pretty impressed with hvplot. The integration with GeoPandas is very smooth. Just don’t forget to set the geo=True parameter if you want to plot lat/lon geometries.

Folium seems less straightforward for this use case. Maybe I missed some option similar to the Choropleth function that I showed in the previous post.

Interactive plots for GeoPandas GeoDataFrames of LineStrings

GeoPandas makes it easy to create basic visualizations of GeoDataFrames:

However, if we want interactive plots, we need additional libraries. Folium (which is built on Leaflet) is a great option. However, all examples for plotting GeoDataFrames that I found focused on point or polygon data. So here is what I found to work for GeoDataFrames of LineStrings:

First, some imports:

import pandas as pd
import geopandas
import folium

Loading the data:

graph = geopandas.read_file('data/population_test-routes-geom.csv')
graph.crs = {'init' :'epsg:4326'}

Creating the map using folium.Choropleth:

m = folium.Map([48.2, 16.4], zoom_start=10)

folium.Choropleth(
    graph[graph.geometry.length>0.001],
    line_weight=3,
    line_color='blue'
).add_to(m)

m

I also tried using folium.PolyLine which seemed like the more obvious choice but does not seem to accept GeoDataFrames as input. Instead, it expects a list of coordinate pairs and of course it expects them to be in the opposite order that Shapely.LineString.coords provides … Oh the joys of geodata!

In any case, I had to limit the number of features that get plotted because Folium refuses to plot all 8778 features at once. I decided to filter by line length because drawing really short lines is pointless for my overview visualization anyway.

Quick webmaps with qgis2web

In Publishing interactive web maps using QGIS, I presented two plugins for exporting web maps from QGIS. Today, I want to add an new member to this family: the qgis2web plugin is the successor of qgis-ol3 and combines exports to both OpenLayers3 as well as Leaflet.

The plugin is under active development and currently not all features are supported for both OpenLayers3 and Leaflet, but it’s a very convenient way to kick-off a quick webmapping project.

Here’s an example of an OpenLayers3 preview with enabled popups:

OpenLayers3 preview

OpenLayers3 preview

And here is the same map in Leaflet with the added bonus of a nice address search bar which can be added automatically as well:

Leaflet preview

Leaflet preview

The workflow is really straight forward: select the desired layers and popup settings, pick some appearance extras, and then don’t forget to hit the Update preview button otherwise you might be wondering why nothing happens ;)

I’ll continue testing these plugins and am looking forward to seeing what features the future will bring.


Publishing interactive web maps using QGIS

We all know that QGIS is great for designing maps but did you know that QGIS is also great for interactive web maps? It is! Just check out qgis2leaf and qgis2threejs.

To give these two plugins a test run and learn some responsive web design, I developed a small concept page presenting cycle routes in 3D.

Screenshot 2015-01-31 22.20.15

Qgis2leaf makes it possible to generate Leaflet maps from QGIS layers. It provides access to different background maps and it’s easy to replace them in the final HTML file in case you need something more exotic. I also added another layer with custom popups with images but that was done manually.

Daten CC-BY-3.0: Land Kärnten - data.ktn.gv.at

The web maps use data CC-BY-3.0: Land Kärnten – data.ktn.gv.at

Qgis2threejs on the other hand creates 3D visualizations based on three.js which uses WebGL. (If you follow my blog you might remember a post a while back which showcased Qgis2threejs rendering OSM buildings.)

This is a great way to explore elevation data. I also think that the labeling capabilities add an interesting touch. Controlling the 3D environment takes some getting used to, but if you can handle Google Earth in your browser, this is no different.

Image of Heiligenblut by Angie (Self-photographed) (GFDL (http://www.gnu.org/copyleft/fdl.html) or CC BY 3.0 (http://creativecommons.org/licenses/by/3.0)), via Wikimedia Commons

Image of Heiligenblut by Angie (Self-photographed) (GFDL (http://www.gnu.org/copyleft/fdl.html) or CC BY 3.0 (http://creativecommons.org/licenses/by/3.0)), via Wikimedia Commons


Mapping Hubway Station Stats

Today, I’ve been working on some station statistics. From the trip data, I calculated incoming and outgoing trips per station as well as the station’s first day of operations. Combining this information makes it possible to calculate the average day’s “bike balance”. A balanced station has the same number of incoming and outgoing trips while an unbalanced station will either run out of bikes or empty slots for returns.

I’ve published the resulting station map on QGIS Cloud (http://qgiscloud.com/anitagraser/hubway_cloud1) where you can have a look at the bike balance values.

Additionally, I’ve created a mashup in Leaflet pulling together background tiles from Stamen and the cloud-hosted WMS for better orientation:


Leaflet, Stamen Toner and QGIS Server – An Intro

Today’s post is a note-to-self on how to set up a really quick little Leaflet web map with Stamen’s “Toner” background and a WMS overlay served by QGIS Server.

Note the use of the map parameter when creating the QGIS Server WMS layer.

<!DOCTYPE html PUBLIC "-//W3C//DTD XHTML 1.0 Strict//EN" "http://www.w3.org/TR/xhtml1/DTD/xhtml1-strict.dtd">
<html xmlns="http://www.w3.org/1999/xhtml" xml:lang="en" lang="en">
<head>

<meta http-equiv="content-type" content="text/html; charset=utf-8" />
<meta http-equiv="content-language" content="en" />

<title>Leaflet, Stamen Toner and QGIS Server</title>

<link rel="stylesheet" href="http://leaflet.cloudmade.com/dist/leaflet.css" />
<link rel="stylesheet" href="my.css" type="text/css" />
 <!--[if lte IE 8]><link rel="stylesheet" href="http://leaflet.cloudmade.com/dist/leaflet.ie.css" /><![endif]-->

<script type="text/javascript" src="http://leaflet.cloudmade.com/dist/leaflet.js"></script>
<script type="text/javascript" src="http://maps.stamen.com/js/tile.stamen.js?v1.1.3"></script>
<script type="text/javascript">
function initialize() {
	var stamen = new L.StamenTileLayer("toner-lite");
	
	var myLayer = new L.TileLayer.WMS("http://10.101.21.28/cgi-bin/qgis_mapserv.fcgi", {
		map: "/usr/lib/cgi-bin/test/test.qgs",
		layers: 'mylayer',
		format: 'image/png',
		transparent: 'TRUE',
	});
	
	var map = new L.Map("map", {
		center: new L.LatLng(48.2,16.4),
		zoom: 13,
 		minZoom: 10,
 		maxZoom: 18,
		layers: [stamen,myLayer],
	});
}
</script>

</head>

<body onload="initialize()">
    <div id="map" class="map"></div>
</body>

</html>

With this my.css, the map will be displayed in “full screen”.

  div.map{
    display:block;
    position:absolute;
    top:0;
    left:0;
    width:100%;
    height:100%;
  }

Update

You can test an extended live example at http://anitagraser.github.com/Webmapping-Sandbox/leaflet.html


  • Page 1 of 1 ( 6 posts )
  • leaflet

Back to Top

Sustaining Members