QGIS Planet

New point clouds and mesh features in QGIS 3.36

QGIS 3.36 is round the corner and as usual, there will be several new exciting features with the new release. Below is the list of features our team has added to the new release. This was made possible by generous funding from clients.

Render point clouds as a surface in 2D map views

Point clouds are rendered as individual points by default. Depending on the zoom level and density of the points, you might not be able to get a full picture of the map.

Rendering points as surface enables you to have a better understanding of the data before trying to do any analysis or processing. This has been possible in 3D map views for a couple of QGIS releases, now we have added the functionality also in 2D map views.

The feature generates a surface using triangulation on-the-fly from the points using the same symbology. Below you can see the difference between a point cloud rendered as individual points and rendered as a surface:

Point clouds as surface

Point clouds as individual points vs. as a TIN surface

The good news is that rendering as a surface also works well with global map shading, allowing users to get a nice hillshade:

Point clouds as surface with hillshade with hillshade

Point clouds as surface with hillshade

To enable this feature, you need to check the option for Render as a Surface (Triangulate) under the Layer Styling panel.

Point clouds styling panel

Settings to display point clouds as surface

Pro-tip: if the on-the-fly rendering as a surface takes too long to render, try increasing the Maximum error: for example 0.6 mm instead of the default 0.3 mm.

Flexible styling of classes

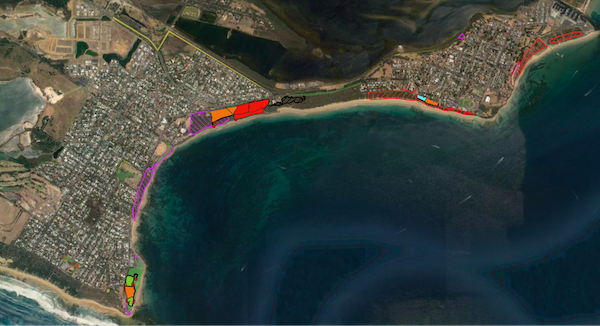
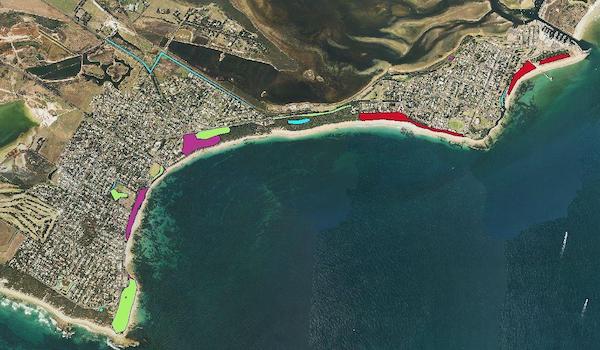
Previously, point cloud data visualisation in QGIS was limited to rendering all points with a uniform size and opacity. This made it difficult to differentiate between different point classes and highlight specific features of interest. To address this issue, we have introduced a new feature that allows users to customise the point size and opacity for each point cloud data class. This provides a flexible way for visualising point cloud data, allowing users to highlight specific point classes, e.g. by increasing the point size.

Assigning size and opacity to each point cloud class

Assigning size and opacity to each point cloud class

Point clouds with different sizes and opacity levels

Point clouds with different sizes and opacity levels

Set 3D map view extent in 2D map

Effectively navigating and visualising large-scale 3D datasets can be challenging on PCs with limited resources. To address this issue, we introduced a new feature that allows users to interactively limit the 3D scene, enabling them to focus on specific areas of interest. This new feature, conveniently accessible from the toolbar, eliminates the need for tedious manual entry of coordinates for bounding boxes. Instead, users can simply drag and draw a box around the desired area, instantly restricting the 3D scene to that specific extent. This interactive approach significantly enhances the user experience and streamlines the process of exploring and analysing 3D data:

Interactive selection of 3D map scene from 2D map

Interactive selection of 3D map scene from 2D map

Python API for 3D views

Creating and viewing 3D maps in QGIS with the correct camera location and angle, scene tilt, light, and other parameters can be a time-consuming and error-prone process. This is because it requires users to manually adjust these settings, often through trial and error. However, with the introduction of the new 3D map view API in QGIS, Python plugins can now automate this process, making it much easier, consistent and more efficient to create high-quality 3D maps that are visually appealing and informative.

# List all open 3D map canvases
iface.mapCanvases3D()
# [<qgis._3d.Qgs3DMapCanvas object at 0x7f23491b5e10>]
canvas = iface.mapCanvases3D()[0]

Now let’s try something more complicated:

# Let's change some settings!
ms = canvas.mapSettings()
ms.setEyeDomeLightingEnabled(True)
ms.setBackgroundColor(QColor('beige'))
ms.setTerrainMapTheme('dtm')
ms.setFieldOfView(110)

# Move the camera to look at specific map coordinates in layer's CRS
cam = canvas.cameraController()
mapPoint = QgsVector3D(-498175.92, -1205400.58, 210)
worldPoint = ms.mapToWorldCoordinates(mapPoint)
cam.setLookingAtPoint(worldPoint, 60, 45, 100)

# Create four new 3D map views
c1 = iface.createNewMapCanvas3D('South View')
c2 = iface.createNewMapCanvas3D('West View')
c3 = iface.createNewMapCanvas3D('North View')
c4 = iface.createNewMapCanvas3D('East View')

# Apply settings to all open 3D map views
for canvas in iface.mapCanvases3D():
	canvas.mapSettings().setEyeDomeLightingEnabled(True)

# Define a camera pose to update the views' cameras
pose = QgsCameraPose()
pose.setCenterPoint(QgsVector3D(0, 210, 0))  # This is in 3D world coordinates
pose.setDistanceFromCenterPoint(100)
pose.setPitchAngle(75)  # Tilt the camera by 75 degrees
pose.setHeadingAngle(0)  # Looking towards North
c1.cameraController().setCameraPose(pose)
pose.setHeadingAngle(90)  # Towards East
c2.cameraController().setCameraPose(pose)
pose.setHeadingAngle(180)  # Towards South
c3.cameraController().setCameraPose(pose)
pose.setHeadingAngle(270)  # Towards West
c4.cameraController().setCameraPose(pose)

# We can set the 3D map views 2D extent to always match the main 2D canvas one
# Our 3D views get updated while zooming/panning the main 2D canvas
canvas = iface.mapCanvas()
canvas.extentsChanged.connect(lambda :c1.mapSettings().setExtent(canvas.extent()))
canvas.extentsChanged.connect(lambda :c2.mapSettings().setExtent(canvas.extent()))
canvas.extentsChanged.connect(lambda :c3.mapSettings().setExtent(canvas.extent()))
canvas.extentsChanged.connect(lambda :c4.mapSettings().setExtent(canvas.extent()))

Changing 3D view settings through Python

Changing 3D view settings through Python

More point clouds attributes

LAS/LAZ/COPC point clouds have a classificationFlags attribute that stores four types of information (Synthetic, Keypoint, Withheld, and Overlap) in a single value. This saves space, but it makes it difficult to use the information for styling or filtering, as you need to write complex expressions.

To make it easier to use, we are following the approach introduced in PDAL 2.6: the classificationFlags attribute gets replaced with four separate attributes: Synthetic, Keypoint, Withheld, and Overlap. This will make it easier to include these attributes in styling and filtering expressions.

Performance enhancement for rendering

To improve the performance of point cloud rendering in QGIS, we introduced a new caching system to minimise the need for repeated decompression of LAS node data while panning or zooming. This caching mechanism efficiently stores decompressed points for each unique combination of layer URI, node, requested attributes, filter extent, and filter expression. This enables rapid rendering of previously cached nodes, significantly enhancing the overall rendering performance in 2D and 3D maps.

Performance can vary depending on actual data, but on a local sample COPC file, it renders 7 times faster with this change.

Labels for mesh layer

Viewing mesh data has been possible through styling, plotting or using the Identify tool. But now you can also create labels on mesh surfaces or vertices similar to vector layers.

To display labels for your mesh data, simply open the styling panel and enable labels for:

  • Labels on Vertices
  • Labels on Surfaces

Label settings for mesh layers

Label settings for mesh layers

Below is an example of mesh Z values at vertices (yellow) and mesh areas at cell centre (purple):

Example of labels on a mesh layer

Example of labels on a mesh layer

Want more changes in QGIS?

Do you want to see more improvements and new features in QGIS? Do not hesitate to contact us to discuss your requiremnets.

3D Tiles in QGIS

Earlier this year, in collaboration with North Road we were awarded a grant from Cesium to introduce 3D tiles support in QGIS. The feature was developed successfully and shipped with QGIS 3.34.

In this blog post, you can read more about how to work with this feature, where to get data and how to display your maps in 2D and 3D. For a video demo of this feature, you can watch Nyall Dawson’s presentation on Youtube.

What are 3D tiles?

3D tiles are a specification for streaming and rendering large-scale 3D geospatial datasets. They use a hierarchical structure to efficiently manage and display 3D content, optimising performance by dynamically loading appropriate levels of detail. This technology is widely used in urban planning, architecture, simulation, gaming, and virtual reality, providing a standardised and interoperable solution for visualising complex geographical data.

Examples of 3D tiles:

3D tiles of Zurich from Swisstopo

Data from Swisstopo (https://map.geo.admin.ch/)

Washington - 3D Surface Model (Vricon, Cesium)

Washington - 3D Surface Model (Vricon, Cesium)

3D tiles in QGIS

To be able to use 3D tiles in QGIS, you need to have QGIS 3.34 or later. You can add a new connection to a 3D tile service from within the Data Source Manager under Scene:

Adding a new 3D tile service from Data Source Manager in QGIS

Adding a new 3D tile service from Data Source Manager in QGIS

Alternatively, you can add the service from your Browser Panel:

3D tiles data provider in the Browser panel

3D tiles data provider in the Browser panel

To test the feature, you can use the following 3D tiles service:


Name: 3D Tiles example
URL: https://pelican-public.s3.amazonaws.com/3dtiles/agi-hq/tileset.json

Creating a new connection to a 3D tiles service

Creating a new connection to a 3D tiles service

You can then add the map from the newly generated connection to QGIS:

Adding a new 3D tiles to QGIS

Adding a new 3D tiles to QGIS

By default, the layer is styled using texture, but you can change it to see the wireframe mesh behind the scene:

3D tiles’ mesh wireframe

3D tiles’ mesh wireframe

You can change the mesh fill and line symbols similar to the vector polygons. Alternatively, you can use texture colors. This will render each mesh element with the average value of the full texture. This is ideal when dealing with a large dataset and want to get a quick overview of the data:

3D tiles with texture color for meshes

3D tiles with texture color for meshes

To view the data in 3D, you can open a new 3D map. Similar to 2D map, by zooming in/out, finer resolution tiles will be fetched and displayed:

Using data from Cesium ion

Cesium ion is a cloud-based platform for managing and streaming 3D geospatial data. It simplifies data management, visualisation, and sharing.

To add 3D tiles from Cesium ion, you need to first sign up to their service here: https://ion.cesium.com/tokens

Under Asset Depot, you will see a catalogue of publicly available datasets. You can also upload your own 3D models (such as OBJ or PLY), georeference them and get them converted to 3D tiles.

You can also add one of the existing tile service under https://ion.cesium.com/assetdepot and select the tile service and then click on Add to my assets:

Adding an existing dataset to your Cesium ion assets

Adding an existing dataset to your Cesium ion assets

You can use the excellent Cesium ion plugin by North Road from the QGIS repository to add the data to QGIS:

Adding Cesium ion assets to QGIS

Adding Cesium ion assets to QGIS

Working with Google 3D data

In addition to accessing Google Photorealistic 3D tiles from Cesium ion, you can also add the tiles directly in QGIS. First you will need to follow the instructions below and obtain API keys for 3D tiles: https://developers.google.com/maps/documentation/tile/cloud-setup

During the registration process, you will be asked to add your credit card details. Currently (November 2023), they do not charge you for using the service.

Once you have obtained the API key, you can add Google tiles using the following connection details:

Adding Google 3D tiles in QGIS

Adding Google Photorealistic tiles in QGIS

Notes and remarks

  • Adjusting map extents for large scenes

When dealing with large scenes, map extents should be set to a smaller area to be able to view it in 3D. This is the current limitation of QGIS 3D maps as it cannot handle scenes larger than 500 x 500 km.

To change the map extent, you can open Project Properties and under View Settings change the extent. In the example below, the map extent has been limited only to a part of London, so we can view Google Photorealistic tiles in the 3D map without rendering issues.

Limiting project extent in QGIS

Limiting project extent in QGIS

3D tiles from Google in QGIS

3D tiles from Google in QGIS
  • Network cache size

If you are handling a large dataset, it is recommended to increase network cache size to 1 GB or more. The default value in QGIS is much lower and it results in slower rendering of the data.

Increasing Cache size in QGIS for faster rendering

Increasing Cache size in QGIS for faster rendering
  • Overlaying other 3D data

When you try to overlay other data sets on top of a global 3D tiles, the vertical datum might not match and hence you will see the data in the wrong place in a 3D map. To fix the issue, you may need to use elevation offsetting to shift the data along the Z axis under Layer Properties:

Offsetting elevation of a layer in QGIS

Offsetting elevation of a layer in QGIS

Future works

This is the first implementation of the 3D tiles in QGIS. For the future, we would like to add more features for handling and creation of the 3D tiles. Our wishlist in no particular order is:

  • Globe view: QGIS 3D cannot handle large scenes or unprojected views.
  • More advanced styling of meshes: as an example, users will be able to create their own style.
  • 3D In-door navigation: as an example users will be able to navigate inside buildings and potentially it will bring BIM data closer to QGIS
  • Generation of 3D tiles inside QGIS: adding a processing tool in QGIS to generate 3D Tiles from your map data.

Styling of 3D tiles

Styling of 3D tiles (image from https://cesium.com/learn/ion/stories-styling/)

If you would like to see those features in QGIS and want to fund the efforts, do not hesitate to contact us.

Webinar: Processing LiDAR data in QGIS 3.32

Join this webinar to learn more about the new features in QGIS to process LiDAR data:

Date: Monday, June 26, 2023 at 14:00 GMT

Duration: 30 minutes + 15 minutes Q&A session

Speaker: Martin Dobias, CTO at Lutra Consulting with more than 15 years of QGIS development experience

Martin Dobias

Description

Point clouds are an increasingly popular data type thanks to the decreasing cost of their acquisition through lidar surveys and photogrammetry. On top of that, more and more national mapping agencies release high resolution point cloud data (spanning large areas and consisting of billions of points), unlocking many new use cases.

This webinar will summarize the latest QGIS release 3.32 and the addition of tools for point cloud analysis right from QGIS Processing toolbox: clip, filter, merge, export to raster, extract boundaries and more - all backed by PDAL library that already ships with QGIS, without having to rely on third party proprietary software.

This work was made possible by the generous donations to our crowdfunding.

Live on Monday, June 26, 2023 at 14:00 GMT

Add it to your calendar!

Virtual Point Clouds (VPC)

As a part of our crowdfunding campaign we have introduced a new method to handle a large number of point cloud files. In this article, we delve into the technical details of the new format, rationale behind our choice and how you can create, view and process virtual point cloud files.

Rationale

Lidar surveys of larger areas are often multi-terabyte datasets with many billions of points. Having such large datasets represented as a single point cloud file is not practical due to the difficulties of storage, transfer, display and analysis. Point cloud data are therefore typically stored and distributed split into square tiles (e.g. 1km x 1km), each tile having a more manageable file size (e.g. ~200 MB when compressed).

Tiling of data solves the problems with size of data, but it introduces issues when processing or viewing an area of interest that does not fit entirely into a single tile. Users need to develop workflows that take into account multiple tiles and special care needs to be taken to deal with data near edges of tiles to avoid unwanted artefacts in outputs. Similarly, when viewing point cloud data, it becomes cumbersome to load many individual files and apply the same symbology.

Here is an example of several point cloud tiles loaded in QGIS. Each tile is styled based on min/max Z values of the tile, creating visible artefacts on tile edges. The styling has to be adjusted for each layer separately:

An example of individual point cloud tiles loaded in QGIS, each styled differently

Virtual Point Clouds

In the GIS world, many users are familiar with the concept of virtual rasters. A virtual raster is a file that simply references other raster files with actual data. In this way, GIS software then treats the whole dataset comprising many files as a single raster layer, making the display and analysis of all the rasters listed in the virtual file much easier.

Borrowing the concept of virtual rasters from GDAL, we have introduced a new file format that references other point cloud files - and we started to call it virtual point cloud (VPC). Software supporting virtual point clouds handles the whole tiled dataset as a single data source.

At the core, a virtual point cloud file is a simple JSON file with .vpc extension, containing references to actual data files (e.g. LAS/LAZ or COPC files) and additional metadata extracted from the files. Even though it is possible to write VPC files by hand, it is strongly recommended to create them using an automated tool as described later in this post.

On a more technical level, a virtual point cloud file is based on the increasingly popular STAC specification (the whole file is a STAC API ItemCollection). For more details, please refer to the VPC specification that also contains best practices and optional extensions (such as overviews).

Virtual Point Clouds in QGIS

We have added support for virtual point clouds in QGIS 3.32 (released in June 2023) thanks to the many organisations and individuals who contributed to our last year’s joint crowdfunding with North Road and Hobu. The support in QGIS consists of three parts:

  1. Create virtual point clouds from a list of individual files
  2. Load virtual point clouds as a single map layer
  3. Run processing algorithms using virtual point clouds

Those who prefer using command line tools, PDAL wrench includes a build_vpc command to create virtual point clouds, and all the other PDAL wrench commands support virtual point clouds as the input.

Using Virtual Point Clouds

In this tutorial, we are going to generate a VPC using the new Processing algorithm, load it in QGIS and then generate a DTM from terrain class. You will need QGIS 3.32 or later for this. For the purpose of this example, we are using the LiDAR data provided by the IGN France data hub.

In QGIS, open the Processing toolbox panel, search for the Build virtual point cloud (VPC) algorithm ((located in the Point cloud data management group):

VPC in the Processing toolbox

VPC algorithm in the Processing toolbox

In the algorithm’s window, you can add point cloud layers already loaded in QGIS or alternatively point it to a folder containing your LAZ/LAS files. It is recommended to also check the optional parameters:

  • Calculate boundary polygons - QGIS will be able to show the exact boundaries of data (rather than just rectangular extent)

  • Calculate statistics - will help QGIS to understand ranges of values of various attributes

  • Build overview point cloud - will also generate a single “thinned” point cloud of all your input data (using only every 1000th point from original data). The overview point cloud will be created next to the VPC file - for example, for mydata.vpc, the overview point cloud would be named mydata-overview.copc.laz

VPC algorithm inputs, outputs and options

VPC algorithm inputs, outputs and options

After you set the output file and start the process, you should end up with a single VPC file referencing all your data. If you leave the optional parameters unchecked, the VPC file will be built very quickly as the algorithm will only read metadata of input files. With any of the optional parameters set, the algorithm will read all points which can take some time.

Now you can load the VPC file in QGIS as any other layer - using QGIS browser, Data sources dialog in QGIS or by doing drag&drop from a file browser. After loading a VPC in QGIS, the 2D canvas will show boundaries of individual files - and as you zoom in, the actual point cloud data will be shown. Here, a VPC loaded together with the overview point cloud:

VPC algorithm output

Virtual point cloud (thinned version) generated by the VPC algorithm

Zooming in QGIS in 2D map with elevation shading - initially showing just the overview point, later replaced by the actual dense point cloud:

VPC algorithm output in 2D maps

VPC output on 2D: displaying details when zooming in

In addition to 2D maps, you can view the VPC in a 3D map windows too:

If the input files for VPCs are not COPC files, QGIS will currently only show their boundaries in 2D and 3D views, but processing algorithms will work fine. It is however possible to use the Create COPC algorithm to batch convert LAS/LAZ files to COPC files, and then load VPC with COPC files.

It is also worth noting that VPCs also work with input data that is not tiled - for example, in some cases the data are distributed as flightlines (with lots of overlaps between files). While this is handled fine by QGIS, for the best performance it is generally recommended to first tile such datasets (using the Tile algorithm) before doing further display and analysis.

Processing Data with Virtual Point Clouds

Now that we have the VPC generated, we can run other processing algorithms. For this example, we are going to convert the ground class of the point cloud to a digital terrain model (DTM) raster. In the QGIS Processing toolbox, search for Export to raster algorithm (in the Point cloud conversion group):

VPC as an input to processing algorithms

VPC layer can be used as an input to the point cloud processing algorithm

This will use the Z values from the VPC layer and generate a terrain raster based on a user defined resolution. The algorithm will process the tiles in parallel, taking care of edge artefacts (at the edges, it will read data also from the neighbouring tiles). The output of this algorithm will look like this:

Converting a VPC layer to a raster

Converting a VPC layer to a DTM

The output raster contains holes where there were no points classified as ground. If needed for your use case, you can fill the holes using Fill nodata algorithm from GDAL in the Processing toolbox and create a smooth terrain model for your input Virtual Point Cloud layer:

Filling the holes in the DTM

Filling the holes in the DTM

Virtual point clouds can be used also for any other algorithms in the point cloud processing toolbox. For more information about the newly introduced algorithms, please see our previous blog post.

All of the point cloud algorithms also allow setting filtering extent, so even with a very large VPC, it is possible to run algorithms directly on a small region of interest without having to create temporary point cloud files. Our recommendation is to have input data ready in COPC format, as this format provides more efficient access to data when spatial filtering is used.

Streaming Data from Remote Sources with VPCs

One of the very useful features of VPCs is that they work not only with local files, but they can also reference data hosted on remote HTTP servers. Paired with COPCs, point cloud data can be streamed to QGIS for viewing and/or processing - that means QGIS will only download small portions of data of a virtual point cloud, rather than having to download all data before they could be viewed or analysed.

Using IGN’s lidar data provided as COPC files, we have built a small virtual point cloud ign-chambery.vpc referencing 16 km2 of data (nearly 700 million points). This VPC file can be loaded in QGIS and used for 2D/3D visualisation, elevation profiles and processing, with QGIS handling data requests to the server as necessary. Processing algorithms only take a couple of seconds if the selected area of interest is small (make sure to set the “Cropping extent” parameter of algorithms).

All this greatly simplifies data access to point clouds:

  • Data producers can use very simple infrastructure - a server hosting static COPC files together with a single VPC file referencing those COPC files.

  • Users can use QGIS to view and process point cloud data as a single map layer, with no need to download large amounts of data, QGIS (and PDAL) taking care of streaming data as needed.

We are very excited about the opportunities that virtual point clouds are bringing to users, especially when combined with COPC format and access from remote servers!

Thanks again to all contributors to our crowdfunding campaign - without their generous support, this work would not have been possible.

Contact us if you would like to add more features in QGIS to handle, analyse or visualise lidar data.

Native point cloud processing in QGIS

After the addition of support for visualising point clouds in the recent versions of QGIS, the next step was to add the processing tools so users can manage and analyse their data.

There are several 3rd party QGIS plugins (either proprietary or not fully open source) which allow users to interrogate and analyse lidar data. But with our latest work, we have introduced powerful point cloud algorithms to the QGIS Processing framework. All the algorithms are available out of the box in QGIS 3.32, with no need to install plugins.

In this blog post, we summarise the initial point cloud algorithms for QGIS Processing toolbox which will be available in QGIS 3.32 (to be released at the end of June 2023). This work was made possible by the generous donations to our crowdfunding.

Point Cloud algorithms in QGIS

First off a quick look at the new algorithms as shown in the Processing toolbox in three groups:

Point Cloud algorithms in QGIS processing toolbox

Point Cloud algorithms in QGIS processing toolbox
  • Convert formats: this will allow you to convert your point cloud data between LAS and LAZ formats for the time being. Other PDAL supported formats can be added later.
  • Export to raster: with this algorithm you can export point cloud to a regularly gridded raster data. It uses inverse distance weighting to assign raster cell values. Raster cells with no nearby points will get “no data” values (these holes may be removed by using “Fill nodata” raster algorithm).

Input point cloud layer file

Input point cloud layer file

Raster output using Intensity attribute of points

Raster output using Intensity attribute of points
  • Export to raster (using triangulation): this allows you to export Z data to a regularly gridded raster by interpolating between the points using triangulation. Note that this can be slower if you are dealing with a large dataset. If your point cloud is dense, you can export your ground points as a raster using the Export to raster algorithm.

Terrain raster output generated by point cloud triangulation

Terrain raster output generated by point cloud triangulation
  • Export to vector: to export point cloud to other vector formats. This is useful to export some of your data for software applications which do not support point cloud data and still use formats such as CSV, Shapefile, DXF.

Exporting point cloud (ground points) to Shapefile styled based on the elevation

Exporting point cloud (ground points) to Shapefile styled based on the elevation!
  • Assign projection: assigns a projection to a point cloud layer (if it is wrong or missing)
  • Build virtual point cloud (VPC): with this algorithm you can generate a virtual file (based on STAC specification) and load them as a single file in QGIS. There will be a separate blog post detailing this new exciting feature.
  • Clip: clip a point cloud layer by a vector polygon layer.

Input point cloud layer and a polygon coverage

Input point cloud layer and a polygon coverage

Result of the clipping algorithm

Result of the clipping algorithm
  • Create COPC: when you load a non-indexed point cloud layer in QGIS, it will take a while for the application to create the COPC index for your file. With this algorithm, you can create the index for all your files in a batch mode.
  • Information: displays information from a point cloud layer:
LAS           1.4
point format  6
count         56736130
scale         0.001 0.001 0.001
offset        431749.999 5440919.999 968.898
extent        431250 5440420 424.266
              432249.999 5441419.999 1513.531
crs           ETRS89 / UTM zone 34N (N-E) (EPSG:3046)  (vertical CRS missing!)
units         horizontal=metre  vertical=unknown

Attributes:
 - X floating 8
 - Y floating 8
 - Z floating 8
 - Intensity unsigned 2
 - ReturnNumber unsigned 1
 - NumberOfReturns unsigned 1
 - ScanDirectionFlag unsigned 1
 - EdgeOfFlightLine unsigned 1
 - Classification unsigned 1
 - ScanAngleRank floating 4
 - UserData unsigned 1
 - PointSourceId unsigned 2
 - GpsTime floating 8
 - ScanChannel unsigned 1
 - ClassFlags unsigned 1

Output from point cloud information algorithm

  • Merge: join multiple point cloud layers into a single file
  • Reproject: reproject the input file to a different coordinate reference system
  • Thin (by sampling radius): reduces the number of points within a certain radius

Thining point cloud (by sampling radius)

Thining point cloud (by sampling radius)
  • Thin (by skipping points): reduces the number of points by skipping nearby points
  • Tile: this algorithm generates a set of tiles based on the input point cloud layer and tile size
  • Boundary: generates a (multi) polygon from your point cloud data. The output file might contain holes depending on the density of your point cloud input data.

Extracting high vegetation and building polygons from an input point cloud layer

Extracting high vegetation and building polygons from an input point cloud layer
  • Density: outputs a raster file based on the number of points within each raster cell - useful for quality checking of point cloud datasets

Point density (number of points per 2x2 m)  as a raster

Point density (number of points per 2x2 m) as a raster
  • Filter: it creates a new file based on the filter set as an expression. Note that most of the algorithms support on-the-fly filtering under the Advanced parameters.

Filtering of high vegetation class from an input point cloud layer

Filtering of high vegetation class from an input point cloud layer

Behind the scenes

All the heavy lifting of the point cloud processing is done by PDAL - a state of the art open source library for processing point clouds. PDAL provides a wide range of “readers”, “filters” and “writers” to build complex pipelines to process point clouds.

We have built a new standalone command line tool pdal_wrench on top of PDAL. It addresses two major issues that non-expert users typically face when working with PDAL:

  • Ease of use: not everyone finds it easy to manually craft JSON files with pipelines, study manuals of the many stages and read details about file formats involved.
  • Parallel execution: PDAL runs pipelines in a single thread, so only one CPU gets to do the work normally and users need to implement their own parallelism if they want to speed up processing.

The command line tool provides a simple set of commands that take care of everything. For example, to export a raster layer with elevations (DEM) with 1 meter resolution:

pdal_wrench to_raster --output=raster.tif --resolution=1 --attribute=Z data.las

The pdal_wrench tool does not depend on QGIS, so it can be easily used separately.

The commands are designed to run in parallel when there are multiple input files or when the input file is in COPC format. Depending on the algorithm, the work gets split spatially into square tiles (1000x1000 map units by default) for parallel processing, or individual files are processed in parallel. With a single ordinary LAS/LAZ file on input, there is currently no parallelism going on.

For commands that are sensitive to edge artifacts (such as export to raster), we take care of processing extra points outside of the extent of each tile (referred to as collar or buffer) to make sure the results are correct as if no tiling would be happening (see Martin Isenburg’s article for more details: https://rapidlasso.com/2015/08/07/use-buffers-when-processing-lidar-in-tiles/).

Future work

The current list of point cloud algorithms already allows users to do plenty of work. But more could be added to the toolbox - algorithms that are already supported by PDAL, but not exposed in QGIS: classification, noise removal, surface reconstruction, clustering, height above ground, colorizing and many more. If you are interested in more point cloud processing algorithms in QGIS, please contact us and we will be happy to add them to future QGIS releases.

Summary of the 3D features & enhancements in QGIS 3.30

QGIS 3.30 was released late last week and we are pleased to announce the new features introduced as a part of our latest crowdfunding campaign to improve 3D, point cloud and elevation data.

Thank you

First and foremost, thanks to the generous support from the community to fund our work. Here is the list of our contributors in no particular order:

IGN (INSTITUT NATIONAL DE L’INFORMATION GEOGRAPHIQUE ET FORESTIERE), National Land Survey of Finland, Danish Agency for Data Supply and Infrastructure, K2 Engineering GmbH, ProScape Consulting, Västra Götalandsregionen, Kristianstads kommun, IGN FI, L’Arrière Guichet, Septima, QWAST-GIS, ATAPEX s.r.o., REDcatch GmbH, F.A.R.M. Facilitazioni Agroecologiche Regionali Mobili, EPYMA TERRITORIO Y MEDIO AMBIENTE, SL, GEO EXPLORATION LTD, Bohannan Huston, Inc., Lidar Guys, Neuchâtel- Service de la géomatique, Wooding Geospatial Solutions, Ville de Vevey, QGIS User Group Switzerland, Ecophylla Consulting, Refactor, Locate Press, Alta ehf, Oester Messtechnik GmbH, RUDAZ+PARTNER AG, BayesMap Solutions LLC, GEOACE, Natalie Gyles, Andreas Neumann, Dougal Munro, Spatial Thoughts, Cicada Systems GIS Consulting, Cori Hermle, Powell Asset Mapping LLC, Darren Farmer, Greg Hall, Ecothought Pty Ltd, Gabriel Diosan, Bhutan QGIS Group, Ultimatum Finesse, Balanced Risk Strategies, Ltd, Concordia University, Burmis Studio Inc., Nicholas Hadaller, Angello Villatoro, Yoichi Kayama, Hennessy Amor Becerra Ayala, Flow Design Limited, BNHR.XYZ, Roberto Moyano, Benjamin Kuster, Goldspot, North River Geographic Systems, Inc, David W. Wormuth, Victor Graphics, Valley Spatial, Stephen Mather, SANTIAGO AURELIO MOTA, Kelly Crowell, Brian Duhan, Paddy Fisher, OSGEO:UK, Christian Gugl, GIP CRAIG - Centre Régional Auvergne-Rhône-Alpes de l’Infromation Géographqiue, Raphael Mabit, Tibor Lieskovský, Kerstin Fohlert, Zhan Li, Bernd Vogelgesang, Marlin Müller, Johannes Bonekamp, Stefan Giese, Fabian Faßnacht, QGIS Sweden user group, Falo, DAVID GARCIA HERNANDEZ, Lint Data and Geospatial, Cliff Sin Wai Lau, Grzegorz Sapijaszko, Łukasz Rapa, Alessandro Pintucci and Maarten Pronk.

Our gratitude also goes to those who want to remain anonymous.

Global map shading

Map data without global terrain shading

Global terrain shading for point clouds, dem and vectors

To see this feature in action, you can open QGIS project properties and under Terrain, there should be an option for Global Map Shading. You will need to first add a raster as your DEM under the Terrain section.

Elevations of all these layers are combined and the considered elevation is chosen depending on one of two methods:

  1. the highest elevation between raster, mesh or point cloud layers will be selected.
  2. elevation will be selected based on the order of layers in the layer panel.

Depending on the context and the use of the map the user can choose the more appropriate method.

For now, the shading methods implemented are the Eye Dome Lighting and the hill-shade. More methods could be added in the future - such as ambient occlusion.

The user can choose the elevation shading settings in a specific UI widget that can be found in two places:

  1. under the Project Properties, within the same tab of the project elevation settings.
  2. under the Styling Panel, a new tab is added for quick access to the user.

Global terrain shading settings in project properties

Global terrain shading settings in style panel

Profile elevation within print composer

This work was carried out by our collaborator North Road. The profile tool can embed elevation profiles within print layouts. It is possible to add beautifully styled profiles in your print outputs.

Embeding elevation profile in the print composer

To use elevation profiles in print layouts, simply click the Add Elevation Profile button icon elevation profile in print composer in the toolbar, and then to initialize it, copy profile configuration from an existing elevation profile from QGIS main window using the “Copy From Profile” button.

Elevation profile settings in the print composer

3D navigation improvements

With the new improvements, you can:

  1. move camera vertically using ctrl+shift+left mouse button
  2. keep zooming with the wheel while moving the mouse
  3. continue right mouse button zooming when pointer exits the viewport

Improve zoom-extents in 3D

The terrain’s and point cloud layers’ elevation range are taken into account so that the camera is not positioned below the scene’s contents, which was the case when using the terrain’s vertical scale setting to exaggerate the elevation differences.

Limit 3D scenes’ 2D extent

3D Views can now be limited to a specific 2D extent. The terrain is clipped and no 3D features beyond that extent are loaded, making it easy to render specific areas of big QGIS projects. The project’s 2D extent is used by default which can then be adjusted in each 3D view separately using the new General tab in 3D configuration.

Limiting 3D map extent

Limiting 3D map extent

Future updates

There will be more features planned for QGIS 3.32. We are finalising the Processing framework for point cloud data and it should be available on QGIS master in coming weeks.

Please do not hesitate to contact us if you have any suggestions to improve QGIS 3D and point cloud support.

QGIS and point clouds in MapScaping podcast

Listen to the latest developments in point clouds and QGIS from Martin Dobias: MapScaping podcast.

Martin Dobias, our CTO and the lead developer of 3D and point clouds integration in QGIS sat down with Daniel O’Donohue from Mapscaping to talk about point clouds and QGIS.

Martin discusses his early involvment with QGIS back in 2005 and how he started his journey to become a QGIS developer.

View and track changes in QGIS

With the recent changes to the Mergin Maps plugin for QGIS, you can visualise the local changes before synchronising your data.

Have you ever been in the situation when, after making a lot of changes in your Mergin Maps project, you hesitate to press Sync button because you are not sure that all required changes are made or afraid that some unwanted edits were introduced? Or maybe you need to review the work done and see what actually have changed between two versions? If the answer to any of these questions is “yes” then you will like the changes visualisation functionality we introduced in the 2022.4 version of the Mergin Maps plugin for QGIS.

Changes visualisation functionality comes handy in two use-cases: revising local changes made in the Mergin Maps project before syncing them with the server and getting a list of changes between two versions of the project. Let’s take a closer look at this feature.

Local changes visualisation

While working with Mergin Maps project, the user can at any time revise their current changes made locally. First, make sure that all your layer’s edits are saved (committed) as currently viewing of the unsaved changes is not supported. Then right-click on any vector layer and select “Show Local Changes” entry in the context menu.

Accessing local changes from context menu

Accessing local changes from context menu

This will open the Changes Viewer dialog. Each vector layer with local changes has its own tab in the Changes Viewer dialog, the name of the tab matches the layer name and also contains information about the number of changes in this specific layer. Local changes are shown on the map and in the tabular form, to distinguish different types of edits a following color codes are used: inserts (new features) are green, edits orange and deletions red. It is possible to enlarge or reduce the size of the map and table by dragging the splitter between them, splitter position is applied to all tabs and will be saved and reused on the further dialog calls.

Features added, deleted and modified in map and tabular views

Features added, deleted and modified in map and tabular views

Map canvas in the Changes Viewer dialog supports basic operations like panning as well as zooming in and out. By default, all project layers are shown on the map to provide better context, but it is possible to toggle their visibility by unchecking the “Toggle Project Layers” button in the toolbar above the map. When this button is unchecked, only changes from the current vector layer are shown.

If, after some panning/zooming, you need to return to the extent where all changes are visible — press “Zoom Full” button. Also, it is possible to select a specific feature(s) in the table below map and zoom to them by clicking the “Zoom To Selection” button. Finally, changes can be added as a new memory layer to the current project. To do so, click “Add to project” button and choose one of the options: add changes from the current layer or add all changes from all layers. For each changed layer, a new memory layer will be added to the current project. These changes layers will preserve the same color coding for features and attribute table as used in the Changes Viewer dialog. Please note, that these layers should be manually removed from the project before the sync, unless it is your intention to make them a part of your Mergin Maps project. Another way to revise local changes is to open Changes Viewer from the Project Status dialog by clicking “View Changes” button.

Mergin Maps Processing tools

Sometimes one may want to export local changes as a vector layer and save that file for further usage. Of course, this can be done with the help of Changes Viewer dialog, but it is time-consuming, especially when the Mergin Maps project has many layers or if there is a need to check local changes in several projects. To cover this use-case, we also provide “Extract local changes” tool. This tool is a part of the Mergin Maps QGIS plugin and can be found under the “Mergin Maps” group in the Processing Toolbox.

Mergin Maps Processing tools to create changeset

Mergin Maps Processing tools to create changeset

In the tool dialog you need to specify a directory with your Mergin Maps project, select a layer of interest either choosing from available layer or selecting a GeoPackage file in the project directory and layer in this file.

Processing tool to extract local changes

Processing tool to extract local changes

An output layer containing local changes will be created as a temporary or regular layer and added to the current project. This layer will have the same styling (both for features and attribute table) as the layers produced by Changes Viewer dialog.

Result of the local change processing tool

Result of the local change processing tool

The “Create diff” tool comes handy when you need to revise the changes between two versions of the layer in the Mergin Maps project. This tool is also a part of the Mergin Maps QGIS plugin, and it is implemented as a Processing algorithm. The “Create diff” tool can be found under the “Mergin Maps” group in the Processing Toolbox.

The tool dialog is quite similar to the “Extract local changes” tool dialog. Fill in input values: directory of your Mergin Maps project, layer of interest, start and end version numbers. Finally, specify location of the output vector layer or leave the field empty if you want it as a temporary layer in your current project. After clicking “Run” the tool will query the server for information and generate a vector layer containing all changes made between specified layer versions. For example, if some field value was changed in one version and then the same field was changed again in another version, then only the last change will be shown in the output changes file.

This feature is an another step in our ongoing efforts to create an easy-to-use tool for collaborative data collection and data management. If you need help or want to share your experience with Mergin Maps QGIS plugin, please join us in the community chatroom, and we will be happy to hear your thoughts.

Waste Sampling in the Digital Era - Case of the Czech Republic

Mergin Maps and QGIS used for municipal waste composition survey in the Czech Republic.

Global Environmental Threat of Municipal Waste

The dumping of municipal waste is a global threat to our environment and all life forms.

Currently, there is a distinct trend of less landfilling, as countries move steadily towards alternative ways of recycling and incineration, where material use is not possible.

Dr Martin Pavlas, Associate Professor at the Institute of Process Engineering in the Faculty of Mechanical Engineering at Brno University of Technology in the Czech Republic, is doing important research as part of an EU project regarding municipal waste sampling.

Photo of bins, M. Pavlas

Bins to be sampled (Photo: M. Pavlas)

With the aid of Mergin Maps and QGIS, he is carrying out an extensive municipal waste composition survey in the Czech Republic. Together with Peter Petrik of Lutra Consulting, a unique GIS-based tool was developed for the waste sampling. This includes a prototype mobile application based on Mergin Maps for waste sampling in the field.

Read the full article on merginmaps.com

Successful crowdfunding campaign - point cloud 3

We are pleased to announce the success of the fund raising campaign, thanks to the great response from the QGIS community. We will publish the full list of the backers soon.

The project will introduce point cloud processing to QGIS and further enhance profile tool and 3D maps. The new processing tools will allow you to create terrain/contours from your point cloud data, handle and manage large datasets and several other processing algorithms. In addition, we intend to allow you to embed profiles in your print layouts, export to other formats (e.g. DXF, CSV) and more improvements to the elevation profile tool. For more details see the crowdfunding page.

The work will start soon in collaboration with the excellent teams from North Road and Hobu. To stay up to date with progress, you can follow this blog or monitor QGIS code repository. If you would like to test the new features and provide us with your feedback, you can install QGIS nightly/master.

Crowdfunding: Point cloud processing in QGIS and 3D data enhancements

We are pleased to announce a new crowdfunding campaign to introduce point cloud processing to QGIS! Similar to the previous crowdfunding campaigns, we have teamed up with North Road and Hobu.

Point cloud data and raster shading in QGIS

Point cloud data and raster shading in QGIS.

In the last couple of years, we added point cloud data to QGIS, developed profile tool, improved 3D map navigation and many more features related to 3D data.

The new processing tools will allow you to create terrain/contours from your point cloud data, handle and manage large datasets and several other processing algorithms. In addition, we intend to allow you to embed profiles in your print layouts, export to other formats (e.g. DXF, CSV) and more improvements to the elevation profile tool. For more details see the crowdfunding page.

To pledge to this crowdfunding campaign, simply fill in the form. We will start the work as soon as the target fund is raised.

Mergin Maps in MapScaping podcast

We talked about Mergin Maps in the MapScaping podcast: QGIS Offline And In The Field

Peter Petrik was a guest in the episode of QGIS Offline And In The Field. He talked with Daniel O’Donohue about collection of spatial data in the field.

Mergin Maps is a field data collection app based on QGIS. It makes field work easy with its simple interface and cloud-based sync. Available on Android, iOS and Windows. Screenshots of the Mergin Maps Input App for Field Data Collection
Get it on Google Play Get it on Apple store

QGIS and point clouds in MapScaping podcast

Listen to the latest developments in point clouds and QGIS from Martin Dobias: MapScaping podcast.

Martin Dobias, our CTO and the lead developer of 3D and point clouds integration in QGIS sat down with Daniel O’Donohue from Mapscaping to talk about point clouds and QGIS.

Martin discusses his early involvment with QGIS back in 2005 and how he started his journey to become a QGIS developer.

Point cloud and QGIS 3D improvements - progress report 3

This is a part of series of blog posts to update QGIS community with the outcome of the funding we had raised during late 2021 to improve elevation and point clouds in collaboration with North Road and Hobu. For other updates see part 1 and part 2.

Profile tool

With the new integrated profile tool, you can generate cross sections of point clouds, raster, vector and mesh data. For more information on this tool, you can see the excellent video introduction by North Road who implemented this part of the project.

To be able to view profiles from different data types, there is now a dedicated Elevation settings under layer properties. Users can set the elevation source, style and some other configurations. You can then enable elevation profile widget window by going to the main menu in QGIS, View > Elevation Profile.

Elevation Profile tool in QGIS

Support for COPC

Cloud Optimized Point Cloud (COPC) is a new format for point cloud data and QGIS 3.26 comes with support for it (for both local files and data hosted on remote servers).

COPC is a very exciting addition to the ecosystem, because it is “just” a LAZ file (a format well established in the industry) that brings some interesting extra features. This means all software supporting LAZ file format will also be able to read COPC files without any extra development. If you are familiar with Cloud Optimized GeoTIFF (COG) for rasters, COPC is an extension of the same concept for point cloud data. Read more at https://copc.io/

Ordinary LAS/LAZ files have an issue that it is not possible to efficiently read a subset of data without reading the entire file. This is less of an issue when processing point cloud data, but much more important for point cloud viewers, which typically show only a small portion of the data (e.g. zoomed in to a particular object or zoomed out to show the entire dataset). For that reason, viewers need to index (pre-process) the data before being able to show it - QGIS also needs to do the indexing when a point cloud file is first loaded. The new feature that COPC brings is that data is re-organized in a way that reading just some parts of data is efficient and easy. Therefore when loading COPC files, QGIS can immediately show them without any indexing (that takes time and extra storage).

In addition to that, COPC files can be efficiently used also directly from remote servers - clients such as QGIS can only request small portions of data needed, without the need to download the entire file (that can have size of many gigabytes). This makes dissemination of point cloud data easier than before - just make COPC files available through a static server and clients are ready to stream the data.

A small note: until now, QGIS indexed point cloud files to EPT format upon first load. From QGIS 3.26 we have switched to indexing to COPC - it has the advantage of being just a single file rather than lots of small files in a directory. If you have point cloud data indexed in EPT format already, QGIS will keep using EPT index (rather than indexing also to COPC).

Display of a remote COPC file

Display of a remote COPC file

Classified renderer improvements

Classified renderer for point clouds has been improved to:

  • Show only classes that are in the dataset (instead of hard-coded list) & show also non-standard classes
  • Show percentage of points for each class
  • Work also for other attributes (return number, number of returns, point source and few other classes)

Point cloud classification

Vector transparency in 3D scene

This improvement is not part of the crowdfunding campaign and was exclusively funded by the Swedish QGIS user group, but it is somehow relevant to the audience of this blog post!

With this feature, you can set polygon transparency in 3D scenes.

3D vector transparency

Want to see more features?

We are trying to improve QGIS to handle point clouds for visualisation and analysis. If you would like certain features to be added to QGIS, do not hesitate to contact us on [email protected] with your idea(s).

Point cloud and QGIS 3D improvements - progress report 2

This is a part of series of blog posts to update QGIS community with the outcome of the funding we had raised during late 2021 to improve elevation and point clouds in collaboration with North Road and Hobu. For other updates see part 1 and part 3.

Point cloud filtering

With this feature, you can filter the point cloud data based on the classes or any other attributes. This is very similar to filtering available for vector layers.

Filtering data allows you superimpose for example building on top of the raster representation of your point cloud data:

Filtering of point clouds

Filtering of point clouds

Examples of filtering you can use:

  • Classification = 2 - only show ground points

  • ReturnNumber = 1 - only show the first return or ReturnNumber = NumberOfReturns for the last return

  • Z >= 10 AND Z <= 50 - only show a slice from the range of elevations

The filtering window also displays statistics of some of the parameters.

2D/3D Camera sync

When you navigate in the 2D map, you often want to see the 3D map view also updated and vice versa. This feature also allows you to view the extent and camera angle of your 3D map view on 2D map.

2D-3D camera sync

New point clouds styling method

There is a new 3D styling mode for point cloud which follows the 2D styling. This means you do not need to apply the same styling, e.g. Classification twice: once for the 2D map view and another for the 3D map view. Once you set the 3D style to follow 2D map, any changes in 2D map style will be automatically displayed in 3D map.

Follow 2D style for 3D point clouds

Camera and navigation improvements

This feature was funded by QGIS.org to improve 3D map navigation. Users can now better move, rotate both the map and camera. The 3D map navigation is now more inline with other applications like Google Earth.

Camera navigation

Point cloud and QGIS 3D improvements - progress report 1

This is a part of series of blog posts to update QGIS community with the outcome of the funding we had raised during late 2021 to improve elevation and point clouds in collaboration with North Road and Hobu. For other updates see part 2 and part 3.

A big thanks!

This work was made possible with generous donations and support by the individuals and organisations below (not in a particular order):

Stuart Smith, BayesMap Solutions, Tibor Lieskovský, Balanced Risk Strategies, Yoichi Kayama, Basel Land Registry and Surveying Office (GVA), Rudaz + Partner, Jakub Fuska, Richard Barnes, Spatial Thoughts, Hans van der Kwast, António Pestana, Richard Lorion, Eagle Resources, Suresh Muthukrishnan, 12P Consulting, Alta, JCIS Consultants, Brenna Hughes, Amt für Geoinformation Basel-Landschaft, Darren Farmer, F.A.R.M. Facilitazioni Agroecologiche Regionali Mobili, Ali Nayeri, Land Vorarlberg, Landesamt für Vermessung und Geoinformation, QGIS User Group Switzerland, Robert Thunen, Twomile Heavy Industries, Inc., Roberto Moyano, Jens Grehl, Pēteris Daknis, Rob Willson (Ecophylla Consulting), Daniel Löwenborg, Ville de Vevey, Alfredo Toledo (Suriyaco), QTIBIA Engineering, Ian Burrows (FAS), Pascal Obstetar, Lidar Guys, Mapping Automation, LLC, Featherstone Survey and Civil, Peter Schmitz, Fernando Michel Tuesta Chichipe, Hugo Sørensen, Bernie Connors, Watershed Research and Training Center, MBS Environmental, Andreas Neumann, Adrian Matter, Mapfly, Enso, João Gaspar, Eric van Dijk, City of Uster, Switzerland, QGIS Usergroup Denmark, STAEREA, Ostschweizerische Gesellschaft für Höhlenforschung, Department of Environment, Land, Water and Planning (Victoria), IGN FI, Travis Flohr, Amt für Wald beider Basel, Matthew Bodnar, Surface libre, OSGeo:UK, National Land Survey of Finland,Natural Resources Canada, Fonds Brukhalter, Arbeitsgemeinschaft Höllochforachung AGH, gis experts, BNHR, Rogue Geoscience Ltd., USACE CRREL and Ian Huitson.

In addition to the list above, we thank several anonymous donors who chose not to be listed.

If you have made a donation towards this work and your name or your organisation name does not appear here, please contact us ([email protected]).

3D view manager

Previously, if you closed a project with a 3D map view, the 3D map view and all its settings were lost when you reopen that project. So in QGIS 3.24 we’ve added a “3D map view manager” that takes care of listing, removing, renaming and duplicating 3D map views in your projects! We’ve also added a new “3D Map Views” menu, which contains all your created 3D map views for easy access.

To summarise, these are the advantages of this new feature:

  • Saving 3D map views within QGIS project (similar to other settings) and being able to retrieve the 3D view after closing (either the view or the project)
  • 3D map view manager: which allows you to duplicate, rename and delete 3D map views

3D Map Views Manager

Dock/undock 3D views

3D map canvas panel was difficult to move, resize and often resulting in unwanted docking. With QGIS 3.24 we added the ability to switch 3D maps from a dockable widget to a top-level window (and back to a dock widget), so that these map views can now be managed, resized and moved just like a standard application window. In addition, you can now use 3D map view in full screen mode.

Docking and undocking 3D view

Respect Z ordering of point clouds in 2D

We’ve added an option to render point clouds according to their Z-order in 2D map views. With the new bottom-to-top ordering option enabled, points with larger Z values will cover lower points – resulting in the appearance of a true orthographic photo. There’s also an option for reverse sorting (top-to-bottom), where the scene appears as if viewed from below. This feature is available in QGIS 3.24

The image below displays the default Z ordering of a LAS file when loaded in QGIS:

Default Z ordering

The same layer with the ordering of Z switched to bottom-to-top:

Z ordering bottom to top

Visualisation of point cloud as solid surfaces

With this feature you can render point cloud layer in the 3D view as solid surfaces generated by triangulation. The triangulation is available for all the 3D point cloud renderers: unique color, ramp color, classification and RGB. This feature will be available in QGIS 3.26 and you can try it in the current QGIS nightly/master.

Triangle rendering of point clouds

Mapping Invasive Weeds in Swan Bay, Australia

Mergin and the Input App used for efficient mapping and recording of weed clearance in environmentally important wetland of Swan Bay.


“Input can in theory handle everything you’d ever want for a mapping tool!”

Dr Greg Parry BSc (Hons), PhD - 8 December 2021


Greg Parry is President of the Swan Bay Environment Association in the Borough of Queenscliff, Victoria, Australia. This semi-retired marine ecologist runs a one-man ecological consulting business, Marine Ecological Solutions.

Edward’s Point, courtesy of SBEA

Bare sand and seagrass meadows off the beach at Edward’s Point.

Importance of Swan Bay

Swan Bay is a significant marine wetland with an area of 30 km2, situated near the entrance to Port Phillip Bay on the south-central coast of the Province of Victoria. This is an important bird habitat, supporting the life of about 200 different bird species. It has been recognised as an area of international importance under the Ramsar Convention. Every October, Swan Bay is visited by thousands of migratory shorebirds. More than 3 000 Black Swans can be seen in the bay in Summer and Autumn. The seagrass in Swan Bay is also an important habitat for a variety of fish and other marine life.

Drone image of Swan Bay, courtesy of SBEA

Drone image of Swan Bay, Australia

Aims of the Swan Bay Environment Association

The natural flora and fauna in the area are under threat by environmental weeds. Among the 300 different plant species, about 50 % are alien. Invasive environmental weeds harm native plants and animals, the natural landscape and threaten the biodiversity of indigenous species. The three main invasive weeds in Swan Bay are Italian Buckthorn, African Boxthorn and Polygala myrtifolia (myrtle-leaf milkwort from South Africa).

African Boxthorn, courtesy of SBEA

African Boxthorn

A team of volunteers from among the 120 members of the Environment Association will assist with the removal of invasive weeds. Some of these are so large or spiny they need to be cleared by contractors. Others require spraying, while many will be cleared manually by a team of volunteers.

pre-weeding, courtesy of SBEA post-weeding, courtesy of SBEA

Pre- and post-weeding of the same area

Need for Effective Mapping

This is where Dr Parry’s expertise comes in – together with Mergin and the Input App. He realises the urgent need for effective mapping and planning, to co-ordinate the work of volunteers. If this is not done, there is “inadequate follow-up, so it is a waste of their time and energy”. He emphasises, “We need better records of when places are weeded and how they are weeded.”

The role of accurate mapping is two-fold: firstly to create a historical record of past weeding and to assess weed density, and, secondly, to identify the areas for future weeding.

Dr Parry has classified the following categories for weeding as:

  1. areas suitable only for contractors requiring heavy equipment, (RED on map)
  2. areas suitable for contractors or volunteers – more open areas, usually where the worst weeds have already been removed by contractors, (ORANGE on map)
  3. areas suitable for volunteers – few weeds requiring diligent searching, and many man-hours but limited manual labour, (GREEN on map)
  4. areas where drainage has increased weed infestations so that drainage should be tackled before weed removal makes sense. (BLUE on map)
Classification of 4 different weeding categories, courtesy of SBEA

Classification of 4 different weeding categories

Dr Parry realises the need to store the information accurately (how much work has been done, the man-hours and number of people, etc.) and then to analyse it, so as to achieve a more effective job by volunteers in future.

Weeds removed between 2015 and mid-2021, courtesy of SBEA

Map showing all areas where weeds have been removed between 2015 and mid-2021. Underlying these ‘weed density’ polygons are polygons showing areas that were weeded in different years between 2015-2021.

Conclusion

Dr Parry finds that Input has all the features required for this project. It will be very useful for volunteers in the field, especially as it is usable by both iOS and Android. He thinks it is “remarkably cheap”, compared to the software he had previously been using.

He has some experience with GIS and, after watching a YouTube instructional video, has managed to incorporate QGIS and set it up without many problems. Once he has fine-tuned the set-up, he is sure that he will be able to enlist many more willing volunteers for this important undertaking.

Back in 2005, Dr Parry had used a Magellan Mobile Mapper hand-held device for mapping, which was bulky and cost about $7 500. “Now all of the capacity of that system is available on your phone!” He is motivated to incorporate the user-friendly features of the Input App in order to achieve his main long-term objective:

“This information, I think, will be very helpful in improving co-ordination of weeding efforts within the borough and ensuring that resources are used efficiently. Over a few years, we will get a much better concept of the resources required to do the job in total. I’d summarise it to say we should be a bit more strategic about it, so as to be more effective.”

Download Mergin Maps Today

Screenshots of the Input App for Field Data Collection

Get it on Google PlayGet it on Apple store

Working collaboratively, not sequentially

Nick shares problems faced by his distributed GIS team and how Mergin solved them.

Nick was searching for a way for his remote team to safely edit the GIS layers of their fibre network designs at the same time. Solutions he’d tried were either unsafe for concurrent editing, not feature-rich enough or had prohibitive licence costs. Nick now uses Mergin to collaborate with his colleagues around the world in near real time.

Highbeech logo

Nick Whittaker is Director of Highbeech Consultancy, a company providing specialised fibre optic network design services. Highbeach is based in England and operates in markets around the world.

Around 9 years ago, Highbeech started helping their clients develop city-wide fibre-to-the-home network design strategies. Nick’s team developed network simulation models which they used to understand the performance and likely construction costs of different designs fed by both public and municipality GIS data. The models proved a success as several clients commissioned construction of the resulting designs.

Nick’s team were now tasked with acting as technical liaison to the engineering companies carrying out the build in the US.

Nick Whittaker

Nick Whittaker

The Challenge

Nick now needed a way for the different project partners to safely view and edit the design at the same time: “This was working sequentially, not collaboratively - we needed to be able to work in parallel!”

“One of the engineering companies we were advising had requirements to have staff in different parts of the US and at present, everything we were doing with the designs ran on-premises. People could use VPNs but working on designs was a nightmare” Nick explained.

Nick found working on designs via VPN was too slow to be workable and instead looked for a solution which would bring designs closer to the staff needing to work on them.

Cloud storage solutions such as OneDrive, Google Drive or Dropbox are unsuitable for collaboration on GIS data as they allow files that would normally be locked and accessed one at a time to be modified simultaneously by multiple users. This situation commonly results in data loss.

“We were having to limit ourselves to one person working on the design at a time and having to notify each other when it was safe for the next person to take over - file locking by email. This was working sequentially, not collaboratively - we needed to be able to work in parallel!” he added.

Nick searched for better solutions for allowing the various teams to work together quickly and safely at the same time.

“In the past we’d used ArcGIS Server which worked well as a collaboration platform when everyone was in the same office but wouldn’t be suitable in this case. We’d also tried ArcGIS Online but found it frustrating as it was too cut-down compared with ArcGIS Server.” Nick said.

Licencing was also an important factor for Nick: “Some solutions we looked at were plugins to other suites, for example, AutoCAD. If I tell my client that we’ll do a project in AutoCAD, they may tell me they can’t afford an AutoCAD licence.”

“While searching for collaborative GIS platforms I came across the Mergin plugin for QGIS.”

QGIS is open source GIS software with a large number of extensions called plugins.

“GIS is widely used in fibre network design and I used ArcGIS primarily. I first heard about QGIS when using FiberPlanIT as it’s implemented as a QGIS plugin. Within about 12 months I was doing the majority of my GIS tasks in QGIS and now consider myself a QGIS convert, purely because I see the power, potential and capability of its community.”

Example Fibre Network Design

A fibre network design shown in QGIS

Implementation and Outcomes

After taking time to evaluate Mergin within Highbeech, Nick proposed it as a collaboration platform to the US-based engineering company.

“Initially they were unsure how to set it up so I offered to do that and to administer it for them. Within 2-3 weeks they had 20 guys using it and within 3 months I’d migrated control of it over to them.” Nick said.

“The value is all about collaborating in near real time rather than the days it used to take to do things”

Nick’s team can now see the changes their US-based client makes to the design as they make them and jump in/out as required to perform validations and make corrections and changes as required.

“The time zone difference with the US now works to our advantage - we even tell our clients we can turn their 8 hour working day into a 16 hour working day.”

“Once our client’s fielding team has finished for the day, we work through their data, performing checks and validations and everything’s done by the time they’re back in the office the next day. This forms much of what Highbeech does on the project nowadays and this wouldn’t be possible without Mergin.”

When asked what worked particularly well about Mergin, Nick said: “the seamless way you can be working with someone on a call, make a change to a design and have it appear in front of them within seconds. This is incredible and something that happens on a regular basis.”

“The value is all about collaborating in near real time rather than the days it used to take to do things. That’s the greatest strength of both Mergin and Input.”

Input is a mobile app that allows GIS projects to be viewed and edited in the field.

When asked about how collaborative working might change in the future, Nick said: “We live in a world where an ever increasing number of people choose to work from home. For those working in fibre network design, that’s only possible with collaborative platforms such as Mergin.”

Nick has since introduced other clients in the US and UK to Mergin which supports their collaborative GIS efforts together.

Download Mergin Maps Today

Screenshots of the Input App for Field Data Collection

Get it on Google PlayGet it on Apple store

Successful crowdfunding: Thank you!

We are pleased to announce the success of our crowdfunding campaign to improve point cloud and elevation tools in QGIS. Thanks to the generous pledges from QGIS community, we have exceeded the target (including the stretch goal).

We are very excited and looking forward to developing those features in the upcoming QGIS releases in collaboration with North Road and Hobu.

Thanks again to all those who have contributed to the campaign. Without your support, these major developments would have not been possible. We will publish a blog post with the list of contributors in due course.

To stay tuned with the latest development, you can visit QGIS code repository or visit our blog for news and updates.

An example of a cross-section: view from the top including the profile line with a buffer, and the profile with two different ways of styling (classification / elevation-based).

An example of a cross-section: view from the top including the profile line with a buffer, and the profile with two different ways of styling (classification / elevation-based).

An example of a cross-section: view from the top including the profile line with a buffer, and the profile with two different ways of styling (classification / elevation-based).

You may also like...

Mergin Maps, a field data collection app based on QGIS. Mergin Maps makes field work easy with its simple interface and cloud-based sync. Available on Android, iOS and Windows. Screenshots of the Mergin Maps mobile app for Field Data Collection
Get it on Google Play Get it on Apple store

Back to Top

Sustaining Members