Related Plugins and Tags

QGIS Planet

QGIS 3D Tiles – thanks to Cesium Ecosystem Grant!

We’ve recently had the opportunity to implement a very exciting feature in QGIS 3.34 — the ability to load and view 3D content in the “Cesium 3D Tiles” format! This was a joint project with our (very talented!) partners at Lutra Consulting, and was made possible thanks to a generous ecosystem grant from the Cesium project.

Before we dive into all the details, let’s take a quick guided tour showcasing how Cesium 3D Tiles work inside QGIS:

What are 3D tiles?

Cesium 3D Tiles are an OGC standard data format where the content from a 3D scene is split up into multiple individual tiles. You can think of them a little like a 3D version of the vector tile format we’ve all come to rely upon. The 3D objects from the scene are stored in a generalized, simplified form for small-scale, “zoomed out” maps, and in more detailed, complex forms for when the map is zoomed in. This allows the scenes to be incredibly detailed, whilst still covering huge geographic regions (including the whole globe!) and remaining responsive and quick to download. Take a look at the incredible level of detail available in a Cesium 3D Tiles scene in the example below:

Where can you get 3D tile content?

If you’re lucky, your regional government or data custodians are already publishing 3D “digital twins” of your area. Cesium 3D Tiles are the standard way that these digital twin datasets are being published. Check your regional data portals and government open data hubs and see whether they’ve made any content available as 3D tiles. (For Australian users, there’s tons of great content available on the Terria platform!).

Alternatively, there’s many datasets available via the Cesium ion platform. This includes global 3D buildings based on OpenStreetMap data, and the entirety of Google’s photorealistic Google Earth tiles! We’ve published a Cesium ion QGIS plugin to complement the QGIS 3.34 release, which helps make it super-easy to directly load datasets from ion into your QGIS projects.

Lastly, users of the OpenDroneMap photogrammetry application will already have Cesium 3D Tiles datasets of their projects available, as 3D tiles are one of the standard outputs generated by OpenDroneMap.

Why QGIS?

So why exactly would you want to access Cesium 3D tiles within QGIS? Well, for a start, 3D Tiles datasets are intrinsically geospatial data. All the 3D content from these datasets are georeferenced and have accurate spatial information present. By loading a 3D tiles dataset into QGIS, you can easily overlay and compare 3D tile content to all your other standard spatial data formats (such as Shapefiles, Geopackages, raster layers, mesh datasets, WMS layers, etc…). They become just another layer of spatial information in your QGIS projects, and  you can utilise all the tools and capabilities you’re familiar with in QGIS for analysing spatial data along with these new data sources.

One large drawcard of adding a Cesium 3D Tile dataset to your QGIS project is that they make fantastic 3D basemaps. While QGIS has had good support for 3D maps for a number of years now, it has been tricky to create beautiful 3D content. That’s because all the standard spatial data formats tend to give generalised, “blocky” representations of objects in 3D. For example, you could use an extruded building footprint file to show buildings in a 3D map but they’ll all be colored as idealised solid blocks. In contrast, Cesium 3D Tiles are a perfect fit for a 3D basemap! They typically include photorealistic textures, and include all types of real-world features you’d expect to see in a 3D map — including buildings, trees, bridges, cliffsides, etc.

What next?

If you’re keen to learn even more about Cesium 3D Tiles in QGIS, you can check out the recent “QGIS Open Day” session we presented. In this session we cover all the details about 3D tiles and QGIS, and talk in depth about what’s possible in QGIS 3.34 and what may be coming in later releases.

Otherwise, grab the latest QGIS 3.34 and start playing…. you’ll quickly find that Cesium 3D Tiles are a fun and valuable addition to QGIS’ capabilities!

Our thanks go to Cesium and their ecosystem grant project for funding this work and making it possible.

FOSS4G SotM Oceania 2023 Auckland round up

Recently, we had the pleasure of helping organise the FOSS4G SotM Oceania 2023 conference in Auckland. It was a fantastic week and felt like a worthy return to pre-covid events full of great presentations, catching up with old friends, making new ones, and of course – delicious food! The venue, Auckland University of Technology, put on a really professional event with catering, venue spaces and their Audio Visual operations. Auckland gave us great weather, and great venues to enjoy each others company in.

We were blown away with the variety of presentations and the talent our Oceania region holds. We got to meet some of our clients in person including Koordinates, A.B. Heritage and Soar, which we loved, plus we spent valuable time connecting with our community.

At North Road we are passionate about supporting open-source and our local Oceania region, so we took an active part in making this year’s conference happen. Aside from being a conference sponsor, our very own powerhouse Emma Hain worked tirelessly as Program Chair to organise the conference program and ensure that the talks ran smoothly and were of very high value.  Nyall ran a workshop for Advanced Cartography, presented on his journey in the FOSS4G workspace and contributed as panel member on making  a living in FOSS4G. Emma also presented a lightning talk on GitHub QGIS Issues and was a community day facilitator on an exciting project to develop digital stories with a map component. We really love community and being involved in “building it” is integral. But it is also super fun as well!

One of the great things about this conference is the legacy it leaves, not only in the relationships formed, but in the recordings of all the presentations that end up on the FOSS4G Oceania YouTube channel. This is not only knowledge captured for the community, but also a showcase for the talent that exists in FOSS4G. Not every  presentations was technical or about case studies, they also covered personal observations, hobbies and general mapping topics.

You can view the presentations from our staff below:

Also, check out the presentations from some of the great companies we have worked with:

Soar: Soar: lessons from our start-up experience, From Satellites to Slobs,   Maps, Media and Manipulation

Koordinates: Kart – the geospatial version control system – now with Rasters!Making it up: map making bots, generative mapping and TTRPG tools

Community Day

On the last day of the conference we attended the Community Day. This involves a Mapathon run by HOTOSM, and rooms for brainstorming and workshopping of ideas. These were really valuable! First we attended the FOSS4G Hui run by Byron Cochrane from OpenWork (one of the conference sponsors). It was a great discussion on how to make FOSS4G more relevant in Oceania. If you are keen to help out with this, contact the OSGeo Oceania Board – as they need helpers with Communications and members to espouse FOSS4G at outside conferences.

Emma also ran the session on developing digital stories with a map component in a FOSS4G environment. This was well attended with a lot of ideas. We developed our MVP and we are now looking at our next steps. The question here is do we develop a new tool within existing software, find a standalone software where we could add in a map component, or approach a current OS Story Map software and provide our MVP and find funding. If you’re keen to take part in these discussions, you can join in on the Maptime Oceania slack channel under #foss4g-productdev.

A Big Thank-you!

The Organisation committee worked so hard on putting this conference on, and we would like to express our heartfelt thanks for this. This is the keystone event for our community and so much grows from this. Without the Organisation Committee’s sweat, tears, frustration and joy this would not have happened. We thank their families who supported them whilst they gave up their valuable time and their employers who supported them to give their time and effort to making this special event happen.

Bring on FOSS4G/SOTM Oceania 2024!

QGIS Add to Felt Plugin – Phase 2

We have been continuing our work with the Flagship sponsor of QGISFelt to develop their QGIS Plugin – Add to Felt  that makes it even easier to share your maps and data on the web.

What is the ‘Add to Felt’ QGIS Plugin?

The ‘Add to Felt’ QGIS Plugin is a powerful tool that empowers users to export their QGIS projects and layers directly to a Felt web map. This update introduces two fantastic features:

  1. Single Layer Sharing: You can now share a single layer from your QGIS project to a Felt map. This means you have greater control over which specific data layers to share, allowing you to tailor your map precisely to your audience’s needs.
  2. Map Selection: With the updated plugin, you can choose which map on Felt to add your layer to – a new map, or an ongoing project. This flexibility simplifies your workflow and ensures that your data ends up in the right place.

Businesses that rely on QGIS love how these new features provide a seamless way to view and share results, ultimately allowing them to move more quickly and stay in sync:

“Felt helps us keep each other updated on what we’ve done, what we’ve modeled, how things are progressing.” – ICON Engineering

Why is this Update Important?

Web maps are invaluable tools for sharing data with a wider audience, be it colleagues, clients, or the public. They provide creators with the ability to control data visibility, display options, and audience access, all within an easily shareable digital format. However, creating web maps can be an arduous and complex task.

Here’s where the ‘Add to Felt’ QGIS Plugin update comes to the rescue:

1. Streamlining the Process: Creating web maps traditionally involves website development, data hosting, and map application development—tasks that require a diverse skill set. This complexity can be a significant barrier, especially for smaller operations with limited resources or budget constraints.

2. Felt Simplifies Web Mapping: Felt makes it effortless to create web maps, and share them as easily as you would a Google Doc or Sheet. Simply drag and drop your data, customize the symbology to your liking, and share the map with a link or by inviting collaborators. No need to send large data files or answer questions about the map’s data sources.

3. Integration with QGIS: Now, the ‘Add to Felt’ QGIS Plugin bridges the gap between QGIS and Felt. It seamlessly imports your QGIS data into Felt, eliminating the need for manual data transfers and reducing the complexity of web map creation.

In essence, the ‘Add to Felt’ QGIS Plugin update simplifies the process of sharing and collaborating on web maps. It empowers users to harness the full potential of web-based mapping, making it accessible to everyone, regardless of their technical expertise. The update makes it even easier to share progress updates or model re-run outputs without creating a new map, or sharing a new map link.

So, if you’re a QGIS user looking to enhance your map-sharing capabilities and streamline your workflow, make sure to take advantage of this fantastic update. Say goodbye to the complexities of web map creation and hello to effortless, data-rich web maps with Felt and the ‘Add to Felt’ QGIS Plugin.

How to install and upgrade

  • Open QGIS on your computer. You must have version 3.22 or later installed.
  • In the plugins tab, select Manage and Install Plugins.
  • Search for the ‘Add to Felt’ plugin, select and click Install Plugin.
  • Close the Plugins dialog. The Felt plugin toolbar will appear in your toolbar for use.
  • Sign into Felt and begin sharing your maps to the web.

If you want more features in this plugin, let us know or you’re interested in exploring how a QGIS plugin can make your service easily accessible to the millions of daily QGIS users, contact us to discuss how we can help!

Soar.Earth Digital Atlas QGIS Plugin

Soar banner

Growing up, I would spend hours lost in National Geographic maps. The feeling of discovering new regions and new ways to view the world was addictive! It’s this same feeling of discovery and exploration which has made me super excited about Soar’s Digital Atlas. Soar is the brainchild of Australian, Amir Farhand, and is fuelled by the talents of staff located across the globe to build a comprehensive digital atlas of the world’s maps and images. Soar has been designed to be an easy to use, expansive collection of diverse maps from all over the Earth. A great aspect of Soar is that it has implemented Strong Community Guidelines and moderation to ensure the maps are fit for purpose.

Recently, North Road collaborated with Soar to help facilitate their digital atlas goals by creating a QGIS plugin for Soar. The Soar plugin allows QGIS users to directly:

  • Export their QGIS maps and images straight to Soar
  • Browse and load maps from the entire Soar public catalogue into their QGIS projects

There’s lots of extra tweaks we’ve added to help make the plugin user friendly, whilst offering tons of functionality that power users want. For instance, users can:

  • Filter Soar maps by their current project extent and/or by category
  • Export raw or rendered raster data directly to Soar via a Processing tool
  • Batch upload multiple maps to Soar
  • Incorporate Soar map publishing into a Processing model or Python based workflow

Soar will be presenting their new plugin at the QGIS Open Day in August so check out the details here and tune in at 2300 AEST or 1300 HR UTC. You can follow along via either YouTube or Jitsi.

Browsing Soar maps from QGIS

One of the main goals of the Soar QGIS plugin was to make it very easy to find new datasets and add them to your QGIS projects. There’s two ways users can explore the Soar catalog from QGIS:

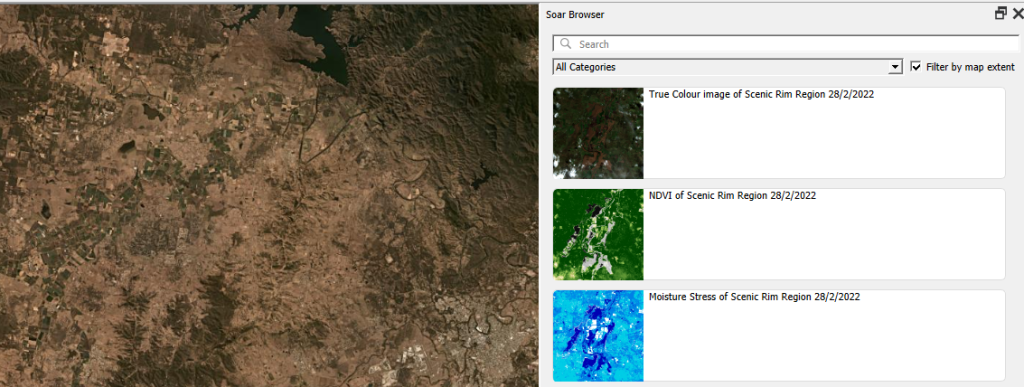
You can open the Soar Browser Panel via the Soar toolbar button  Soar browser . This opens a floating catalog browser panel which allows you to interactively search Soar’s content while working on your map.

Soar browser panel

Alternatively, you can also access the Soar catalog and maps from the standard QGIS Data Source Manager dialog. Just open the “Soar” tab and search away!

When you’ve found an interesting map, hit the “Add to Map” button and the map will be added as a new layer into your current project. After the layer is loaded you can freely modify the layer’s style (such as the opacity, colorization, contrast etc) just like any other raster dataset using the standard QGIS Layer Style controls.

Sharing your maps

Before you can share your maps on Soar, you’ll need to first sign up for a free Soar account.

We’ve designed the Soar plugin with two specific use cases in mind for sharing maps. The first use case is when you want to share an entire map (i.e. QGIS project) to Soar. This will publish all the visible content from your map onto Soar, including all the custom styling, labeling, decorations and other content you’ve carefully designed. To do this, just select the Project menu, Import/Export -> Export map to Soar option.

Upload via Project to Soar

You’ll have a chance to enter all the metadata and descriptive text explaining your map, and then the map will be rendered and uploaded directly to Soar.

Soar Metadata

All content on the Soar atlas is moderated, so your shared maps get added to the moderation queue ready for review by the Soar team. (You’ll be notified as soon as the review is complete and your map is publicly available).

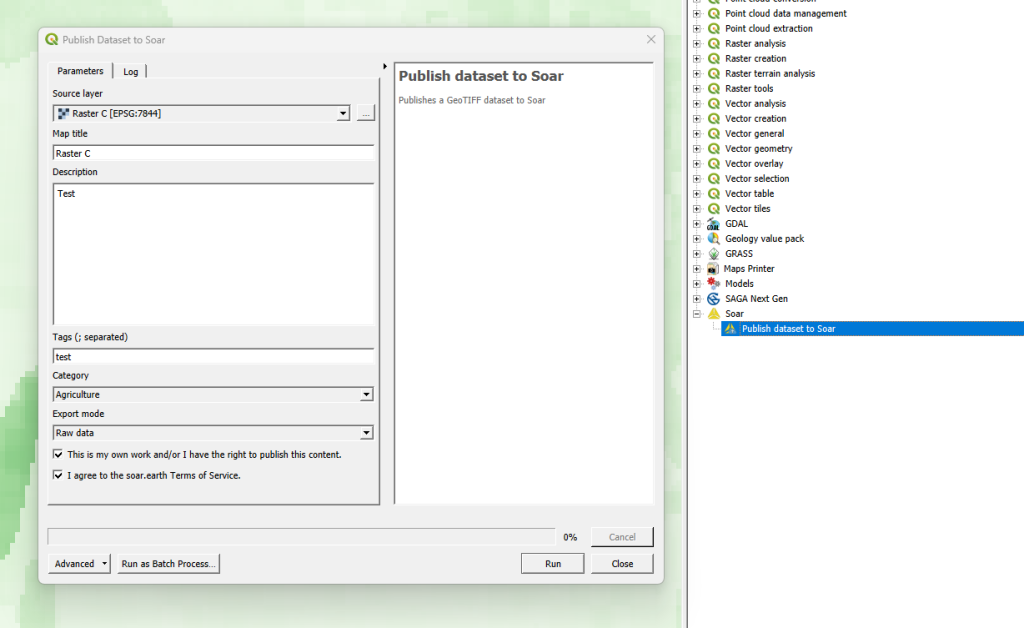
Alternatively, you might have a specific raster layer which you want to publish on Soar. For instance, you’ve completed some flood modelling or vegetation analysis and want to share the outcome widely. To do this, you can use the “Publish dataset to Soar” tool available from the QGIS Processing toolbox:

Upload product to Soar via processing tools

Just pick the raster layer you want to upload, enter the metadata information, and let the plugin do the rest! Since this tool is made available through QGIS’ Processing framework, it also allows you to run it as a batch process (eg uploading a whole folder of raster data to Soar), or as a step in your QGIS Graphical Models!

Some helpful hints

All maps uploaded to Soar require the following information:

  • Map Title
  • Description
  • Tags
  • Categories
  • Permission to publish

This helps other users to find your maps with ease, and also gives the Soar moderation team the information required for their review process.

We’ve a few other tips to keep in mind to successfully share your maps on Soar:

  • The Soar catalog currently works with raster image formats including GeoTIFF / ECW / JP2 / JPEG / PNG
  • All data uploaded to Soar must be in the WGS84 Pseudo-Mercator (EPSG: 3857) projection
  • Check the size of your data before sharing it, as a large size dataset may take a long time to upload

So there you have it! So simple to start building up your contribution to Soar’s Digital Atlas. Those who might find this useful to upload maps include:

  • Community groups
  • Hobbyists
  • Building a cartographic/geospatial portfolio
  • Education/research
  • Contributing to world events (some of the biggest news agencies already use this service i.e. BBC)

You can find out more about the QGIS Soar plugin at the QGIS Open Day on August 23rd, 2023 at 2300 HR AEST or 1300 HR UTC. Check here for more information or to watch back after.

If you’re interested in exploring how a QGIS plugin can make your service easily accessible to the millions of daily QGIS users, contact us to discuss how we can help!

‘Add to Felt’ QGIS Plugin

The gift economy of Open Source is community driven and filled by folks with ideas that just go for it!

We at North Road are blessed that we get to join these creatives on their journey in order to get their products to you. Recently, the first QGIS flagship sponsor, Felt, engaged us to further strengthen their support for the up to 600,000 daily QGIS users to integrate their workflows between QGIS and Felt.

The result is the “Add to Felt” QGIS Plugin, which makes it super-simple to publish your QGIS maps to the Felt platform.

To get started, install the Add to Felt Plugin from the QGIS Plugin manager.

If you don’t have a free Felt account, you’ll need to sign up for one online (or from the Add to Felt plugin itself once you have installed it).

Within QGIS, users can easily publish their maps and layers to Felt. You can either:

  • Publish a single layer by right-clicking the layer and selecting “Share Layer to Felt” from the Export sub-menu
  • Publish your whole QGIS project/map by selecting the Project Menu, Export, “Add to Felt” action

Whilst Felt is loading up your map, you can continue working and it will let you know once your map is ready to open on Felt and share with others.

We are happy to let you know that the collaboration does not stop there! As with our SLYR tool, there is ongoing development as the requirements of the community and technology grow.  So install the Add to Felt Plugin via the QGIS Plugin manager, and let us know where you want it to go via the Add to Felt GitHub page.

Read more about it here:

Cesium Ecosystem Grant Win for QGIS 3D Tiles!

Success! Lutra and North Road have been rewarded a Cesium Ecosystem Grant to provide access to 3D tiles within QGIS. We will be creating the ability for users to visualise 3D Tiles in QGIS alongside other standard geospatial sources in both 3D and 2D map views.
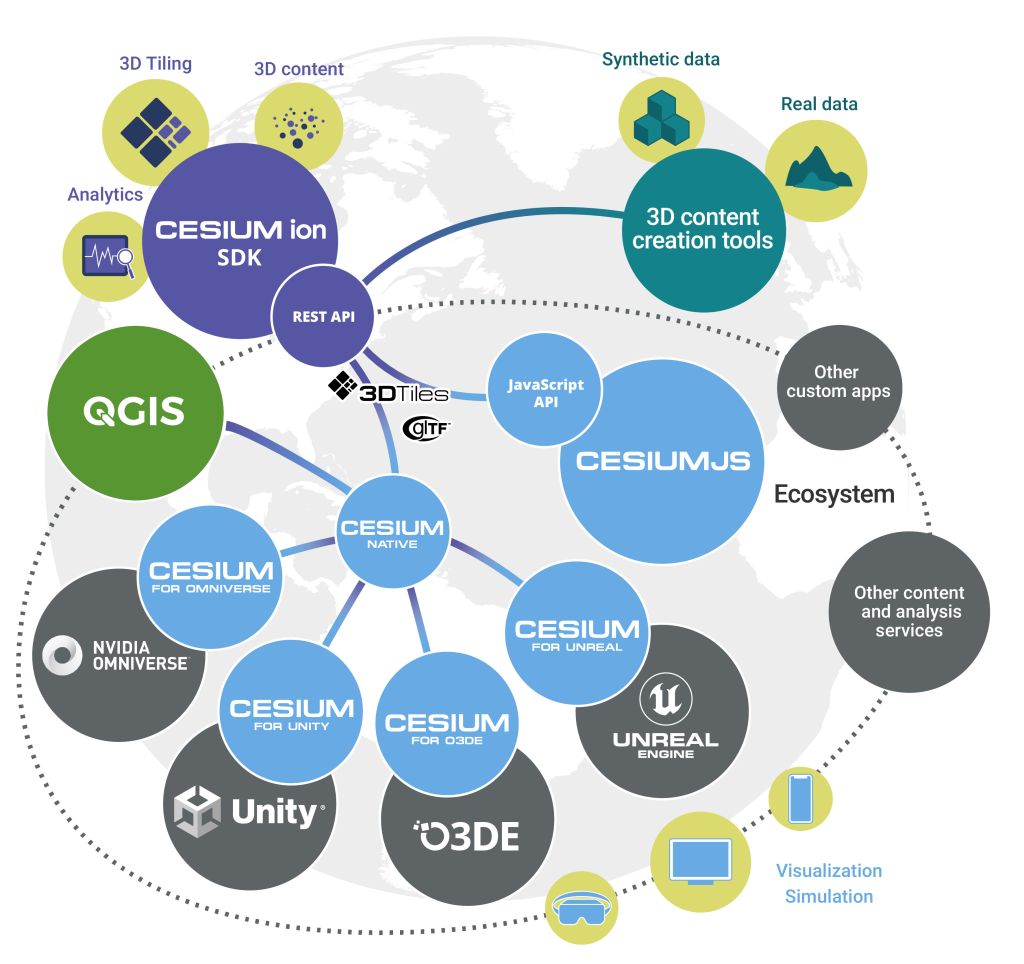
3D Tiles Cesium integration ecosystem diagram
3D Tiles Cesium integration ecosystem
We are very excited about it, but to be included in the first cohort of awardees is also an added honour! We share this distinction with 3 other recipients:
The opportunity was brought to our attention by our friends over at Nearmap, which, along with the existence of this grant, shows how the geospatial community is working together by evolving the Open Source Economy. A movement close to our hearts and our core business. Working between commercial software and open-source, Cesium’s business model recognises the legitimacy of Open Source Software for use as a geospatial standard operating procedure by promoting openness and interoperability.
Our team of Nyall Dawson and Martin Dobias will create a new layer type, QgsTiledMeshLayer, allowing for direct access to Cesium 3D tile sources alongside the other supported geospatial layer types within QGIS. This will include visualisation of the tile data in both 3D and 2D map views (feature footprints). It will fulfill a critical need for QGIS users, permitting access to 3d data provided by their respective government agencies to work alongside all their other standard geospatial layers (vector, raster, point clouds). By making 3D Tiles a first class citizen in QGIS we help strengthen the case that those agencies should be providing their data in the Cesium format (as opposed to any proprietary alternatives).
Proposed Technical Architecture Cesium QGIS
Proposed Technical Architecture for Cesium 3D Tiles in QGIS
Here’s a breakdown of what we will be doing:
  • Develop a new QGIS layer type “QgsTiledMeshLayer”
  • Develop a parser for 3D Tiles format, supporting Batched 3D Model (with a reasonable set of glTF 2.0 features)
  • Develop a 3D renderer which dynamically loads and displays features from 3D Tiles based on appropriate 3D view level of detail. (A similar approach has already been implemented in QGIS for optimised viewing of point cloud data).
  • Develop a 2D renderer for 3D Tiles, which will display the footprints of 3D tile features in 2D QGIS map views. Just like the 3D renderer, the 2D renderer will utilise map scale information to dynamically load 3D tiles and display a suitable level of detail for the footprints.
  • Users will have full control over the appearance of the 2D footprints, with support for all of QGIS’ extensive polygon symbology options.
  • By permitting users to view the 2D footprints of features, we will promote use of Cesium 3D Tiles as a suitable source of cartographic data, eg display of authoritative building footprints supplied by government agencies in the Cesium 3D Tile format.

Through past partnerships, North Road and Lutra Consulting have developed and extended the 3D mapping functionality of QGIS. To date, all the framework for mature, performant 3D scenes including vector, mesh, raster and point cloud sources are in place. We are now ready to extend the existing functionality with Cesium 3D tiles support as QGIS 3D engine already implements most of the required concepts, such as out of core rendering and hierarchical level of detail (tested with point clouds with billions of points).

So there we go! Working together collaboratively with Lutra Consulting on another great addition to QGIS 3D Functionality thanks to Cesium Ecosystem Grants. Stay tuned on our social channels to find out when it will be released in QGIS.

Cesium Ecosystem grant Badge


SLYR Update — June 2023

Welcome back, SLYR enthusiasts! We’re thrilled to share the latest updates and enhancements for our SLYR ESRI to QGIS Compatibility Suite that will dramatically streamline the use of ESRI documents within QGIS (and vice versa!). Our team has been hard at work, expanding the capabilities of SLYR to ensure seamless compatibility between the latest QGIS and ArcGIS releases. We’ve also got some exciting news for users of the Community Edition of SLYR! Let’s dive right in and explore the exciting new features that have been added to SLYR since our previous update

Converting Raster Layers in Geodatabases

We’re pleased to announce that SLYR now offers support for converting raster layers within Geodatabases. With this update, users can effortlessly migrate their raster data from ESRI’s Geodatabases to QGIS, enabling more efficient data management and analysis.

This enhancement is only possible thanks to work in the fantastic GDAL library which underpins QGIS’ raster data support. Please ensure that you have the latest version of QGIS (3.30.3 or 3.28.7 at a minimum) to make the most of this feature.

Annotation and Graphic Layer Improvements

Text Annotations along Curves

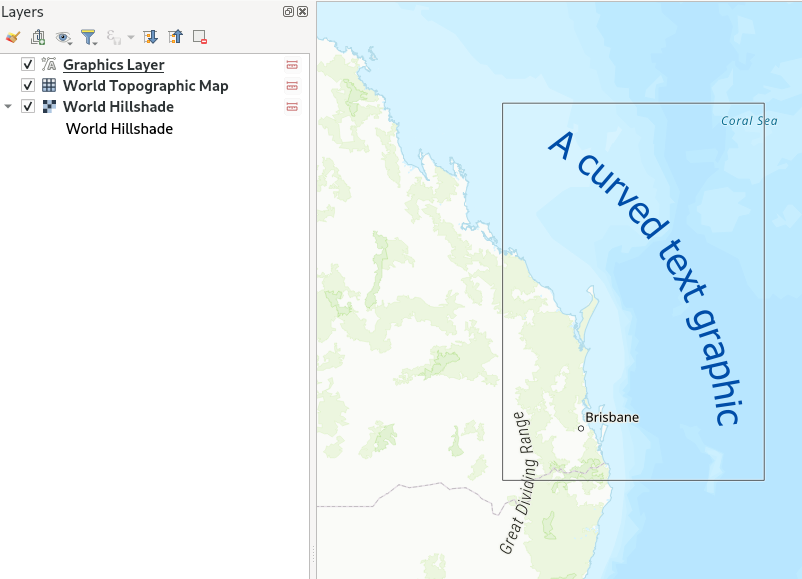
For those working with curved annotations, we’ve got you covered! SLYR now supports the conversion of text annotations along curves in QGIS. With this enhancement, you’ll get accurate conversion of any curved text and text-along-line annotations from MXD and APRX documents. This has been a long-requested feature which we can now introduce thanks to enhancements coming in QGIS 3.32.

ArcGIS Pro Graphics Layer Support

SLYR now supports the conversion of ArcGIS Pro graphics layers, converting all graphic elements to their QGIS “Annotation Layer” equivalents. If you’ve spent hours carefully designing cartographic markup on your maps, you can be sure that SLYR will allow you to re-use this work within QGIS!

Curved text graphic conversion

Enhanced Page Layout Support

We’ve further improved the results of converting ArcGIS Pro page layouts to QGIS print layouts, with dozens of refinements to the conversion results. The highlights here include:

  • Support for converting measured grids and graticules to QGIS map grids
  • Enhanced dynamic text conversions:  Now, when migrating your projects, you can expect a smoother transition for dynamic text ensuring your layouts correctly show generated metadata and text correctly
  • Support for north arrows, grouped elements, legends and table frames.

Rest assured that your carefully crafted map layouts will retain their visual appeal and functionality when transitioning to QGIS!

Improved QGIS to ArcGIS Pro Conversions

SVG Marker Exports and Symbology Size

SLYR has introduced initial support for exporting SVG markers from QGIS to ArcGIS Pro formats. SVG graphics are a component of QGIS’ cartography, and are frequently used to create custom marker symbols. Unfortunately, ArcGIS Pro doesn’t have any native support for SVG graphics for marker symbols, instead relying on a one-off conversion from SVG to multiple separate marker graphics whenever an SVG is imported into ArcGIS Pro. Accordingly, we’ve implemented a similar logic in SLYR in order to convert SVG graphics to ArcGIS Pro marker graphics transparently whenever QGIS symbology is exported to ArcGIS. This enhancement allows for a seamless transfer of symbology from QGIS, ensuring that your converted maps retain their visual integrity.

Furthermore, the update includes support for exporting QGIS symbology sizes based on “map unit” measurements to ArcGIS Pro, resulting in ArcGIS Pro symbology which more accurately matches the original QGIS versions.

Rule-Based Renderer Conversion

The “Rule Based Renderer” is QGIS’ ultimate powerhouse for advanced layer styling. It’s extremely flexible, thanks to its support for nested rules and filtering using QGIS expressions. However, this flexibility comes with a cost — there’s just no way to reproduce the same results within ArcGIS Pro’s symbology options! Newer SLYR releases will now attempt to work around this by implementing basic conversion of QGIS rule-based renderers to ArcGIS Pro layers with “display filters” attached. This allows us to convert some basic rule-based configuration to ArcGIS Pro formats.

There’s some limitations to be aware of:

  1. Only “flat” rule structures can be converted. It’s not possible to convert a nested rule structure into something representable by ArcGIS Pro.
  2. While the QGIS expression language is very rich and offers hundreds of functions for use in expressions, only basic QGIS filter expressions can be converted to ArcGIS Pro rules.

Improved Conversion of Raster and Mesh Layers

Based on user feedback, we’ve made significant improvements to the conversion of QGIS rasters and mesh layers to ArcGIS Pro formats. Expect enhanced accuracy when migrating these types of data, ensuring a closer match between your QGIS projects and their ArcGIS Pro equivalents.

New tools

The latest SLYR release introduces some brand new tools for automating your conversion workflows:

Convert LYR/LYRX Files Directly to SLD

To facilitate interoperability, SLYR has introduced algorithms that directly convert ESRI LYR or LYRX files to the “SLD” format (Styled Layer Descriptor). This feature simplifies the process of sharing and utilizing symbology between different GIS software, allowing for direct conversion of ESRI symbology for use in Geoserver or Mapserver.

Convert File Geodatabases to Geopackage

We’re thrilled to introduce a powerful new tool in SLYR that enables a comprehensive conversion of a File Geodatabase to the Geopackage format. With this feature, you can seamlessly migrate your data from ESRI’s File Geodatabase format to the versatile and widely supported GeoPackage format. As well as the raw data conversion, this tool also ensures the conversion of field domains and other advanced Geodatabase functionality to their GeoPackage equivalent, preserving valuable metadata and maintaining data integrity throughout the transition. (Please note that this tool requires QGIS version 3.28 or later.)


All these exciting additions to SLYR are available today to SLYR license holders. If you’re after one-click, accurate conversion of projects from ESRI to QGIS, contact us to discuss your licensing needs.

As described on our SLYR page, we also provide some of the conversion tools for free use via the SLYR “Community Edition”. We’re proud to announce that we’ve just hit the next milestone in the Community Edition funding, and will now be releasing all of SLYR’s support for raster LYR files to the community edition! This complements the existing support for vector LYR files and ESRI style files available in the community edition. For more details on the differences between the licensed and community editions, see our product comparison.

QGIS 3.28 improvements for working with ESRI formats and services

The QGIS 3.28 release is an extremely exciting release for all users who work in mixed software workplaces, or who need to work alongside users of ESRI software. In this post we’ll be giving an overview of all the new tools and features introduced in 3.28 which together result in a dramatic improvement in the workflows and capabilities in working with ESRI based formats and services. Read on for the full details…!

Before we begin, we’d like to credit the following organisations for helping fund these developments in QGIS 3.28:

  • Naturstyrelsen, Denmark
  • Provincie Gelderland, Netherlands
  • Uppsala Universitet, Department of Archaeology and Ancient History
  • Gemeente Amsterdam
  • Provincie Zuid-Holland, Netherlands

FileGeodatabase (GDB) related improvements

The headline item here is that QGIS 3.28 introduces support for editing, managing and creating ESRI FileGeodatabases out of the box! While older QGIS releases offered some limited support for editing FileGeodatabase layers, this required the manual installation of a closed source ESRI SDK driver… which unfortunately resulted in other regressions in working with FileGeodatabases (such as poor layer loading speed and random crashes). Now, thanks to an incredible reverse engineering effort by the GDAL team, the open-source driver for FileGeodatabases offers full support for editing these datasets! This means all QGIS users have out-of-the-box access to a fully functional, high-performance read AND write GDB driver, no further action or trade-offs required.

Operations supported by the GDAL open source driver include:

  • Editing existing features, with full support for editing attributes and curved, 3D and measure-value geometries
  • Creating new features
  • Deleting features
  • Creating, adding and modifying attributes in an existing layer
  • Full support for reading and updating spatial indexes
  • Creating new indexes on attributes
  • “Repacking” layers, to reduce their size and improve performance
  • Creating new layers in an existing FileGeodatabase
  • Removing layers from FileGeodatabases
  • Creating completely new, empty FileGeodatabases
  • Creating and managing field domains

On the QGIS side, the improvements to the GDAL driver meant that we could easily expose feature editing support for FileGeodatabase layers for all QGIS users. While this is a huge step forward, especially for users in mixed software workplaces, we weren’t happy to rest there when we  had the opportunity to further improve GDB support within QGIS!

So in QGIS 3.28 we also introduced the following new functionality when working with FileGeodatabases:

FileGeodatabase management tools

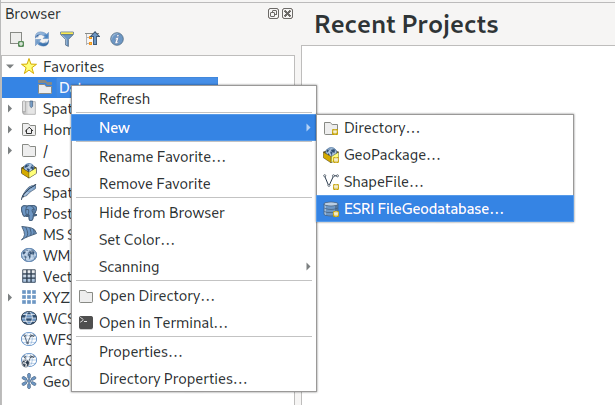
QGIS 3.28 introduces a whole range of GUI based tools for managing FileGeodatabases. To create a brand new FileGeodatabase, you can now right click on a directory from the QGIS Browser panel and select New – ESRI FileGeodatabase:

After creating your new database, a right click on its entry will show a bunch of available options for managing the database. These include options for creating new tables, running arbitrary SQL commands, and database-level operations such as compacting the database:

You’re also able to directly import existing data into a FileGeodatabase by simply dragging and dropping layers onto the database!

Expanding out the GDB item will show a list of layers present in the database, and present options for managing the fields in those layers. Alongside field creation, you can also remove and rename existing fields.

Field domain handling

QGIS 3.28 also introduces a range of GUI tools for working with field domains inside FileGeodatabases. (GeoPackage users also share in the love here — these same tools are all available for working with field domains inside this standard format too!) Just right click on an existing FileGeodatabase (or GeoPackage) and select the “New Field Domain” option. Depending on the database format, you’ll be presented with a list of matching field domain types:

Once again, you’ll be guided through a user-friendly dialog allowing you to create your desired field domain!

After field domains have been created, they can be assigned to fields in the database by right-clicking on the field name and selecting “Set Field Domain”:

Field domains can also be viewed and managed by expanding out the “Field domains” option for each database.

Relationship discovery

Another exciting addition in QGIS 3.28 (and the underlying GDAL 3.6 release) is support for discovering database relationships in FileGeodatabases! (Once again, GeoPackage users also benefit from this, as we’ve implemented full support for GeoPackage relationships via the “Related Tables Extension“).

Expanding out a database containing any relationships will show a list of all discovered relationships:

(You can view the full description and details for any of these relationships by opening the QGIS Browser “Properties” panel).

Whenever QGIS 3.28 discovers relationships in the database, these related tables will automatically be added to your project whenever any of the layers which participate in the relationship are opened. This means that users get the full experience as designed for these databases without any manual configuration, and the relationships will “just work”!

Dataset Grouping

Lastly, we’ve improved the way layers from FileGeodatabases are shown in QGIS, so that layers are now grouped according to their original dataset groupings from the database structure:

Edit ArcGIS Online / Feature Service layers

While QGIS has had read-only support for viewing and working with the data in ArcGIS Online (AGOL) vector layers and ArcGIS Server “feature service” layers for many years, we’ve added support for editing these layers in QGIS 3.28. This allows you to take advantage of all of QGIS’ easy to use, powerful editing tools and directly edit the content in these layers from within your QGIS projects! You can freely create new features, delete features, and modify the shape and attributes of existing features (assuming that your user account on the ArcGIS service has these edit permissions granted, of course). This is an exciting addition for anyone who has to work often with content in ArcGIS services, and would prefer to directly manipulate these layers from within QGIS instead of the limited editing tools available on the AGOL/Portal platforms themselves.

This new functionality will be available immediately to users upon upgrading to QGIS 3.28 — any users who have been granted edit capabilities for the layers will see that the QGIS edit tools are all enabled and ready for use without any further configuration on the QGIS client side.

Filtering Feature Service layers

We’ve also had the opportunity to introduce filter/query support for Feature Service layers in QGIS 3.28. This is a huge performance improvement for users who need to work with a subset of a features from a large Feature Service layer. Unfortunately, due to the nature of the Feature Service protocol, these layers can often be slow to load and navigate on a client side. By setting a SQL filter to limit the features retrieved from the service the performance can be dramatically increased, as only matching features will ever be requested from the backend server. You can use any SQL query which conforms to the subset of SQL understood by ArcGIS servers (see the Feature Service documentation for examples of supported SQL queries).


What’s next?

While QGIS 3.28 is an extremely exciting release for any users who need to work alongside ESRI software, we aren’t content to rest here! The exciting news is that in QGIS 3.30 we’ll be introducing a GUI driven approach allowing users to create new relationships in their FileGeodatabase (and GeoPackage!) databases.

At North Road we’re always continuing to improve the cross-vendor experience for both ESRI and open-source users through our continued work on the QGIS desktop application and our SLYR conversion suite. If you’d like to chat to us about how we can help your workplace transition from a fully ESRI stack to a mixed or fully open-source stack, just contact us to discuss your needs.

SLYR Update — November 2022

Our SLYR tool is the complete solution for full compatibility between ArcMap, ArcGIS Pro and QGIS. It offers a powerful suite of conversion tools for opening ESRI projects, styles and other documents directly within QGIS, and for exporting QGIS documents for use in ESRI software.

A lot has changed since our last SLYR product update post, and we’ve tons of very exciting improvements and news to share with you all! In this update we’ll explore some of the new tools we’ve added to SLYR, and discuss how these tools have drastically improved the capacity for users to migrate projects from the ESRI world to the open-source world (and vice versa).

ArcGIS Pro support

The headline item here is that SLYR now offers a powerful set of tools for working with the newer ArcGIS Pro document formats. Previously, SLYR offered support for the older ArcMap document types only (such as MXD, MXT, LYR, and PMF formats). Current SLYR versions now include tools for:

Directly opening ArcGIS Pro .lyrx files within QGIS

LYRX files can be dragged and dropped directly onto a QGIS window to add the layer to the current project. All the layer’s original styling and other properties will be automatically converted across, so the resultant layer will be an extremely close match to the original ArcGIS Pro layer! SLYR supports vector layers, raster layers, TIN layers, point cloud layers and vector tile layers. We take great pride in just how close the conversion results are to how these layers appear in ArcGIS Pro… in most cases you’ll find the results are nearly pixel perfect!

In addition to drag-and-drop import support, SLYR also adds support for showing .lyrx files directly in the integrated file browser, and also adds tools to the QGIS Processing Toolbox so that users can execute bulk conversion operations, or include document conversion in their models or custom scripts.

ArcGIS Pro map (mapx) and project (aprx) conversion

Alongside the LYRX support, we’ve also added support for the ArcGIS Pro .mapx and .aprx formats. Just like our existing .mxd conversion, you can now easily convert entire ArcGIS Pro maps for direct use within QGIS! SLYR supports both the older ArcGIS Pro 2.x project format and the newer 3.x formats.

Export from QGIS to ArcGIS Pro!

Yes, you read that correctly… SLYR now allows you to export QGIS documents into ArcGIS Pro formats! This is an extremely exciting development… for the first time ever QGIS users now have the capacity to export their work into formats which can be supplied directly to ESRI users. Current SLYR versions support conversion of map layers to .lyrx format, and exporting entire projects to the .mapx format. (We’ll be introducing support for direct QGIS to .aprx exports later this year.)

We’re so happy to finally provide an option for QGIS users to work alongside ArcGIS Pro users. This has long been a pain point for many organisations, and has even caused organisations to be ineligible to tender for jobs which they are otherwise fully qualified to do (when tenders require provision of data and maps in ArcGIS compatible formats).

ArcGIS Pro .stylx support

Alongside the other ArcGIS Pro documents, SLYR now has comprehensive support for reading and writing ArcGIS Pro .stylx databases. We’ve dedicated a ton of resources in ensuring that the conversion results (both from ArcGIS Pro to QGIS and from QGIS to ArcGIS Pro) are top-notch, and we even handle advanced ArcGIS Pro symbology options like symbol effects!

Take a look below how even very advanced ArcGIS Pro style libraries convert beautifully to QGIS symbol libraries:

ArcMap Improvements

While we’ve been focusing heavily on the newer ArcGIS Pro formats, we’ve also improved our support for the older ArcMap documents. In particular, SLYR now offers more options for converting ArcMap annotation layers and annotation classes to QGIS supported formats. Users can now convert Annotation layers and classes directly over to QGIS annotation layer or alternatively annotation classes can be converted over to the OGC standard GeoPackage format. When exporting annotation classes to GeoPackage the output database is automatically setup with default styling rules, so that the result can be opened directly in QGIS and will be immediately visualised to match the original annotation class.

Coming soon…

While all the above improvements are already available for all SLYR license holders, we’ve got many further improvements heading your way soon! For example, before the end of 2022 we’ll be releasing another large SLYR update which will introduce support for exporting QGIS projects directly to ArcGIS Pro .aprx documents. We’ve also got many enhancements planned which will further improve the quality of the converted documents. Keep an eye on this blog and our social media channels for more details as they are available…

You can read more about our SLYR tool at the product page, or contact us today to discuss licensing options for your organisation.


Creating circular insets and other fun QGIS layout tricks

Thanks to the recent popularity of the “30 Day Map Challenge“, the month of November has become synonymous with beautiful maps and cartography. During this November we’ll be sharing a bunch of tips and tricks which utilise some advanced QGIS functionality to help create beautiful maps.

One technique which can dramatically improve the appearance of maps is to swap out rectangular inset maps for more organic shapes, such as circles or ovals.

Back in 2020, we had the opportunity to add support for directly creating circular insets in QGIS Print Layouts (thanks to sponsorship from the City of Canning, Australia!). While this functionality makes it easy to create non-rectangular inset maps the steps, many QGIS users may not be aware that this is possible, so we wanted to highlight this functionality for our first 30 Day Map Challenge post.

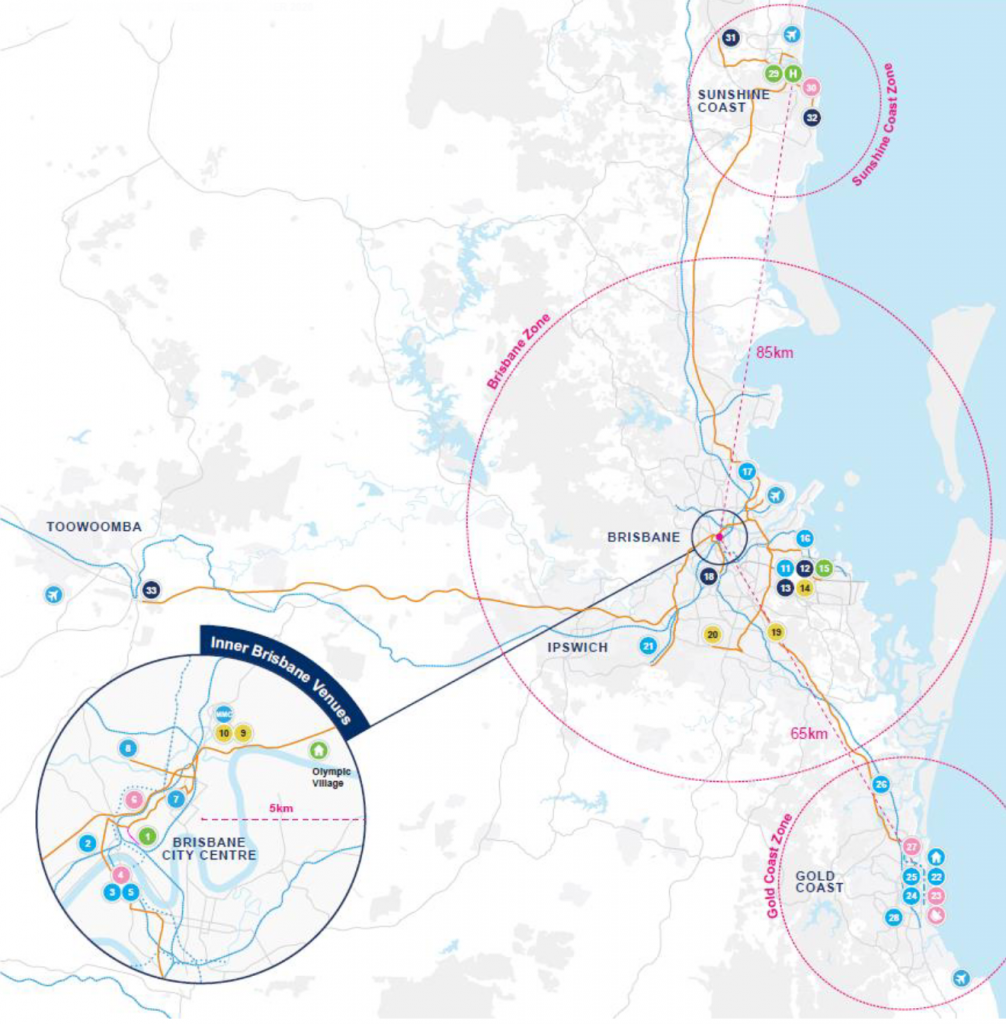
Let’s kick things off with an example map. We’ve shown below an extract from the 2032 Brisbane Olympic Bid that some of the North Road team helped create (on behalf of SMEC for EKS). This map is designed to highlight potential venues around South East Queensland and the travel options between these regions:

Venue Masterplan Brisbane 2032 Olympics
Venue Masterplan for 2032 Olympic Games, IOC Feasibility Assessment – Olympic Games, Brisbane February 2021

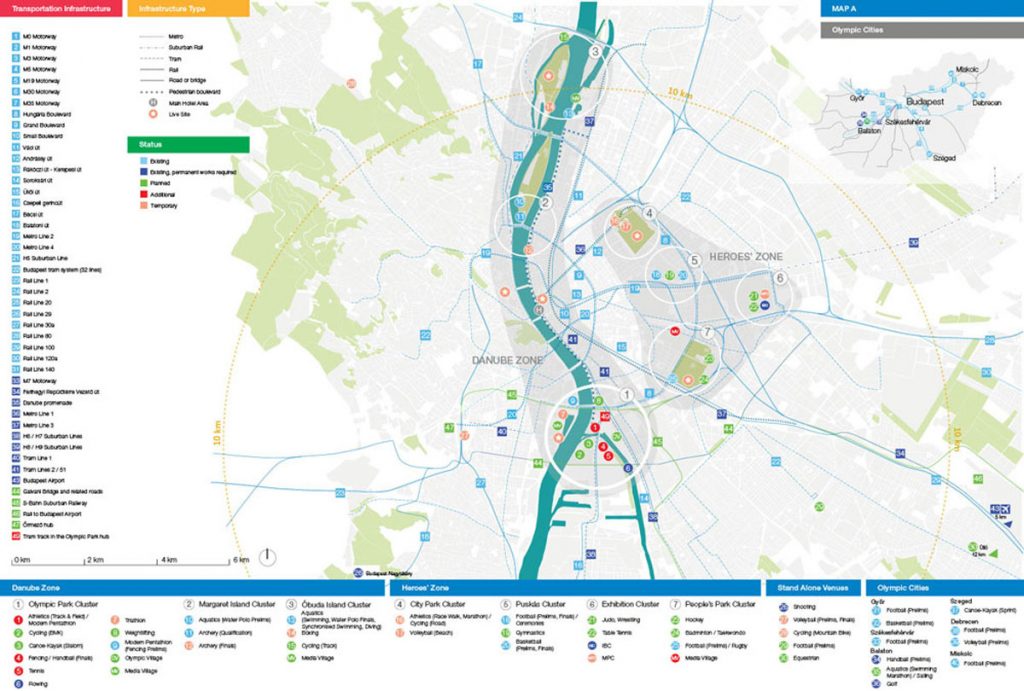
Circles featured heavily in previous Olympic bid maps (such as Budapest) where we took our inspiration from. This may, or may not, play a part in using the language of the target map audience – think Olympic rings!

Budapest Olympics 2024 MasterplanBudapest Olympics 2024 Masterplan


Step by Step Guide to Creating a Circle Inset

Firstly, prepare a print layout with both a main map and an inset map. Make sure that your inset map is large enough to cover your circular shape:

From the Print Layout toolbar, click on the Add Shape button and then select Add Ellipse:

Draw the ellipse over the middle of your inset map (hint: holding down Shift while drawing the ellipse will force it to a circular shape!). If you didn’t manage to create an exact circle then you can manually specify the width and height in the shape item’s properties. For this one, we went with a 50mm x 50mm circle:

Next, select the Inset Map item and in its Item Properties click on the Clipping Settings button:

In the Clipping Settings, scroll down to the second section and tick the Clip to Item box and select your Ellipse item from the list. (If you have labels shown in your inset map you may also want to check the “force labels inside clipping shape” option to force these labels inside the circle. If you don’t check this option then labels will be allowed to overflow outside of the circle shape.)

Your inset map will now be bound to the ellipse!

Here’s a bit more magic you could add to this map – in the Main Map’s properties, click on Overviews and set create one for the Inset map – it will nicely show the visible circular area and not the rectangle!

Bonus Points: Circular Title Text!

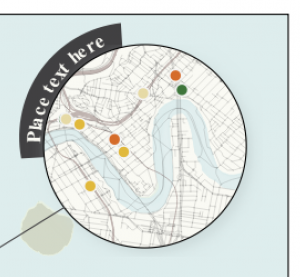
For advanced users, we’ve another fun tip…and when we say fun, we mean ‘let’s play with radians’! Here we’re going to create some title text and a wedged background which curves around the outside of our circular inset. This takes some fiddly playing around, but the end result can be visually striking! Here we’re going to push the QGIS print layout “HTML” item to create some advanced graphics, so some HTML and CSS coding experience is advantageous. (An alternative approach would be to use a vector illustration application like Inkscape, and add your title and circular background as an SVG item in the print layout).

We’ll start by creating some curved circular text:

First, add a “HTML frame” to your print layout:

HTML frames allow placement of dynamic content in your layouts, which can use HTML, CSS and JavaScript to create graphical components.

In the HTML item’s “source” box, add the following code:

<svg height="300" width="350">
        <defs>
            <clipPath id="circleView">
                <circle id="curve" cx="183" cy="156" r="25" fill="transparent" />
            </clipPath>
        </defs>
        <path id="forText" d="M 28,150, C 25,50, 180,-32,290,130" stroke="" fill="none"/>
            <text x="0" y="35" width="100">
                <textpath xlink:href="#forText">
                    <tspan font-weight="bold" fill="black">Place text here</tspan>
                </textpath>
            </text>
             <style>
    <![CDATA[
      text{
        dominant-baseline: hanging;
        font: 20px Arial;
      }
    ]]>
  </style>
</svg>

Now, let’s add in a background to bring more focus onto the title!

To add in the background, create another HTML item. We’ll again create the arc shape using an SVG element, so add the following code into the item’s source box:

<svg width="750" height="750" xmlns="http://www.w3.org/2000/svg">
  <path d="M 90 70
           A 56 56, 0, 0, 0, 133 140
           L 150 90 Z" fill="#414042" transform=" scale(2.1) rotate(68 150 150) " />/>
</svg>

(You can read more about SVG  curves and arcs paths over at MDN)

So there we go! These two techniques can help push your QGIS map creations further and make it easier to create beautiful cartography directly in QGIS itself. If you found these tips useful, keep an eye on this blog as we post more tips and tricks over the month of November. And don’t forget to follow the 30 day Map Challenge for a smorgasbord of absolutely stunning maps.

Crowd funding alert: Point Clouds, Elevation Profiles and 3D Map view improvements!

Together with our partners at Lutra Consulting and Hobu, we have once again have collated your feature requests for even MORE point cloud and QGIS elevation improvements and are ready to start working on them!

Here’s a taster of what to expect if our latest crowd funding campaign is successful:

  • Point cloud data management, transformation and analysis via incorporation of PDAL within the QGIS “Processing” toolbox
  • Optimised handling of large datasets to speed up your 3D maps, including dynamic data loading for complex 3D scenes
  • Combine multiple LAS/LAZ point cloud files into a single “virtual” point cloud for easy data management and display
  • Elevation profile tool embedded into print layouts, totally customizable, more efficient and with the ability to export profile data to CSV and DXF
  • General improvements to QGIS 3D map views, including an enhanced 3D measuring tool, additional camera controls and improving the configuration dialog options and functionality.

To find out more, check out the ‘Detailed proposal and deliverables’ section on the main crowd funding page. You may want to get some popcorn ready, it really is exciting!

We need your help to make this work possible. If you’d like to see these enhancements, pledge to the crowdfunding campaign before October 24, 2022.

Securely accessing ArcGIS Online (AGOL) and enterprise ArcGIS Portal sites through QGIS (2022 update!)

We’re often contacted for advice regarding our recommendations for securely accessing content on ArcGIS Online (AGOL) or enterprise ArcGIS Portal deployments from within QGIS. While we ran through our recommended setup in an older post, we thought it was time for a 2022 update for our recommendations. In this version we’ve updated some of the descriptions and screenshots for newer QGIS releases, and have added explicit instructions on accessing ArcGIS Online content too.

This post details step-by-step instructions in setting up both AGOL/ArcGIS Portal and QGIS to enable this integration. First, we’ll need to create an application on the server in order to enable QGIS users to securely authenticate with the server. The process for this varies between AGOL and ArcGIS Portal, so we’ve separated the guidelines into two sections below:

ArcGIS Portal

Creating an application

Logon to the Portal, and from the “Content” tab, click the “Add Item” option. Select “An application” from the drop down list of options:

Set the type of the application as “Desktop

You can fill out the rest of this dialog as you see fit. Suggested values are:

  • Purpose: Ready to Use
  • Platform: Qt
  • URL: https://qgis.org
  • Tags: QGIS, Desktop, etc

Now – here comes a trick. Portal will force you to attach a file for the application. It doesn’t matter what you attach here, so long as it’s a zip file. While you could attach a zipped copy of the QGIS installer, that’s rather wasteful of server space! We’d generally just opt for a zip file containing a text file with a download link in it.

Click Add Item when you’re all done filling out the form, and the new application should be created on the Portal.

Registering the Application

The next step is to register the application on Portal, so that you can obtain the keys required for the OAuth2 logon using it. From the newly created item’s page, click on the “Settings” tab:

Scroll right to the bottom of this page, and you should see a “Register” button. Press this. Set the “App type” to “Native“.

Add two redirect URIs to the list (don’t forget to click “Add” after entering each!):

  1. The Portal’s public address, e.g. https://mydomain.com/portal
  2. http://127.0.0.1:7070

Finally, press the “Register” button in the dialog. If all goes well then the App Registration section in the item settings should now be populated with details. From here, copy the “App ID” and “Secret” strings, we’ll need these later:

Determine Request URLs

One last configuration setting we’ll need to determine before we fire up QGIS is the Portal’s OAuth Request and Token URLs. These are usually found by appending /sharing/rest/oauth2/authorize and /sharing/rest/oauth2/token to the end of your Portal’s URL.

For instance, if your public Portal URL is http://mydomain.com/portal, then the URLs will be:

Request URL: http://mydomain.com/portal/sharing/rest/oauth2/authorize
Token URL: http://mydomain.com/portal/sharing/rest/oauth2/token

You should be able to open both URLs directly in a browser. The Request URL will likely give a “redirect URL not specified” error, and the Token URL will give a “client_id not specified” error. That’s ok — it’s enough to verify that the URLs are correct.

When this is all done we can skip ahead to the client-side configuration below.

ArcGIS Online (AGOL)

Registering an application on AGOL must be done by an account administrator. So first, we’ll logon to AGOL using an appropriate account, and then head over to the “Content” tab. We’ll then hit the “New Item” button to start creating our application:

From the available item types select the “Application” option:

We’ll then select the “Mobile” application type, and enter “https://qgis.org” as the application URL (it actually doesn’t matter what we enter here!):

Lastly, we can enter a title for the application and complete all the metadata options as desired, then hit the “Save” button to create the application. AGOL should then take us over to the applications content page (if not, just open that page manually). From the application summary page, click across to the “Settings” tab:

Scroll right down to the “Credentials” section at the bottom of this page and click the “Register application” button:

Enter the following “Redirect URLs”, by copying each value and then hitting “Add”

  • localhost
  • http://127.0.0.1:7070
  • https://127.0.0.1:7070

Set the “Application environment” to Browser and then click “Register” button to continue:

You’ll be taken back to the application Settings page, but should now see an Client ID value and option to show the Client Secret. Copy the “Client ID” and “Client Secret” (there’s a “copy to clipboard” button for this) as we’ll need these later:

We’re all done on the AGOL side now, so it’s time to fire up QGIS!

Creating an QGIS OAuth2 Authentication Configuration

From your QGIS application, select Options from the Settings menu. Select the Authentication tab. We need to create a new authentication configuration, so press the green + button on the right hand side of the dialog. You’ll get a new dialog prompting you for Authentication details.

You may be asked to create a “Master Password” when you first create an authentication setup. If so, create a secure password there before continuing.

There’s a few tricks to this setup. Firstly, it’s important to ensure that you use the exact same settings on all your client machines. This includes the authentication ID field, which defaults to an auto-generated random string. (While it’s possible to automatically deploy the configuration as part of a startup or QGIS setup script, we won’t be covering that here!).

So, from the top of the dialog, we’ll fill in the “Name” field with a descriptive name of the Portal site. You then need to “unlock” the “Id” field by clicking the little padlock icon, and then you’ll be able to enter a standard ID to identify the Portal. The Id field is very strict, and will only accept a 7 letter string! Since you’ll need to create a different authentication setup for each individual ArcGIS Portal site you access, make sure you choose your ID string accordingly. (If you’re an AGOL user, then you’ll only need to create one authentication setup which will work for any AGOL account you want to access).

Drop down the Authentication Type combo box, and select “OAuth2 Authentication” from the list of options. There’s lots of settings we need to fill in here, but here’s what you’ll need:

  • Grant flow: set to “Authorization Code”
  • Request URL: 
    • For ArcGIS Portal services: enter the Request URL we determined in the previous step, e.g. http://mydomain.com/portal/sharing/rest/oauth2/authorize
    • For AGOL services: enter https://www.arcgis.com/sharing/rest/oauth2/authorize
  • Token URL:
    • For ArcGIS Portal services: enter the Token URL from the previous step, e.g. http://mydomain.com/portal/sharing/rest/oauth2/token
    • For AGOL services: enter https://www.arcgis.com/sharing/rest/oauth2/token
  • Refresh Token URL: leave empty
  • Redirect URL: leave as the default http://127.0.0.1:7070 value
  • Client ID: enter the App ID (or Client ID) from the App Registration information (see earlier steps)
  • Client Secret: enter the App Secret (or Client Secret) from the App Registration information (see earlier steps)
  • Scope: leave empty
  • API Key: leave empty
  • For AGOL services only: you’ll also need to set the “Token header” option under the “Advanced” heading. This needs to be “X-Esri-Authorization” (without the quotes!)

That’s it — leave all the rest of the settings at their default values, and click Save.

You can close down the Options dialog now.

Adding the Connection Details

Lastly, we’ll need to setup the server connection as an “ArcGIS Rest Server Connection” in QGIS. This is done through the QGIS “Data Source Manager” dialog, accessed through the Layer menu. Click the “ArcGIS REST Server” tab to start with, and then press “New” in the Server Connections group at the top of this dialog.

Enter a descriptive name for the connection, and then enter the connection URLs. These will vary depending on whether you’re connecting to AGOL or an ArcGIS Portal server:

ArcGIS Online Connection

  • URL: This will be something similar to “https://services###.arcgis.com/########/arcgis/rest/services/”, but will vary organisation by organisation. You can determine your organisation’s URL by visiting the overview page for any dataset published on your AGOL account, and looking under the “Details” sidebar. Copy the address from the “Source: Feature Service” link and it will contain the correct URL parameters for your organisation. (Just make sure you truncate the link to end after the “arcgis/rest/services” part, you don’t require the full service endpoint URL)
  • Community endpoint URL: https://www.arcgis.com/sharing/rest/community
  • Content endpoint URL: https://www.arcgis.com/sharing/rest/content

ArcGIS Portal Connection

  • URL:  the REST endpoint associated with your Portal, e.g. “https://mydomain.com/arcgis/rest/services”
  • Community endpoint URL (optional): This will vary depending on the server setup, but will generally take the form “https://mydomain.com/portal/sharing/rest/community”
  • Content endpoint URL (optional): This will vary depending on the server setup, but will generally take the form “https://mydomain.com/portal/sharing/rest/content”

Lastly, select the new OAuth2 configuration you just created under the “Authentication” group:

Click OK, and you’re done! When you try to connect to the newly added connection, you’ll automatically be taken to the AGOL or ArcGIS Portal’s logon screen in order to authenticate with the service. After entering your details, you’ll then be connected securely to the server and will have access to all items which are shared with your user account!

We’ve regularly use this setup for our enterprise clients, and have found it to work flawlessly in recent QGIS versions. If you’ve found this useful and are interested in other “best-practice” recommendations for mixed Open-Source and ESRI workplaces, don’t hesitate to contact us to discuss your requirements… at North Road we specialise in ensuring flawless integration between ESRI based systems and the Open Source geospatial software stack.

Mixed Format Labels in QGIS — coming soon!

For the QGIS 3.28 release North Road had the exciting opportunity to add some much desired new functionality to QGIS: the ability to mix font formatting and styles within a single map label! This enhancement was funded by the Swiss QGIS User Group, and offers a whole range of new cartographic possibilities for all QGIS users. Read on for more details on how this can impact your mapping…

QGIS has long supported the ability to combine different values inside a label for a feature, via the use of custom QGIS expressions. For example, the map below labels features from a rail station layer with the expression

"NAME" || '\n' || "PATRONAGE"

This expression concatenates the field values inside the “NAME” field with their “PATRONAGE” values, using a new line character to separate the two values. The end result looks something like this:

While custom expressions are extremely flexible and offer an almost unlimited range of possibilities to tweak label content, the limitation has been that all of this label text will always be displayed using a single font, font size, and font style. For example, there was no capacity to show the station names in a larger, bold font, and the patronage values in a smaller size.

That’s all changing thanks to the funding from the QGIS Swiss User Group! Now, in QGIS 3.28, users can combine label text with HTML formatting tags in order to customise exactly how each individual word or character in the label is drawn. Let’s revisit the map shown above and flex these new cartographic muscles…

The first thing we need to do is enable the HTML formatting tags for our labels by checking the “Allow HTML formatting” option in the text properties:

With this option enabled, we can now use a range of HTML and CSS tags to format individual parts of our label. For instance, “<b>bold text</b>” will show the text between the <b> and </b> tags in a bold font. By revising our previous labelling expression we can now get the station names to render in a bold font. Here’s the revised expression:

'<b>' || "NAME" || '</b><p>' || "PATRONAGE"

There’s one other important change we’ve made in the above expression. When using HTML formatting for labels, we need to replace the ‘\n’ newline character with the HTML new paragraph tag “<p>”. Otherwise, our expression is very similar to the previous one, with the exception that we’re wrapping the “NAME” field in <b>…</b> tags.

Here’s how it looks:

That’s already a dramatic improvement in the readability of the map! Let’s try refining it further by dropping down the font size of the patronage values. We can do that by inserting some CSS into the label string, specifically the “font-size” property. Here’s our new expression:

'<b>' || "NAME" || '</b><p><span style="font-size: 10pt">' || "PATRONAGE" || '</span>'

It’s so beautiful now! (Go on, scroll back up to our original map, we dare you to compare!).

So which HTML/CSS formatting options are supported? For QGIS 3.28, these options are:

  • Font family, via the CSS font-family tag. E.g. <span style=”font-family: Comic Sans MS”>…</span>
  • Font size, via the CSS font-size tag. E.g. <span style=”font-size: 30pt”>…</span>
  • Font weights, via the HTML <b> tag or CSS font-weight tag
  • Italic, via the HTML <i> tag or CSS “font-style: italic”
  • Font color, via the CSS “color: #rrggbb” tag
  • Underline, via the HTML <u> tag or CSS “text-decoration: underline” tag
  • Strikethrough, via the HTML <s> tag or CSS “text-decoration: line-through” tag
  • Overline, via the CSS “text-decoration: overline” tag

Oh, one last thing we nearly forgot to mention: all these wonderful styling options also apply perfectly to curved label text!

Our thanks go out to the members of the Swiss QGIS User Group for funding this feature! It’s an exciting addition to QGIS and can offer new ways to dramatically improve your mapping creations.

Got any QGIS needs you’d like to discuss? Or want to see additional formatting options added in a future QGIS release? Just contact our friendly team to discuss your needs — we’d love to assist!

Introducing Annotation Layers in QGIS 3.22!

The QGIS 3.22 release is just around the corner, and we’d love to introduce you to one of the exciting changes included in this version. Just like all QGIS major releases, 3.22 brings a whole swag of improvements designed to enhance and simplify your mapping needs. In this post we’ll be highlighting one of these improvements — “Annotation Layers”. Before we dive further in, we need to extend our heartfelt thanks to the Swiss QGIS User Group who provided the funding required for this work. The Swiss User Group has invested heavily in cartographic enhancements to QGIS over many years, and it’s great to see this tradition continue for the 3.22 release!

So… let’s dive into Annotation Layers in QGIS 3.22, and what this new functionality allows you to do! Before we can get started, we’ll need to enable the new “Annotations” toolbar (it’s hidden by default). You can do this through the “View” – “Toolbars” menu by checking the “Annotations Toolbar” option. This will show a new toolbar, full of useful actions for creating and working with annotation layers:

The new Annotations toolbar

Annotation layers can contain a whole mix of different annotation types. In QGIS 3.22 this includes markers, lines, polygons and text. (We anticipate this list will grow steadily in future QGIS releases!)

Annotation item types


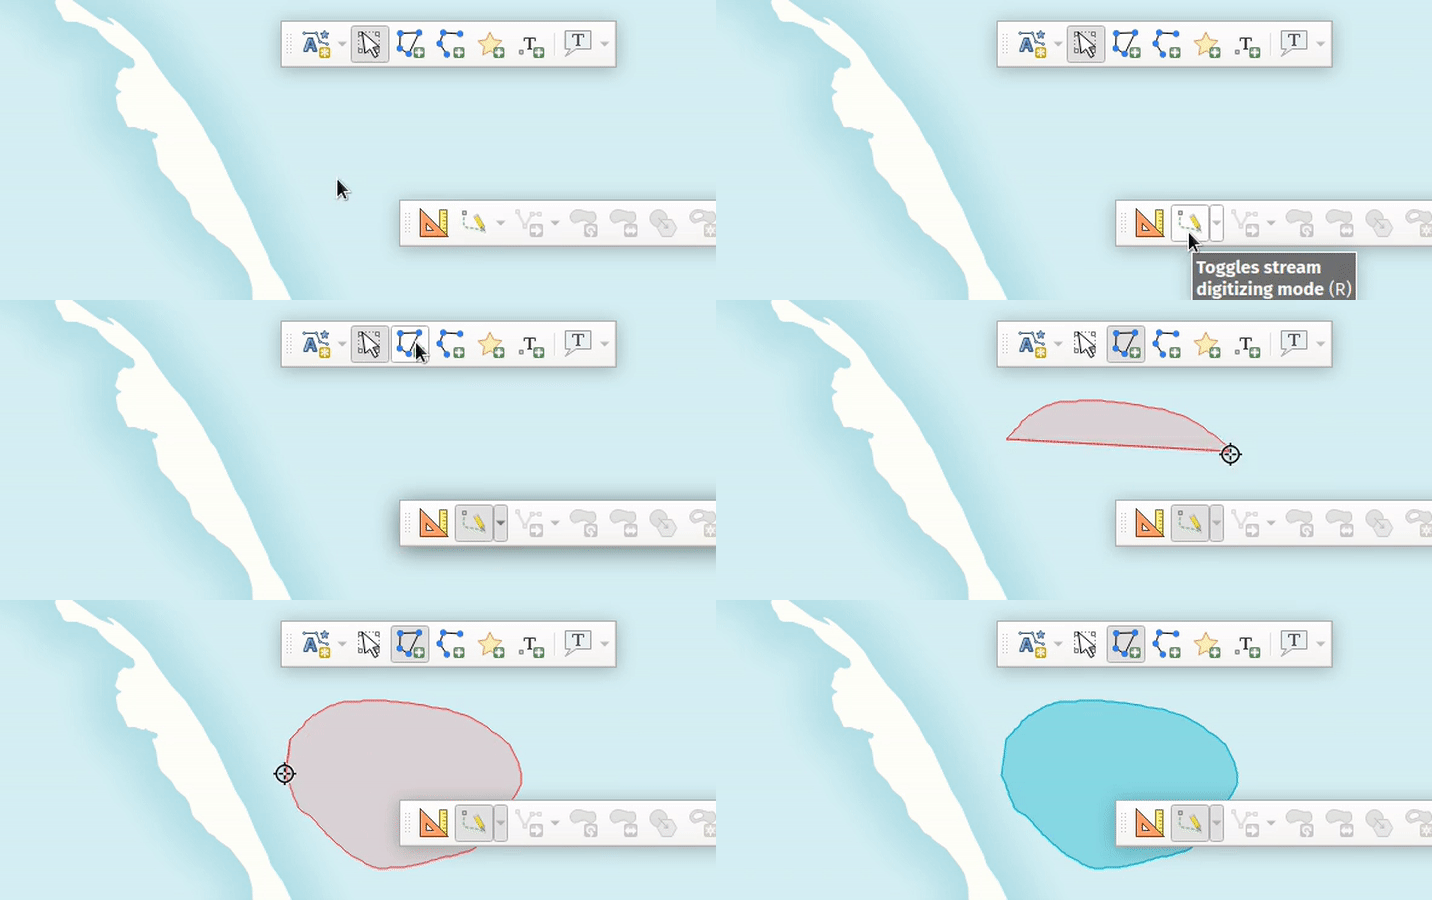
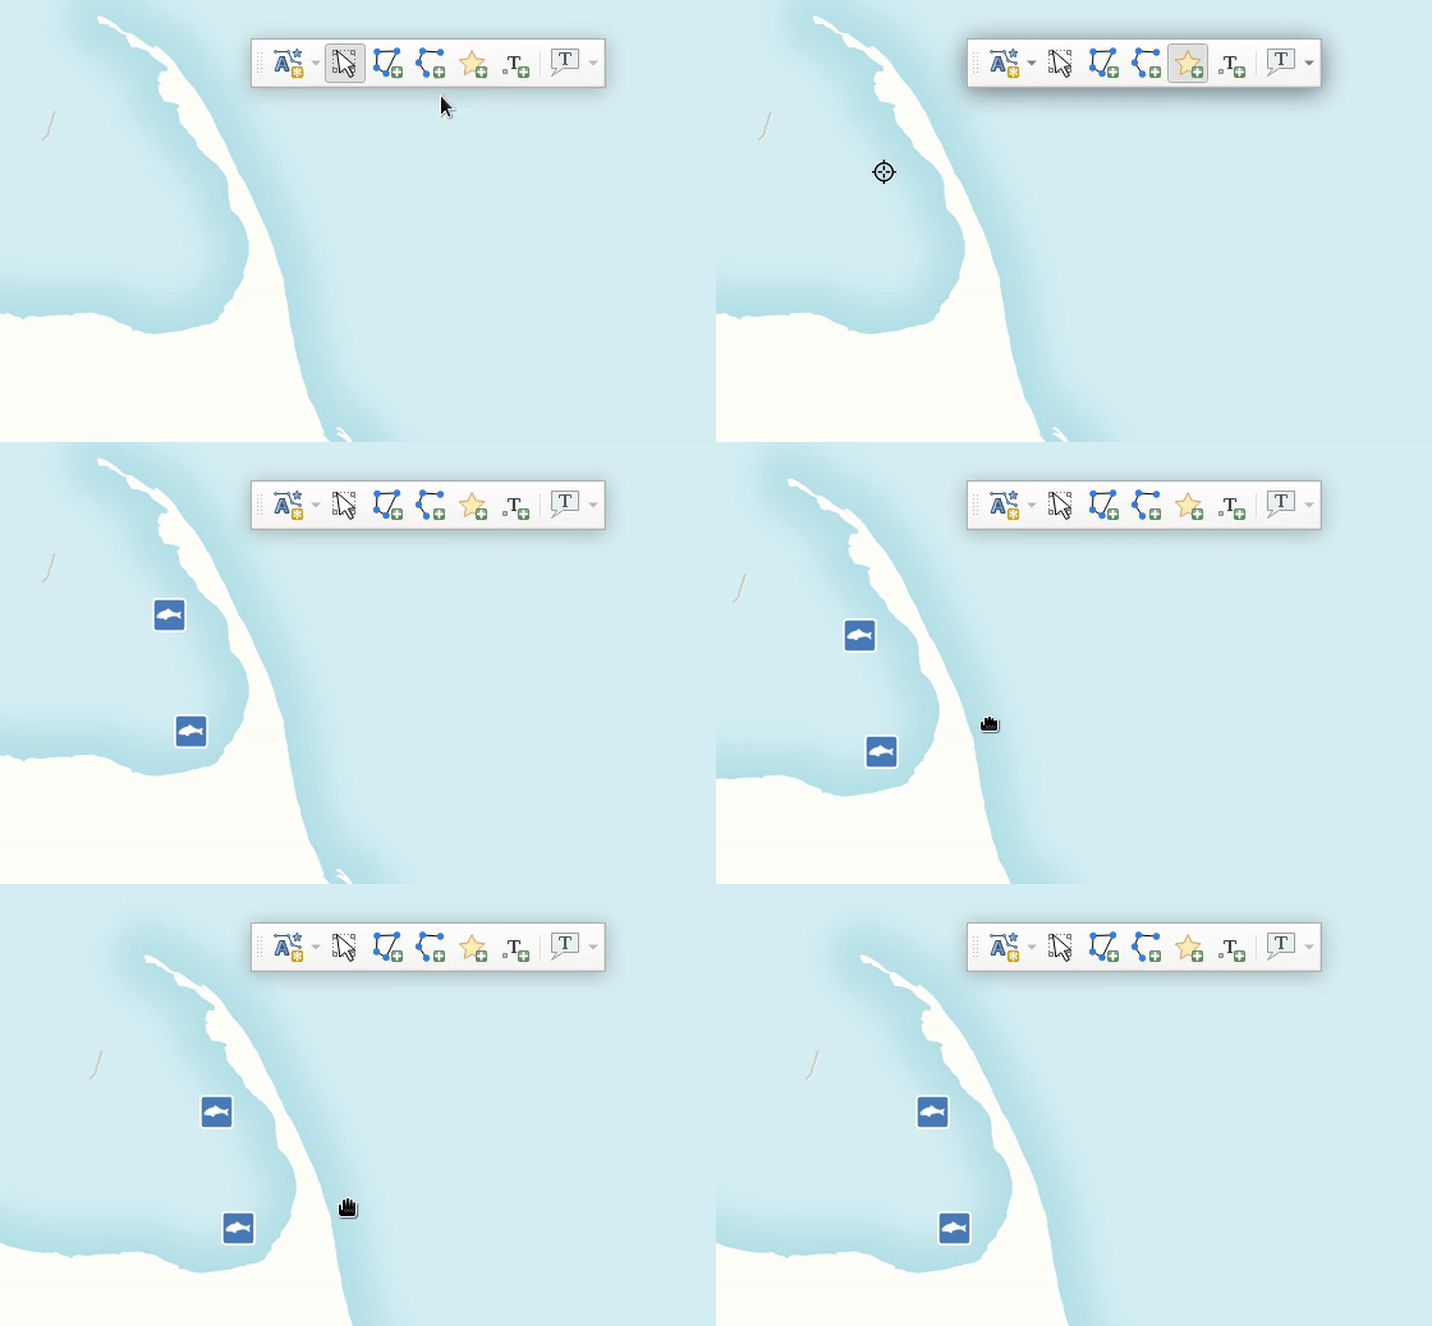
Creating an annotation is as easy is picking the desired item type (marker, line, polygon or text), and then drawing directly onto your map:

All the usual QGIS shortcuts for creating features apply when creating annotation items. A line or polygon annotation is drawn by left-clicking once for each vertex, with a final right mouse click to complete the shape. Snapping can be enabled while you draw, you can use the “Advanced Digitizing Tools” to precisely place vertices, and even switch the drawing tools to the streaming mode for completely free-form shapes!

Creating a polygon annotation using stream digitizing

While annotations are created in this free-form way, every annotation item is still completely geo-referenced and tied to a particular geographic location. Moving your map, changing the scale or changing projection won’t cause your annotations to jump around the map. Rather, they’ll be locked in place to the location you’ve drawn them:

Annotations are tied to a geographic location

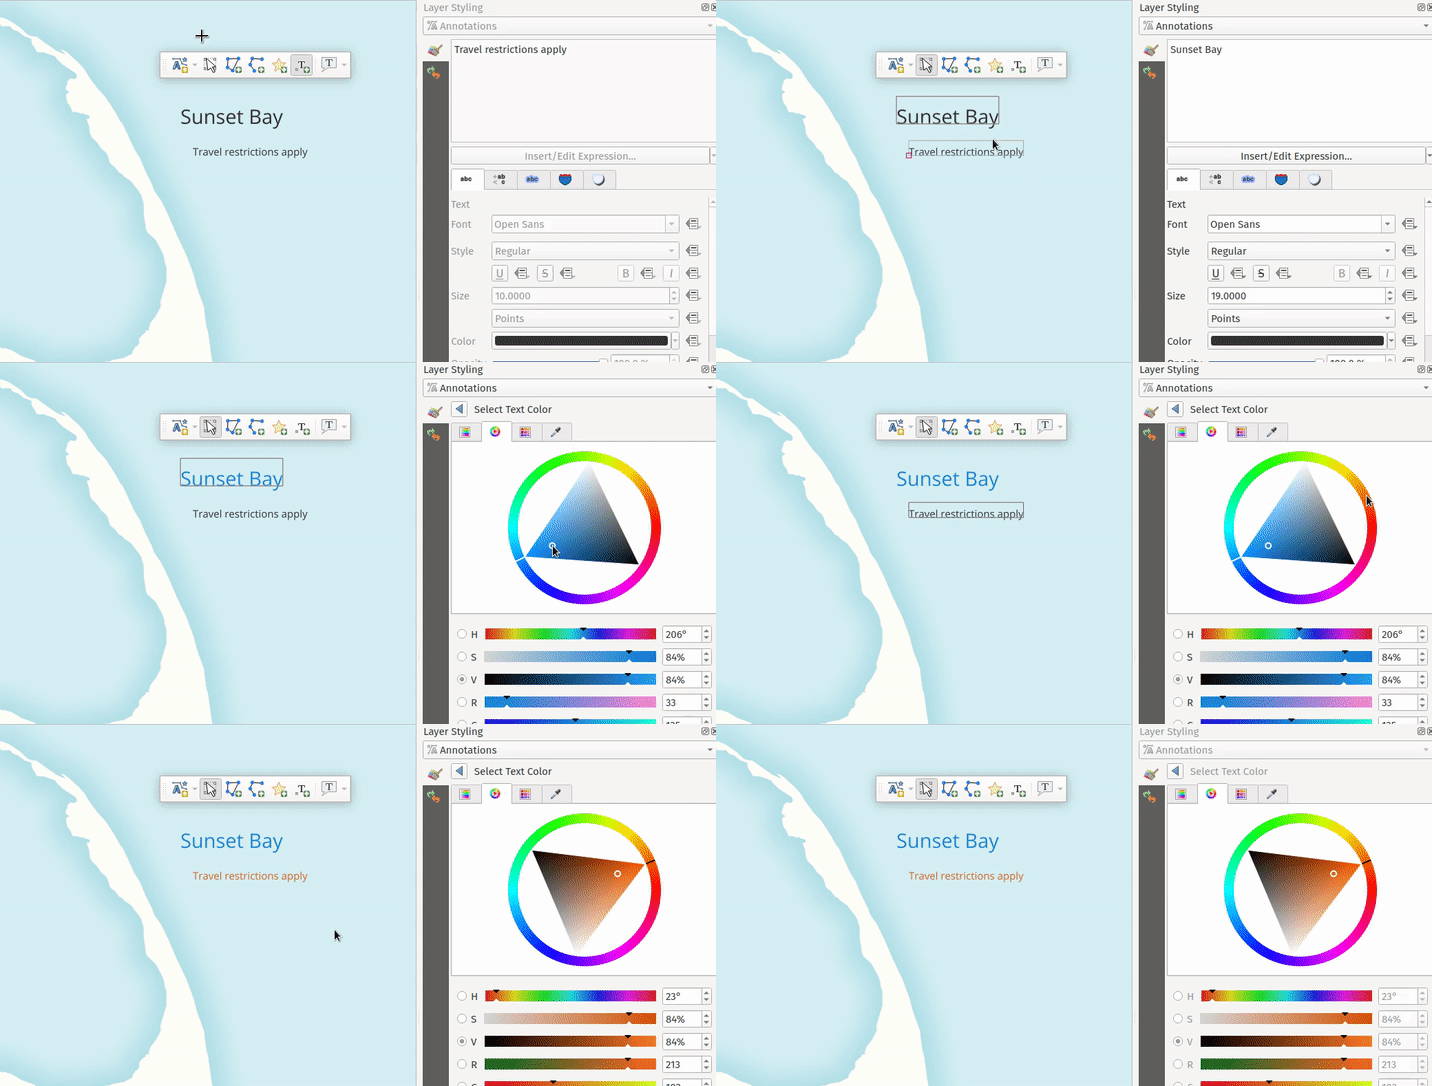
Unlike features in a traditional vector layer, it’s easy to interactively style annotation items on an item-by-item basis. (This is what makes them a great tool to help quickly create beautiful maps!). All the item appearance properties are set through the QGIS “Layer Styling” dock, which allows you to interactively tweak an item’s appearance without any annoying dialog windows getting in your way. Annotation items support all of QGIS’ rich symbology and labelling options, including layer effects (drop shadows, inner/outer glows), blending modes (multiply, overlay, etc), opacity, and even data-driven symbol property overrides!

Modifying items

Unlike traditional vector or raster (or mesh, or point cloud!) layers, an annotation layer isn’t linked to any external dataset. They exist within a single QGIS project only, so they are perfect for project-specific markups and cartographic notes. By default, any newly created annotation item will be placed on top of all your other map content. (Formally, they are added into a “main annotation layer” which is always drawn on the very top of the map.) This main annotation layer is a special beast, and you won’t see it listed alongside all the other layers in your project. If you need to interact with it, say to change a layer-level setting like the opacity or blend mode, just select the “Main Annotation Layer Properties” option from the annotations toolbar:

Setting the main annotation layer properties


In addition to this special main annotation layer, it’s also possible to create your own secondary annotation layers. From the annotations toolbar, select the “New Annotation Layer” option and a brand new annotation layer will be added to your project. Unlike the main annotation layer, you’ll see any secondary annotation layers appear in the list of your project’s layers. Just like any other map layer, you can toggle their visibility, rename them, and even reposition them to control whether the annotations show above or below particular layers in your map!

Creating a new annotation layer

(Note that whenever you have a secondary annotation layer selected as the current layer, any newly drawn annotation items will be placed into this layer instead of the main annotation layer.)

So there we go — that’s a quick dive into annotation layers in QGIS 3.22, and some of the new cartographic capabilities they unlock for your maps! We see this as the starting point of an exciting journey, and North Road developers have many plans for further enhancement of annotation layers in future QGIS releases. (And naturally, we’ve also added full support for ArcGIS drawings to QGIS annotation layer conversion to our SLYR ESRI conversion toolkit!) If you’ve something specific you’d love to see added to annotations layers, just contact us at [email protected] to discuss sponsorship options.


Line Label Placement: Our gift to the QGIS community!

If you’re a follower of North Road’s social media accounts, it probably comes as no surprise to hear that we love sharing regular tips and useful suggestions about working with spatial data on these channels. Recently, we realised we were close to a new milestone of 4k followers of our Twitter stream. This milestone gave us the perfect excuse to give something back to all these followers! So we ran a little promo, where we promised that if we hit 4k followers we’d implement a new feature in QGIS, as determined by a popular vote:

Given we’ve now reached the target milestone, it was our turn to deliver! So we’re proud to introduce a new feature coming in QGIS 3.16: the ability to control exactly where labels are positioned along line feature! Let’s take a look!…

In previous QGIS releases, whenever labels are enabled for a line layer these labels will automatically gravitate towards the center of the line features:

In certain situations, it’s desirable for these labels to be positioned in specific positions along these line features (e.g. at the start of lines, or at the end of lines). With this new feature gift to the community, QGIS users have to option to precisely control the label placement for these lines:


There’s new options for placing the labels at the start of lines, end of lines, or at a custom offset along the line.

This option can be super-handy when combined with Rule Based Labelling, as it allows you to have different labels at the start versus end of lines:

So there we go! Another great QGIS cartography enhancement, heading your way in QGIS 3.16, and just a little thank you back to the community for all your support of North Road.

And if you’re not following us on social media yet, it’s a great to start… because who knows when our next little giveaway will be?!


Announcing the Point Cloud Data in QGIS Crowdfunding Campaign!

With the recent advancements in LiDAR survey technology and photogrammetry there has been a huge demand in capturing and storing point cloud data. Point cloud data are vector in nature, but are usually orders of magnitude larger than a standard vector layer. Typical vector datasets range from thousands to millions of features, while point clouds range from millions to billions or even trillions of points. Due to this sheer number of points a completely different approach to visualise, analyse and store point clouds is needed in a GIS platform.

Integrating a point cloud viewer in a desktop GIS application adds a lot of value for users compared to a specialised and dedicated point cloud viewer:

  • Point cloud data can be visualised, compared, and analysed alongside other types of spatial data (including vector, raster and mesh layers)
  • A familiar user interface and workflows
  • Integration with analytical tools to quickly create derived datasets

Despite these benefits, current versions of the QGIS desktop application do not support visualisation of point cloud data. With our partners at Lutra Consulting and Hobu, we have decided to bridge this missing gap and add point cloud support in QGIS, and are launching a new crowdfunding campaign to fund this work!

Head on over to the official crowd funding page here for the full details of the campaign, and for details on how you can contribute and make this work a reality.

Announcing SLYR Community Edition

North Road are proud to announce the official release of SLYR Community Edition, a new open-source version of our powerful SLYR ESRI to Open Source compatibility suite. The Community Edition is available for download from the official QGIS plugin repository today, for QGIS versions 3.4 and above. It supports automated conversion of ESRI .style symbol databases, including conversion of markers, fills, line styles and color ramps to their closest QGIS symbology equivalent, allowing users to instantly transition their style libraries into QGIS!

If you’ve followed our work in the past, it will come as no surprise to hear that North Road are passionate about open source geospatial, and for reducing the barriers which users encounter when moving to open-source software. We see our SLYR tool as an integral part of this process, and the licensed version of the plugin currently supports automated conversion of MXD, LYR, PMF, and other ESRI-specific formats to QGIS documents.

Our intention all along has been to make this tool freely available for all users of open-source geospatial software, and to release our work under a permissive, open-source license so that other projects can take advantage of our reverse engineering efforts. That’s why we made an “open source pledge” a fundamental part of our SLYR tool development! By the terms of this pledge, exactly six months after we hit staged preset funding levels we will open-source more components of the code and update the community version of the plugin accordingly. (This approach gives motivated organisations instant access to the full functionality of the SLYR tool via a license purchase, or free access to a subset of this functionality via the community edition of the plugin. It allows us to heavily invest in further reverse-engineering efforts and improvements to the plugin, to QGIS, and to the wider open-source geospatial community.)

If you’re keen to explore transitioning your workplace from ESRI to open-source, send us an email to discuss what we can offer! North Road staff have years of experience in implementing open-source geospatial solutions within commercial workplaces, and for setting up dual commercial-and-open-source friendly environments.

Securely accessing enterprise ArcGIS Portal sites through QGIS

An updated version of this guide is available!

We were recently contacted for advice regarding our recommendations for securely accessing content on an enterprise ArcGIS Portal deployment from within QGIS. Fortunately, this setup is fully supported and works seamlessly in QGIS, thanks to the native integration of “OAuth2” authentication in QGIS!

This post details step-by-step instructions in setting up both ArcGIS Portal and QGIS to enable this integration. First, we’ll create a new desktop application on the Portal site in order to obtain the application-specific access keys for OAuth2 authentication. We’ll then create an authentication configuration in QGIS and associate this with a connection to the Portal site. Let’s dive in by doing the Portal configuration first…

Creating an application

Logon to the Portal, and from the “Content” tab, click the “Add Item” option. Select “An application” from the drop down list of options:

Set the type of the application as “Desktop

You can fill out the rest of this dialog as you see fit. Suggested values are:

  • Purpose: Ready to Use
  • Platform: Qt
  • URL: http://qgis.org
  • Tags: QGIS, Desktop, etc

Now – here comes a trick. Portal will force you to attach a file for the application. It doesn’t matter what you attach here, so long as it’s a zip file. While you could attach a zipped copy of the QGIS installer, that’s rather wasteful of server space! We’d generally just opt for a zip file containing a text file with a download link in it.

Click Add Item when you’re all done filling out the form, and the new application should be created on the Portal.

Registering the Application

The next step is to register the application on Portal, so that you can obtain the keys required for the OAuth2 logon using it. From the newly created item’s page, click on the “Settings” tab:

Scroll right to the bottom of this page, and you should see a “Register” button. Press this. Set the “App type” to “Native“.

Add two redirect URIs to the list (don’t forget to click “Add” after entering each!):

  1. The Portal’s public address, e.g. https://mydomain.com/portal
  2. http://127.0.0.1:7070

Finally, press the “Register” button in the dialog. If all goes well then the App Registration section in the item settings should now be populated with details. From here, copy the “App ID” and “Secret” strings, we’ll need these later:

Determine Request URLs

One last configuration setting we’ll need to determine before we fire up QGIS is the Portal’s OAuth Request and Token URLs. These are usually found by appending /sharing/rest/oauth2/authorize and /sharing/rest/oauth2/token to the end of your Portal’s URL.

For instance, if your public Portal URL is http://mydomain.com/portal, then the URLs will be:

Request URL: http://mydomain.com/portal/sharing/rest/oauth2/authorize
Token URL: http://mydomain.com/portal/sharing/rest/oauth2/token

You should be able to open both URLs directly in a browser. The Request URL will likely give a “redirect URL not specified” error, and the Token URL will give a “client_id not specified” error. That’s ok — it’s enough to verify that the URLs are correct.

We’re all done on the Portal side now, so time to fire up QGIS!

Creating an QGIS OAuth2 Authentication Configuration

From your QGIS application, select Options from the Settings menu. Select the Authentication tab. We need to create a new authentication configuration, so press the green + button on the right hand side of the dialog. You’ll get a new dialog prompting you for Authentication details.

There’s a few tricks to this setup. Firstly, it’s important to ensure that you use the exact same settings on all your client machines. This includes the authentication ID field, which defaults to an auto-generated random string. (While it’s possible to automatically deploy the configuration as part of a startup or QGIS setup script, we won’t be covering that here!).

So, from the top of the dialog, we’ll fill in the “Name” field with a descriptive name of the Portal site. You then need to “unlock” the “Id” field by clicking the little padlock icon, and then you’ll be able to enter a standard ID to identify the Portal. The Id field is very strict, and will only accept a 7 letter string!

Drop down the Authentication Type combo box, and select “OAuth2 Authentication” from the list of options. There’s lots of settings we need to fill in here, but here’s what you’ll need:

  • Grant flow: set to “Authorization Code”
  • Request URL: enter the Request URL we determined in the previous step, e.g. http://mydomain.com/portal/sharing/rest/oauth2/authorize
  • Token URL: enter the Token URL from the previous step, e.g. http://mydomain.com/portal/sharing/rest/oauth2/token
  • Refresh Token URL: leave empty
  • Redirect URL: leave as the default http://127.0.0.1:7070 value
  • Client ID: enter the App ID from the Portal item’s App Registration information (see earlier steps)
  • Client Secret: enter the App Secret from the Portal item’s App Registration information (see earlier steps)
  • Scope: leave empty
  • API Key: leave empty

That’s it — leave all the rest of the settings at their default values, and click Save.

You can close down the Options dialog now.

Adding the Portal Connection Details

Lastly, we’ll need to setup the Portal connection as an “ArcGISFeatureServer” and “ArcGISMapServer” connection in QGIS. This is done through the QGIS “Data Source Manager” dialog, accessed through the Layer menu. Click the “ArcGIS Feature Server” tab to start with, and then press “New” in the Server Connections group at the top of this dialog.

Enter a descriptive name for the connection, and then enter the URL for the ArcGIS server REST endpoint associated with your Portal:

Lastly, select the new OAuth2 configuration you just created under the “Authentication” group:

Click OK, and you’re done! When you try to connect to the newly added connection, you’ll automatically be taken to the Portal’s logon screen in order to authenticate with the server. After entering your details, you’ll then be connected securely to the server and will have access to all items which are shared with your user account on the Portal!

You can then repeat this step for and create a similar connection under the “ArcGIS Map Server” tab.

We’ve regularly use this setup for our enterprise clients, and have found it to work flawlessly in recent QGIS versions! If you’ve found this useful and are interested in other “best-practice” recommendations for mixed Open-Source and ESRI workplaces, don’t hesitate to contact us to discuss your requirements… at North Road we specialise in ensuring flawless integration between ESRI based systems and the Open Source geospatial software stack.

SLYR ESRI to QGIS compatibility suite – April 2020 update

Since the last update, our “SLYR” ESRI to QGIS compatibility suite has gained a ton of new functionality, including full support for conversion of ArcMap MXD documents (with page layouts!). In this update, we’ll explore some of the new functionality available in the tool — but instead of focusing solely on SLYR, this time we’ll also explore the enhancements we’ve been making in QGIS itself that have helped improve the quality of ArcMap document conversion.

While many of these enhancements are already available to all users of QGIS 3.12, others are exciting additions to the upcoming QGIS 3.14 release. Let’s dive in!

Improved legend customisation

One shortcoming we realised early on during our work on SLYR was that QGIS map legends just didn’t offer a comparable level of customisation as ArcMap legends. We could convert the basic layout of a legend, but we just couldn’t get the legend appearance in QGIS sufficiently close to its original appearance in the MXD file.

To address this we’ve been extending QGIS’ inbuilt legend support by adding finer control over the legend layout and spacing.

As a result, one exciting addition we’ve recently made for QGIS 3.14 is adding the ability to customise legend patch shapes and sizes on an item-by-item basis! Previously, legends in QGIS were rather boring, with all polygon layers showing as a plain rectangle and line layers as a horizontal line.

Now, users have full control over setting custom shapes for their legend patches! This makes for much more user-friendly legends, as you can now show representative shapes in your legends — e.g. a river symbol can be shown as a wiggly line, instead of an unrealistic straight horizontal line.

You can also override the size of a legend patch on an item-by-item basis too, which allows for further control over the final legend appearance. Checkout the screencast below showing both these features in action (naturally, using a legend from a converted MXD document… ArcMap users will likely recognise the fonts and patch shapes used here!)

We really wanted custom legend patch shapes to be a full first-class citizen in QGIS, so we also added support for managing them in user’s style databases. This makes it easy to setup your own libraries of custom legend shapes and share them with others. As a nice bonus, the SLYR tool even offers support for converting area and line patch shapes while converting ESRI .style databases:

Marker north arrows

Another issue we ran into while converting ArcMap page layouts was converting north arrows. QGIS used a very different approach to north arrows compared with ArcMap — in QGIS, north arrows were always based on existing SVG files, while ArcMap uses a rotated marker symbol for north arrows. Both approaches have their advantages and disadvantages, but we struggled to get good results when trying to convert ArcMap’s marker based approach to QGIS’ SVG based approach.

In the end, we weren’t happy with the result, so we took the step of implementing full support for marker symbol north arrows in QGIS 3.14. Now QGIS users have a choice of both north arrow styles — you can still create north arrows direct from SVG files, but you’ve also now got the flexibility to create them from standard marker symbols instead!

Adding support for marker based north arrows in QGIS allows us to get an perfect match when converting ESRI Page Layouts with north arrows:

Hollow and stepped line scale bars

While adding support for scale bar conversion to SLYR, we identified that some scale bar styles which are widely used in ArcMap just weren’t possible to reproduce in QGIS. Accordingly, from QGIS 3.14 on, we added native support for “Stepped line” and “Hollow” scale bar styles:

Embedded images in QGIS print layouts

ArcMap offers users the ability to directly embed images inside symbol definitions or page layouts. Whilst QGIS has offered embedded image support in symbols for a number of releases, this previously wasn’t possible to do in print layouts.

This was an issue for us while converting ArcMap page layouts, because we didn’t have any way to represent embedded images in QGIS layouts. Accordingly, for QGIS 3.14 we’ve added native support for directly embedding images (either raster images or SVG pictures) inside a page layout:

One handy consequence of this improvement is that it’s now possible to create completely self contained print layout templates for QGIS — you no longer have to separately distribute any required images (such as company logos) along with your QPT templates!

Naturally, our SLYR plugin now automatically converts any embedded images it finds in an ArcMap page layout and correctly creates a converted, embedded version of the image in the QGIS print layout.

Scalebar numeric formats

Another missing customisation in QGIS’ scale bar functionality was allowing users control over the scale bar’s number format. Previously, QGIS offered no customisation for these numbers, so you got only what QGIS decided you wanted. We improved this in QGIS 3.12 by offering users the ability to control exactly how they want their scale bar numbers to appear. There’s options for manually controlling the thousand and decimal separators, rounding, and much more:

This enhancement allowed us to get an exact match when converting ArcMap scale bars — the converted results should appear identical to their original ArcMap appearance!

Random marker fill

Until recently, one of the few remaining layer symbolisation gaps between QGIS and ArcMap was that QGIS had no symbology option for randomised marker placements for fill symbols. This was a big issue for us, because without it there just wasn’t any way that SLYR could convert layers styled with ArcMap’s “dot density renderer”  or using a marker fill’s “random offset” option.

So for QGIS 3.12, we add inbuilt support for a new “Random marker fill” symbol type:

This new symbol layer type allows for randomised (or stable seed-based) placement of markers inside polygon features. You’re given the option of either an absolute number of points to show in the feature, or a density-based count which retains its dot density regardless of the map’s scale!

Aside from being a useful symbology option in it’s own right, adding this functionality allowed us to accurately convert random markers or dot density renders from ArcMap to QGIS.

Other enhancements

The highlights above are only a small subset of the work we’ve done in QGIS to improve its interoperability with ArcMap via the SLYR plugin! Some of the other work we’ve done includes:

  • Many improvements to QGIS’ bad layer handling and automatic repair functionality. For instance, QGIS now emulates ArcMap’s helpful behaviour where ALL similar broken layer paths in a document are fixed automatically after fixing the path to one broken layer. Handling broken layer paths was a pain point for our customers, so we’ve sought to make this as painless as possible.
  • Support for plugins to handle pasting content into QGIS print layouts. We use this in SLYR to offer the ability to directly copy and paste content from ArcMap page layouts into a QGIS print layout.
  • Support for plugins to hook into the standard QGIS “Open Project” dialog, offering support for opening projects of their own custom types. We use this to allow users to directly open MXD, MXT, PMF and SXD files from the QGIS Open Project menu action.
  • We’ve worked closely with the upstream proj project, to ensure that coordinate reference systems from ESRI documents are correctly matched to known EPGS/ESRI CRS definitions in certain circumstances.

Other new features in SLYR

Aside from all the goodness we’ve explored above, the latest versions of SLYR offer TONS of new functionality for conversion of ArcMap documents, including:

  • Full support for joins and relations when converting MXD documents
  • Print layouts, including support for conversion of data driven pages to QGIS print atlases and support for multi-map page layouts using multiple data frames.
  • Support for reading MXD document metadata (and converting this to QGIS document metadata)
  • Support for dragging and dropping layers direct from ArcMap or ArcCatalog to a QGIS window, respecting all the layer styling.
  • Support for AVL style conversion
  • A new tool for dumping the full structure of MXD or LYR files to a json document. This is very handy for digging right into the full internals of the documents and for diagnosing corrupted documents.
  • Full support for conversion of vector and raster layers
  • Support for converting MXD, MXT and PMF documents
  • Support for converting ArcScene SXD documents to 2-dimensional QGIS maps

Read more are the SLYR home page, or contact us today to discuss purchasing SLYR and your licensing needs!

QGIS Processing, Model Designer and ETL Campaign crowdfund launched!

QGIS Processing offers a rich and expandable set of algorithms which can operate on spatial data, along with a powerful Model Designer which allows users to string together these algorithms to create custom workflows.

Since its introduction in QGIS 2, the Processing framework has seen an intensive amount of development and optimisation efforts. In recent QGIS releases it offers a very user-friendly way of performing complex spatial data processing tasks, all without requiring ANY expensive third-party tools or software licenses!

At North Road we are passionate about the QGIS Processing framework, and have invested considerable effort in this framework over the past 5 years. We’re proud to announce that our latest crowd-funding campaign is focused on further expanding the capabilities and flexibility of Processing and the Processing Model Designer!

Unlike a typical crowdfunding campaign, where a specific funding target and deadline is set, we’re running this campaign a little differently. Instead, this campaign is taking the form of a “à la carte” menu of Processing enhancements. These range from small “paper-cut” style fixes, through to larger architectural improvements, and are each individually priced accordingly. We are asking backers to pick individual enhancements from this “menu of enhancements” and fund that enhancement’s development in full. In order to make this campaign affordable for a wide range of backers, we’ve included a huge range of enhancements which vary in price from smaller amounts to larger amounts.

You can read the full details of the campaign and browse the list of proposed enhancements at the campaign page.

Back to Top

Sustaining Members