Related Plugins and Tags

QGIS Planet

Creating circular insets and other fun QGIS layout tricks

Thanks to the recent popularity of the “30 Day Map Challenge“, the month of November has become synonymous with beautiful maps and cartography. During this November we’ll be sharing a bunch of tips and tricks which utilise some advanced QGIS functionality to help create beautiful maps.

One technique which can dramatically improve the appearance of maps is to swap out rectangular inset maps for more organic shapes, such as circles or ovals.

Back in 2020, we had the opportunity to add support for directly creating circular insets in QGIS Print Layouts (thanks to sponsorship from the City of Canning, Australia!). While this functionality makes it easy to create non-rectangular inset maps the steps, many QGIS users may not be aware that this is possible, so we wanted to highlight this functionality for our first 30 Day Map Challenge post.

Let’s kick things off with an example map. We’ve shown below an extract from the 2032 Brisbane Olympic Bid that some of the North Road team helped create (on behalf of SMEC for EKS). This map is designed to highlight potential venues around South East Queensland and the travel options between these regions:
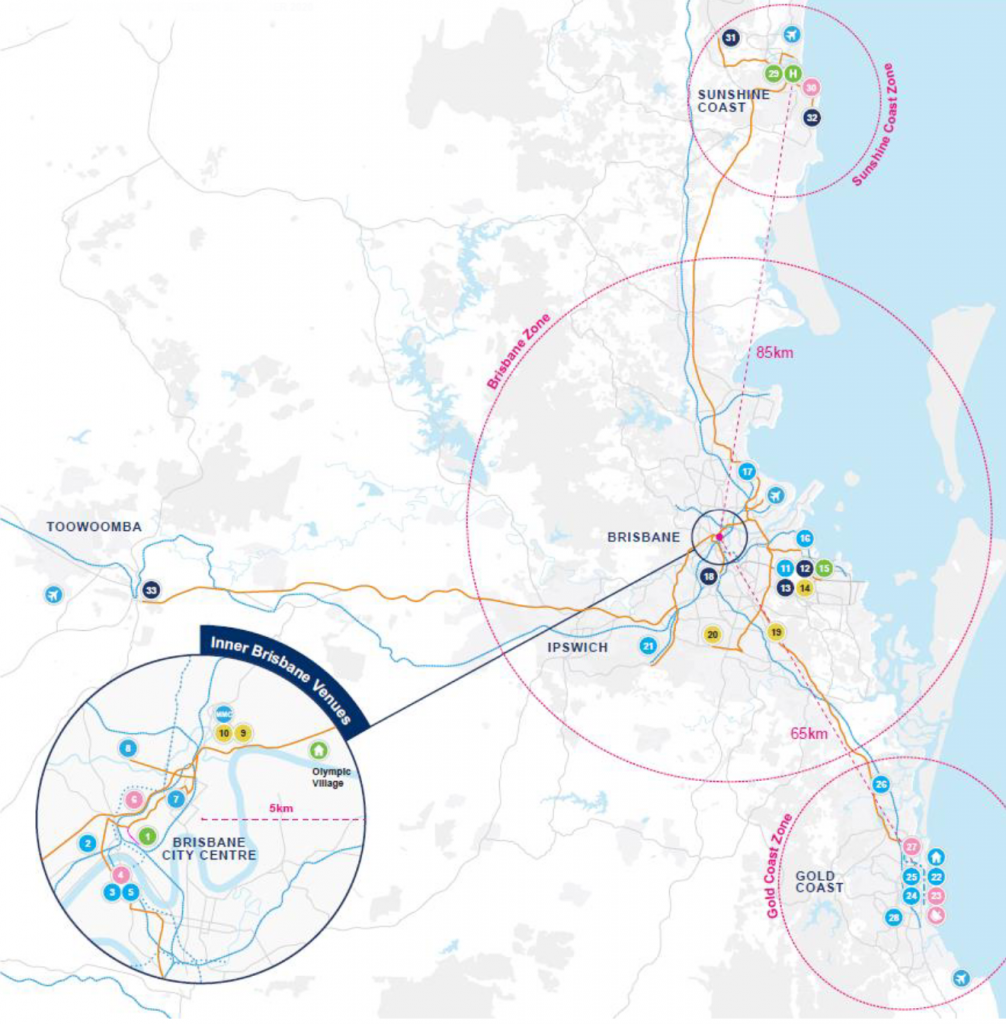
Venue Masterplan Brisbane 2032 Olympics
Venue Masterplan for 2032 Olympic Games, IOC Feasibility Assessment – Olympic Games, Brisbane February 2021

Circles featured heavily in previous Olympic bid maps (such as Budapest) where we took our inspiration from. This may, or may not, play a part in using the language of the target map audience – think Olympic rings!
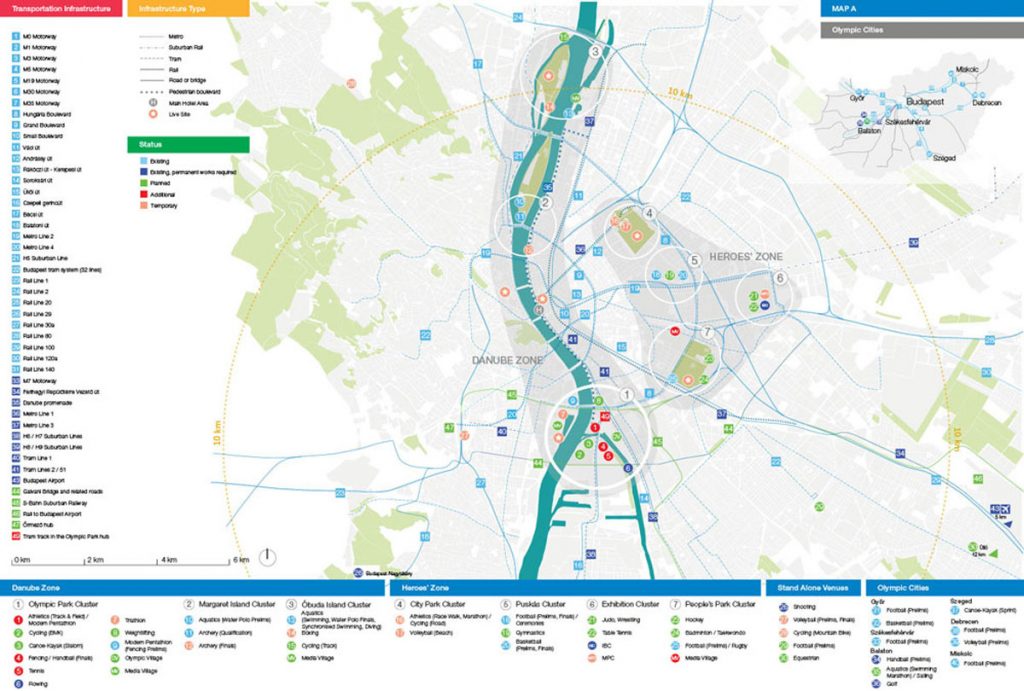
Budapest Olympics 2024 MasterplanBudapest Olympics 2024 Masterplan


Step by Step Guide to Creating a Circle Inset

Firstly, prepare a print layout with both a main map and an inset map. Make sure that your inset map is large enough to cover your circular shape:

From the Print Layout toolbar, click on the Add Shape button and then select Add Ellipse:

Draw the ellipse over the middle of your inset map (hint: holding down Shift while drawing the ellipse will force it to a circular shape!). If you didn’t manage to create an exact circle then you can manually specify the width and height in the shape item’s properties. For this one, we went with a 50mm x 50mm circle:

Next, select the Inset Map item and in its Item Properties click on the Clipping Settings button:

In the Clipping Settings, scroll down to the second section and tick the Clip to Item box and select your Ellipse item from the list. (If you have labels shown in your inset map you may also want to check the “force labels inside clipping shape” option to force these labels inside the circle. If you don’t check this option then labels will be allowed to overflow outside of the circle shape.)

Your inset map will now be bound to the ellipse!

Here’s a bit more magic you could add to this map – in the Main Map’s properties, click on Overviews and set create one for the Inset map – it will nicely show the visible circular area and not the rectangle!

Bonus Points: Circular Title Text!

For advanced users, we’ve another fun tip…and when we say fun, we mean ‘let’s play with radians’! Here we’re going to create some title text and a wedged background which curves around the outside of our circular inset. This takes some fiddly playing around, but the end result can be visually striking! Here we’re going to push the QGIS print layout “HTML” item to create some advanced graphics, so some HTML and CSS coding experience is advantageous. (An alternative approach would be to use a vector illustration application like Inkscape, and add your title and circular background as an SVG item in the print layout).

We’ll start by creating some curved circular text:

First, add a “HTML frame” to your print layout:

HTML frames allow placement of dynamic content in your layouts, which can use HTML, CSS and JavaScript to create graphical components.

In the HTML item’s “source” box, add the following code:

<svg height="300" width="350">
        <defs>
            <clipPath id="circleView">
                <circle id="curve" cx="183" cy="156" r="25" fill="transparent" />
            </clipPath>
        </defs>
        <path id="forText" d="M 28,150, C 25,50, 180,-32,290,130" stroke="" fill="none"/>
            <text x="0" y="35" width="100">
                <textpath xlink:href="#forText">
                    <tspan font-weight="bold" fill="black">Place text here</tspan>
                </textpath>
            </text>
             <style>
    <![CDATA[
      text{
        dominant-baseline: hanging;
        font: 20px Arial;
      }
    ]]>
  </style>
</svg>

Now, let’s add in a background to bring more focus onto the title!
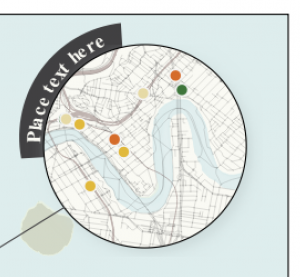
To add in the background, create another HTML item. We’ll again create the arc shape using an SVG element, so add the following code into the item’s source box:

<svg width="750" height="750" xmlns="http://www.w3.org/2000/svg">
  <path d="M 90 70
           A 56 56, 0, 0, 0, 133 140
           L 150 90 Z" fill="#414042" transform=" scale(2.1) rotate(68 150 150) " />/>
</svg>

(You can read more about SVG  curves and arcs paths over at MDN)

So there we go! These two techniques can help push your QGIS map creations further and make it easier to create beautiful cartography directly in QGIS itself. If you found these tips useful, keep an eye on this blog as we post more tips and tricks over the month of November. And don’t forget to follow the 30 day Map Challenge for a smorgasbord of absolutely stunning maps.

SLYR ESRI to QGIS compatibility suite – April 2020 update

Since the last update, our “SLYR” ESRI to QGIS compatibility suite has gained a ton of new functionality, including full support for conversion of ArcMap MXD documents (with page layouts!). In this update, we’ll explore some of the new functionality available in the tool — but instead of focusing solely on SLYR, this time we’ll also explore the enhancements we’ve been making in QGIS itself that have helped improve the quality of ArcMap document conversion.

While many of these enhancements are already available to all users of QGIS 3.12, others are exciting additions to the upcoming QGIS 3.14 release. Let’s dive in!

Improved legend customisation

One shortcoming we realised early on during our work on SLYR was that QGIS map legends just didn’t offer a comparable level of customisation as ArcMap legends. We could convert the basic layout of a legend, but we just couldn’t get the legend appearance in QGIS sufficiently close to its original appearance in the MXD file.

To address this we’ve been extending QGIS’ inbuilt legend support by adding finer control over the legend layout and spacing.

As a result, one exciting addition we’ve recently made for QGIS 3.14 is adding the ability to customise legend patch shapes and sizes on an item-by-item basis! Previously, legends in QGIS were rather boring, with all polygon layers showing as a plain rectangle and line layers as a horizontal line.

Now, users have full control over setting custom shapes for their legend patches! This makes for much more user-friendly legends, as you can now show representative shapes in your legends — e.g. a river symbol can be shown as a wiggly line, instead of an unrealistic straight horizontal line.

You can also override the size of a legend patch on an item-by-item basis too, which allows for further control over the final legend appearance. Checkout the screencast below showing both these features in action (naturally, using a legend from a converted MXD document… ArcMap users will likely recognise the fonts and patch shapes used here!)

We really wanted custom legend patch shapes to be a full first-class citizen in QGIS, so we also added support for managing them in user’s style databases. This makes it easy to setup your own libraries of custom legend shapes and share them with others. As a nice bonus, the SLYR tool even offers support for converting area and line patch shapes while converting ESRI .style databases:

Marker north arrows

Another issue we ran into while converting ArcMap page layouts was converting north arrows. QGIS used a very different approach to north arrows compared with ArcMap — in QGIS, north arrows were always based on existing SVG files, while ArcMap uses a rotated marker symbol for north arrows. Both approaches have their advantages and disadvantages, but we struggled to get good results when trying to convert ArcMap’s marker based approach to QGIS’ SVG based approach.

In the end, we weren’t happy with the result, so we took the step of implementing full support for marker symbol north arrows in QGIS 3.14. Now QGIS users have a choice of both north arrow styles — you can still create north arrows direct from SVG files, but you’ve also now got the flexibility to create them from standard marker symbols instead!

Adding support for marker based north arrows in QGIS allows us to get an perfect match when converting ESRI Page Layouts with north arrows:

Hollow and stepped line scale bars

While adding support for scale bar conversion to SLYR, we identified that some scale bar styles which are widely used in ArcMap just weren’t possible to reproduce in QGIS. Accordingly, from QGIS 3.14 on, we added native support for “Stepped line” and “Hollow” scale bar styles:

Embedded images in QGIS print layouts

ArcMap offers users the ability to directly embed images inside symbol definitions or page layouts. Whilst QGIS has offered embedded image support in symbols for a number of releases, this previously wasn’t possible to do in print layouts.

This was an issue for us while converting ArcMap page layouts, because we didn’t have any way to represent embedded images in QGIS layouts. Accordingly, for QGIS 3.14 we’ve added native support for directly embedding images (either raster images or SVG pictures) inside a page layout:

One handy consequence of this improvement is that it’s now possible to create completely self contained print layout templates for QGIS — you no longer have to separately distribute any required images (such as company logos) along with your QPT templates!

Naturally, our SLYR plugin now automatically converts any embedded images it finds in an ArcMap page layout and correctly creates a converted, embedded version of the image in the QGIS print layout.

Scalebar numeric formats

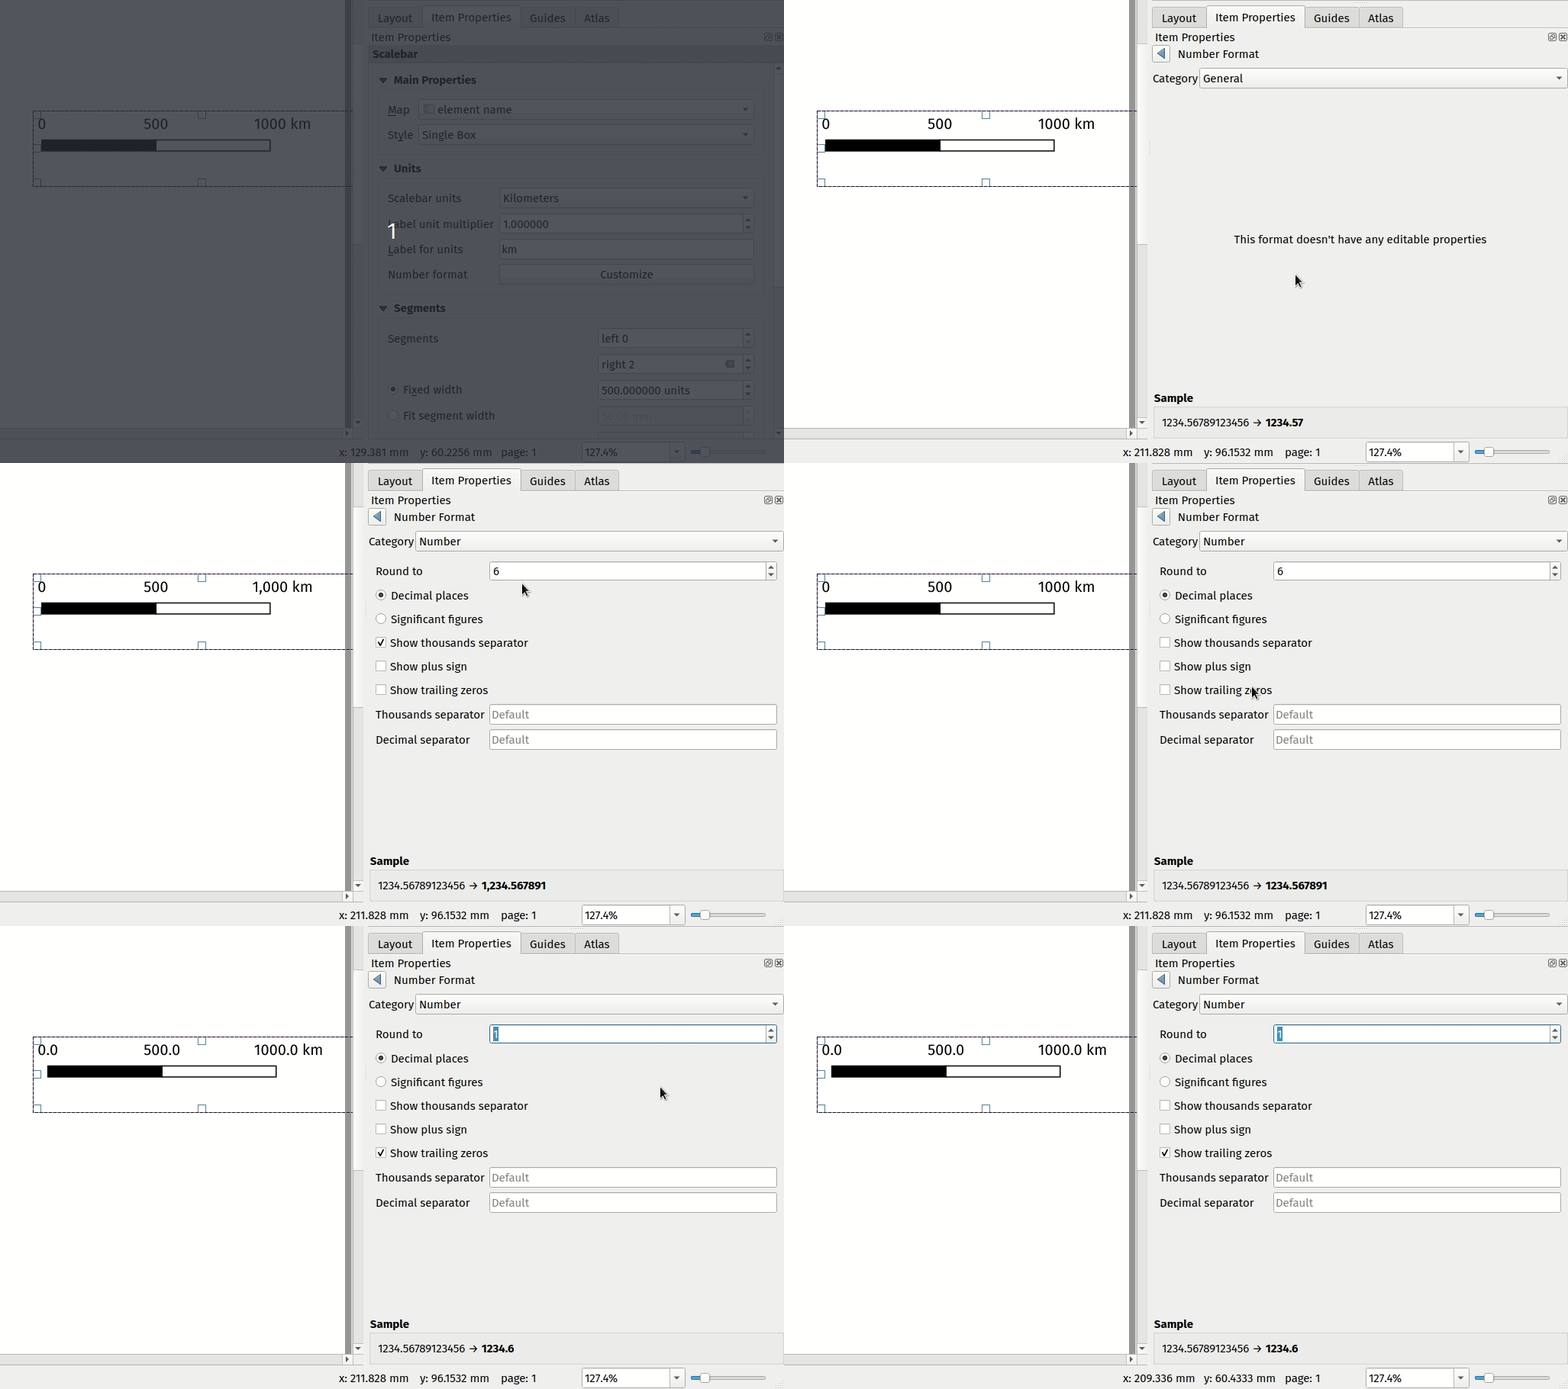
Another missing customisation in QGIS’ scale bar functionality was allowing users control over the scale bar’s number format. Previously, QGIS offered no customisation for these numbers, so you got only what QGIS decided you wanted. We improved this in QGIS 3.12 by offering users the ability to control exactly how they want their scale bar numbers to appear. There’s options for manually controlling the thousand and decimal separators, rounding, and much more:

This enhancement allowed us to get an exact match when converting ArcMap scale bars — the converted results should appear identical to their original ArcMap appearance!

Random marker fill

Until recently, one of the few remaining layer symbolisation gaps between QGIS and ArcMap was that QGIS had no symbology option for randomised marker placements for fill symbols. This was a big issue for us, because without it there just wasn’t any way that SLYR could convert layers styled with ArcMap’s “dot density renderer”  or using a marker fill’s “random offset” option.

So for QGIS 3.12, we add inbuilt support for a new “Random marker fill” symbol type:

This new symbol layer type allows for randomised (or stable seed-based) placement of markers inside polygon features. You’re given the option of either an absolute number of points to show in the feature, or a density-based count which retains its dot density regardless of the map’s scale!

Aside from being a useful symbology option in it’s own right, adding this functionality allowed us to accurately convert random markers or dot density renders from ArcMap to QGIS.

Other enhancements

The highlights above are only a small subset of the work we’ve done in QGIS to improve its interoperability with ArcMap via the SLYR plugin! Some of the other work we’ve done includes:

  • Many improvements to QGIS’ bad layer handling and automatic repair functionality. For instance, QGIS now emulates ArcMap’s helpful behaviour where ALL similar broken layer paths in a document are fixed automatically after fixing the path to one broken layer. Handling broken layer paths was a pain point for our customers, so we’ve sought to make this as painless as possible.
  • Support for plugins to handle pasting content into QGIS print layouts. We use this in SLYR to offer the ability to directly copy and paste content from ArcMap page layouts into a QGIS print layout.
  • Support for plugins to hook into the standard QGIS “Open Project” dialog, offering support for opening projects of their own custom types. We use this to allow users to directly open MXD, MXT, PMF and SXD files from the QGIS Open Project menu action.
  • We’ve worked closely with the upstream proj project, to ensure that coordinate reference systems from ESRI documents are correctly matched to known EPGS/ESRI CRS definitions in certain circumstances.

Other new features in SLYR

Aside from all the goodness we’ve explored above, the latest versions of SLYR offer TONS of new functionality for conversion of ArcMap documents, including:

  • Full support for joins and relations when converting MXD documents
  • Print layouts, including support for conversion of data driven pages to QGIS print atlases and support for multi-map page layouts using multiple data frames.
  • Support for reading MXD document metadata (and converting this to QGIS document metadata)
  • Support for dragging and dropping layers direct from ArcMap or ArcCatalog to a QGIS window, respecting all the layer styling.
  • Support for AVL style conversion
  • A new tool for dumping the full structure of MXD or LYR files to a json document. This is very handy for digging right into the full internals of the documents and for diagnosing corrupted documents.
  • Full support for conversion of vector and raster layers
  • Support for converting MXD, MXT and PMF documents
  • Support for converting ArcScene SXD documents to 2-dimensional QGIS maps

Read more are the SLYR home page, or contact us today to discuss purchasing SLYR and your licensing needs!

SLYR ESRI to QGIS compatibility suite – November 2019 update

It’s a been a month full of huge improvements since the last update, and we have some exciting news to share about our SLYR ESRI to QGIS compatibility suite. With the recently published plugin version 3.7, MXD conversion has moved from a “beta” state to being fully supported and available out-of-the-box for all users!

Based on our massive library of reference files (almost 10,000 files covering a huge range of ArcGIS versions and features!), the tool is now able to successfully convert 96% of LYR files and 94.5% of MXD documents. This is a significant milestone, and with it we decided that MXD conversion support is now stable enough to move out of its previous beta state.

Aside from this milestone, the 3.7 release brings many more enhancements and improvements, including:

  • SLYR now has full support for PMF published map documents created by ArcGIS Publisher, along with a new Processing algorithm to convert from a PMF document to a QGS projects
  • We’ve also added support for converting ArcScene SXD scenes to QGS projects. This conversion is 2-dimensional only for now, but we plan on adding 3D conversion when QGIS’ 3D support further matures.
  • We now convert all data frames contained within MXD documents, instead of just the first data frame. Currently, these are exposed as their own individual groups within the project layer tree (when we enable support for page layout conversion we’ll be automatically creating corresponding map themes from each data frame).
  • We’ve added support for reading many more layer types, including raster catalog layers, topology layers, terrain layers, and LAS dataset layers. While QGIS doesn’t have support for these layer types, we need to fully parse them in order to convert the rest of the MXD document contents. Whenever an unsupported layer type like these are encountered the plugin shows a warning advising users which layers could not be successfully converted.
  • We’ve also added support for reading TIN layers. Although previous QGIS versions had no means to read ESRI tin layers, thanks to work done in the MDAL library the upcoming QGIS 3.10.1 release adds full support for reading these data files! Accordingly, we’ll be unlocking support for converting TIN layers contained within MXD documents following the 3.10.1 release.
  • Full support for WMTS and tiled internet layers
  • Support for reading MXD documents which have repaired by the MXD Doctor utility
  • Support for layers with a geopackage source
  • Conversion of ImageServer based layers (since QGIS only has basic support for ESRI ImageServers, we convert these layers to their equivalent MapServer versions wherever possible)
  • Basic support for representation renderers. Although QGIS has no capability to utilise the symbology linked with a representation renderer, we’ve added support for rendering these layers using any geometry overrides which may be present for the features.
  • Conversion support for simple scale dependent renderers (these are a funny beast, which can’t be created directly through the ArcMap interface and which require custom ArcObjects code to create! That said, we’ve encountered a few examples of these inside our test library so have added support for converting them to the equivalent QGIS rule based renderer).
  • We added a new “random marker fill” symbol type to the upstream QGIS project, which will be available in QGIS 3.12 along with support in SLYR for conversion of ESRI random marker fills.

So what’s next for SLYR? Over the remainder of 2019 we’ll be working furiously toward 100% conversion rates for LYR and MXD files. We’ll also start rolling out conversion support for page layouts to QGIS print layouts, and support for automatic conversion of ArcMap TIN layers to QGIS mesh layers.

Keep an eye on this blog and our Twitter channel for further updates!


QGIS Layout and Reporting Engine Campaign – a success!

Thanks to the tireless efforts and incredible generosity of the QGIS user community, our crowdfunded QGIS Layout and Reporting Engine campaign was a tremendous success! We’ve reached the funding goal for this project, and as a result QGIS 3.0 will include a more powerful print composer with a reworked code base. You can read more about what we have planned at the campaign page.

We’d like to take this opportunity to extend our heartfelt thanks to all the backers who have pledged to support this project:

We’ve also received numerous anonymous contributions in addition to these – please know that the QGIS community extends their gratitude for your contributions too! This campaign was also successful thanks to The Agency for Data Supply and Efficiency, Denmark, who stepped up and have funded an initial component of this project directly.

We’d also like to thank every member of the QGIS community who assisted with promoting this campaign and bringing it to the attention of these backers. Without your efforts we would not have been able to reach these backers and the campaign would not have been successful.

We’ll be posting more updates as this work progresses. Stay tuned…


  • Page 1 of 1 ( 4 posts )
  • North Road
  • uncategorized

Back to Top

Sustaining Members