


QGIS plugin for water management
Oslandia releases today a new plugin for the QGIS processing framework, allowing for water distribution network simulation. It integrates the opensource EPANET simulation software. EPANET models water distribution networks. It’s a widely used public-domain simulation software developed by the US Environmental Protection Agency.
Hydraulic simulation is used to understand water distribution in distribution network, to forecast the impact of network alterations, to dimension network elements or study extreme case scenarios (e.g. important demand for firefighting, pipes breakages, interruption in supply).
QGIS provides a graphical user interface that can be used to import/edit/export hydraulic model elements and simulation parameters from various sources, launch simulation and visualize results directly inside QGIS.
Hydraulic model
A hydraulic model consists of junctions (POINT) and pipes (LINESTRING) along with various other elements like tanks, pumps and valves. Those elements can be stored as features in a spatially enabled database. Features attributes can be simple (e.g. pipe diameter) or complex (e.g. pumps characteristic curves or water consumption). Complex attributes are stored via a foreign key in other alphanumeric tables.
This is the kind of data QGIS is designed to handle. It can import/export them from/to a variety of sources and also display and edit them.
Simulation parameters
Simulation parameters and options (e.g. simulation time step or accuracy) are key-value pairs. The values can be stored in a table which columns are keys. Each set of simulation parameters is then a record in this table. This kind of table can be loaded in QGIS as a vector layer without geometry.
Integration in the processing framework
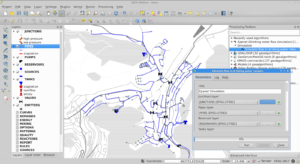
Once the hydraulic model and simulation parameters are loaded in QGIS, the simulation can be launched through the Processing toolbox. The plugin uses the standalone command line interface of EPANET (CLI) which path needs to be specified in processing Options and configuration.
The plugin assembles an EPANET input file, runs EPANET and parses its output to generate result layers.
One interesting aspect with processing modules is that they can be used for chained processing: the user can use other modules to do additional transformations of simulation results, as feeding them into another simulation model.
Result visualization
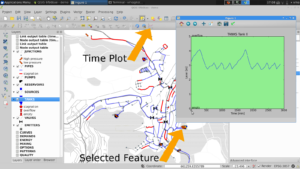
Simulation results are water pressure and velocity at all points in the network along with state of network elements (e.g. volume in tanks, power of pumps) for all simulation time steps . This represent a huge amount of data that are usually displayed either as time-plots or as map-plots of time aggregated data (e.g. max and min during simulation).
Results of particular interest are:
- time-plots of:
- volume in reservoirs
- flow at pumps
- pressure in pipes and at junctions
- map-plots of:
- low speed (stagnation)
- high and low pressure (risk of breakage, unhappy consumer)
- lack of level variation in reservoirs (stagnation)
- empty reservoir
- reservoir overflow
- abnormal pressure (typical of error in the altitude of a node in the model)
- flow direction
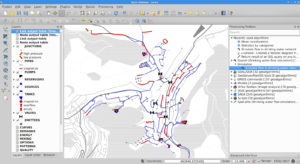
QGIS is naturally suited for map-plots. Time-aggregated simulation results are automatically joined to map layers when the result table is added to the map. Rule-based symbology is used to highlight zones of concern (e.g. low water velocity or empty reservoirs).
The matplotlib library provides 2D plotting facilities in python and QGIS provides an extensive set of selection tools (on the map or in tables). The plugin’s button plots the appropriate value depending on the selected feature type (e.g. water level for tanks, pressure for junctions).
Screencast
For a full demo of this plugin, see the following video :
Where and who
The plugin is available on GitHub and should be available soon on QGIS plugin repository : https://github.com/Oslandia/qgis-epanet
This work has been funded by European Funds. Many thanks to the GIS Office of Apavil, Valcea County (Romania). Oslandia has developped this plugin, and provides support and development around QGIS, PostGIS and this plugin. Get in touch if you need more : [email protected]
We are looking for a free dataset with full informations (pumps, tanks, valves, pipes and their characteristics…) to distribute with this plugin as a test case and demonstration. If you can provide this, mail us !
We also are implementing a Processing plugin for SWMM, the public domain Waste-water simulation tool. If you are interested to participate to the development, please contact us.
