Related Plugins and Tags

QGIS Planet

Offline Vector Tile Package .vtpk in QGIS

Starting from 3.26, QGIS now supports .vtpk (Vector Tile Package) files out of the box! From the changelog:

ESRI vector tile packages (VTPK files) can now be opened directly as vector tile layers via drag and drop, including support for style translation.

This is great news, particularly for users from Austria, since this makes it possible to use the open government basemap.at vector tiles directly, without any fuss:

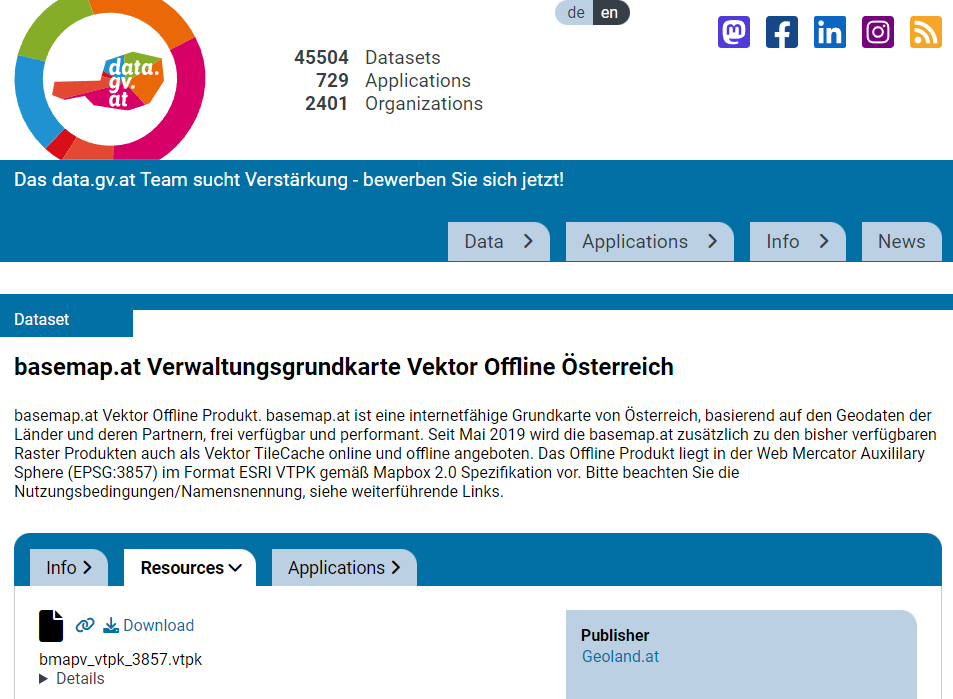
1. Download the 2GB offline vector basemap from https://www.data.gv.at/katalog/de/dataset/basemap-at-verwaltungsgrundkarte-vektor-offline-osterreich


2. Add the .vtpk as a layer using the Data Source Manager or via drag-and-drop from the file explorer


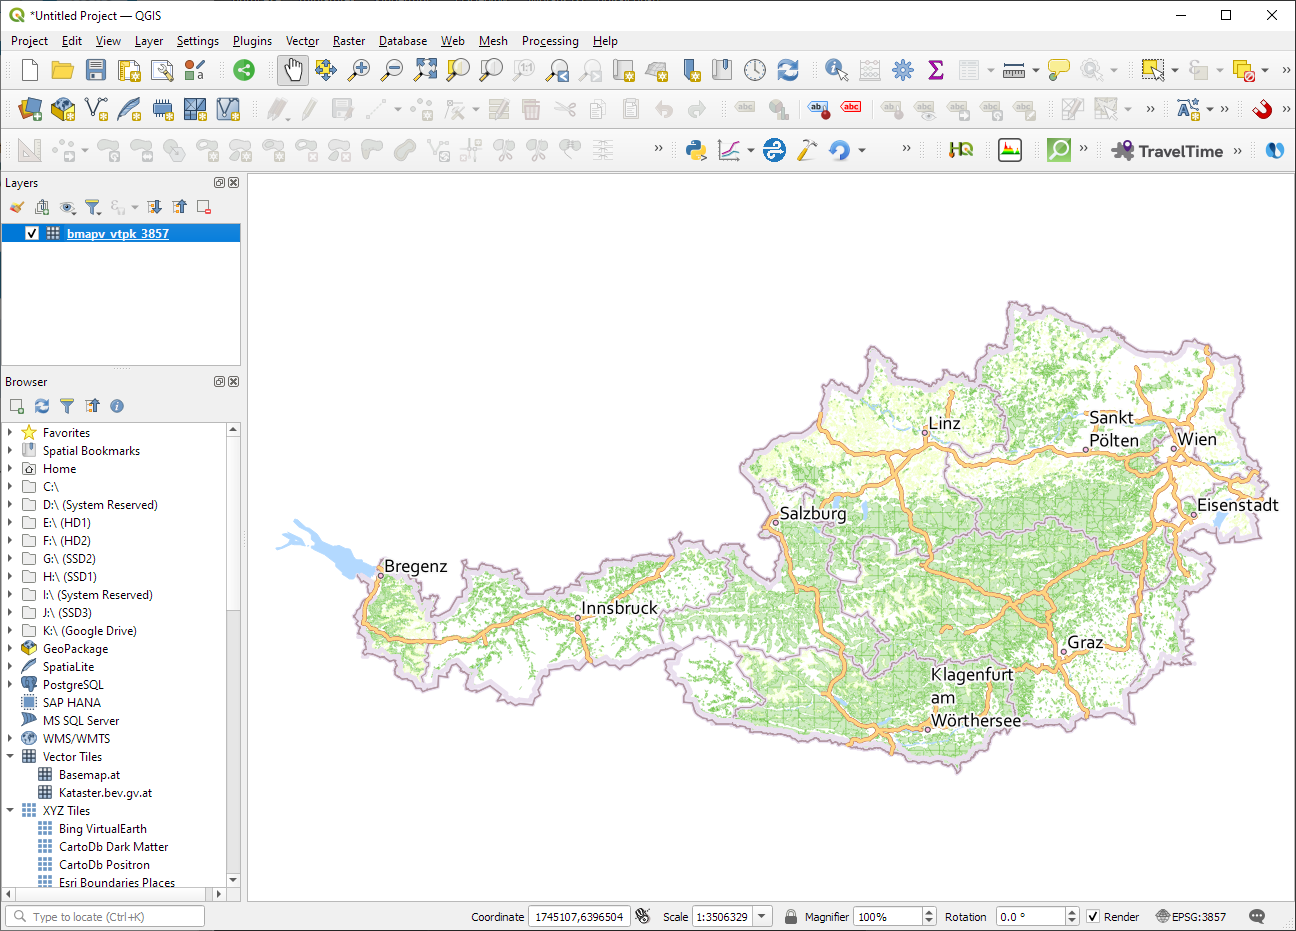
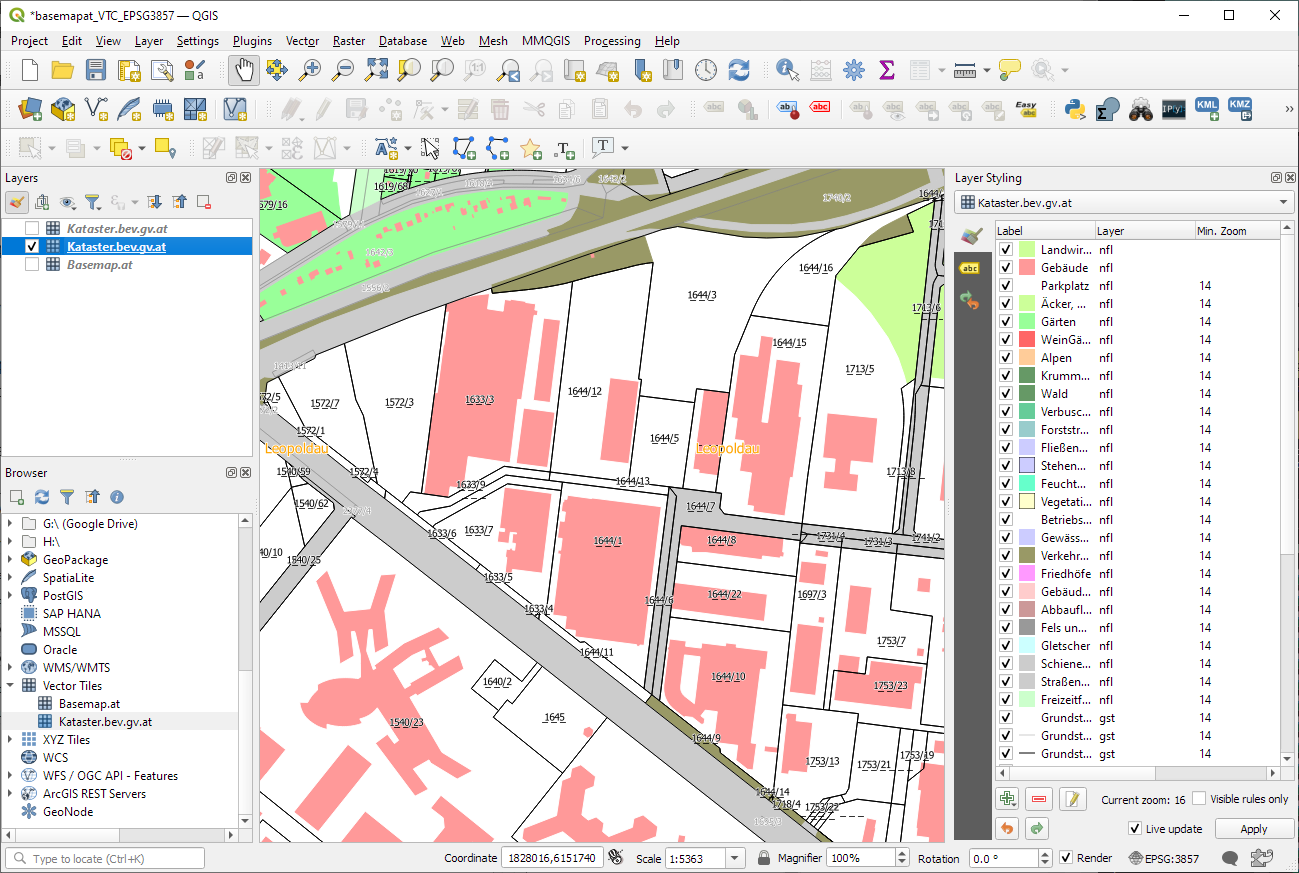
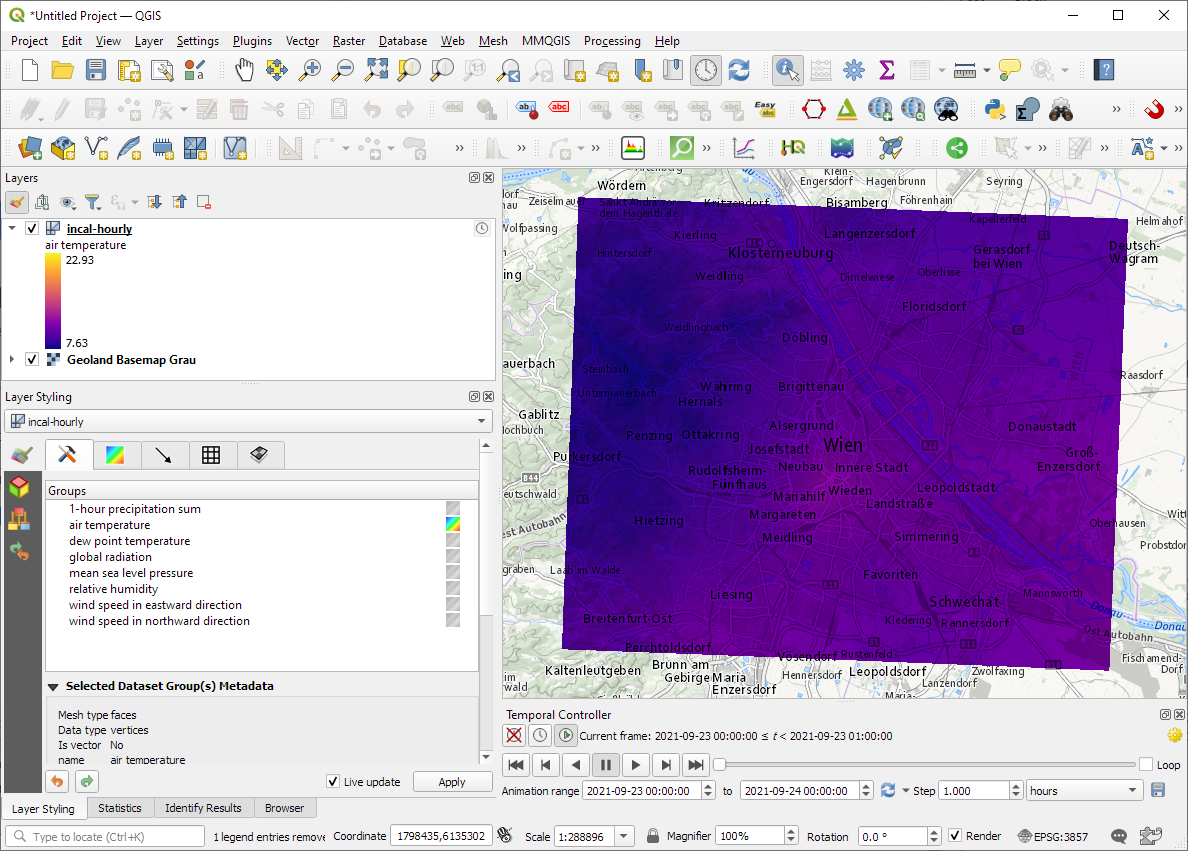
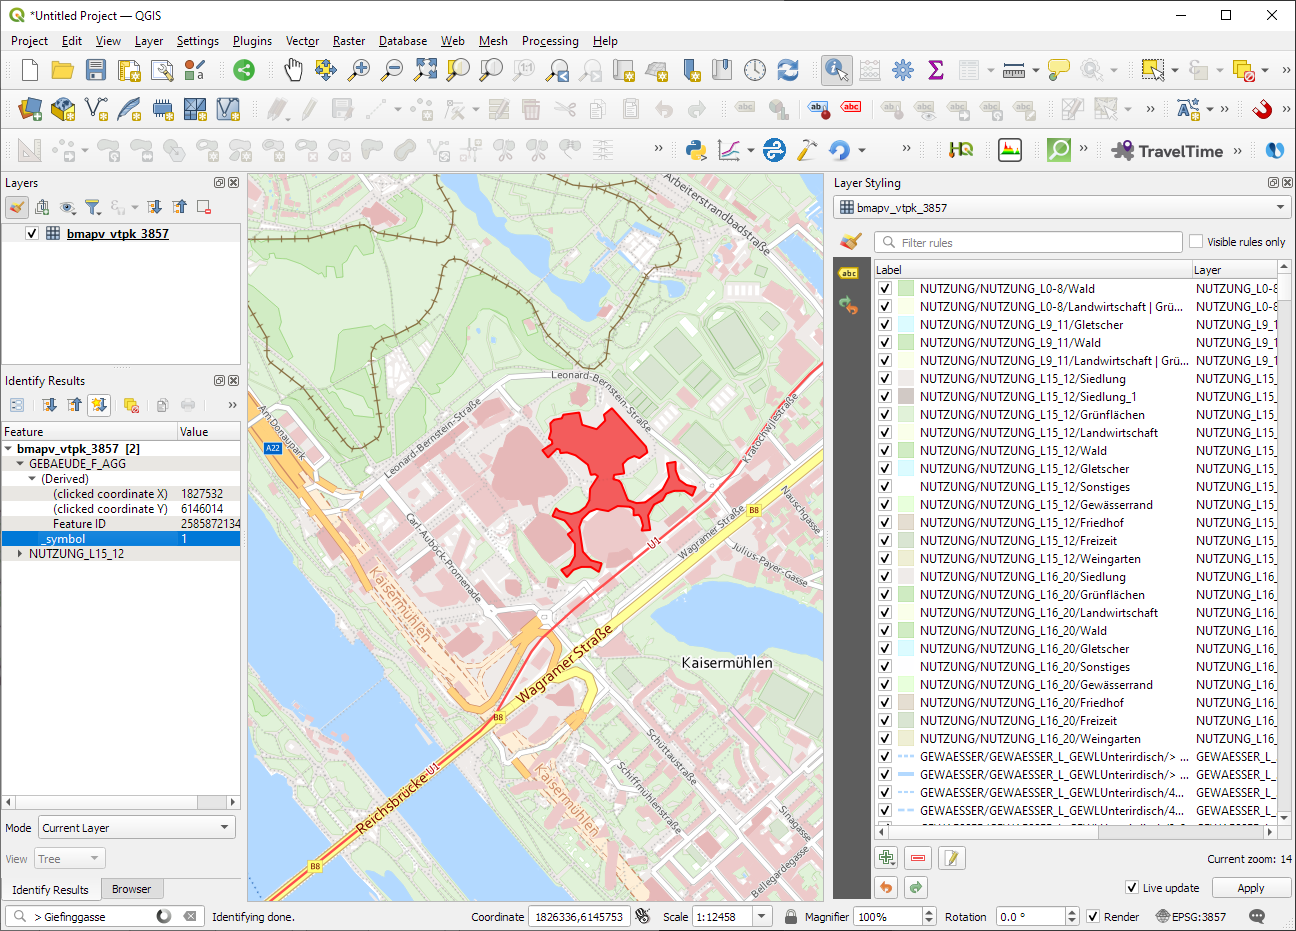
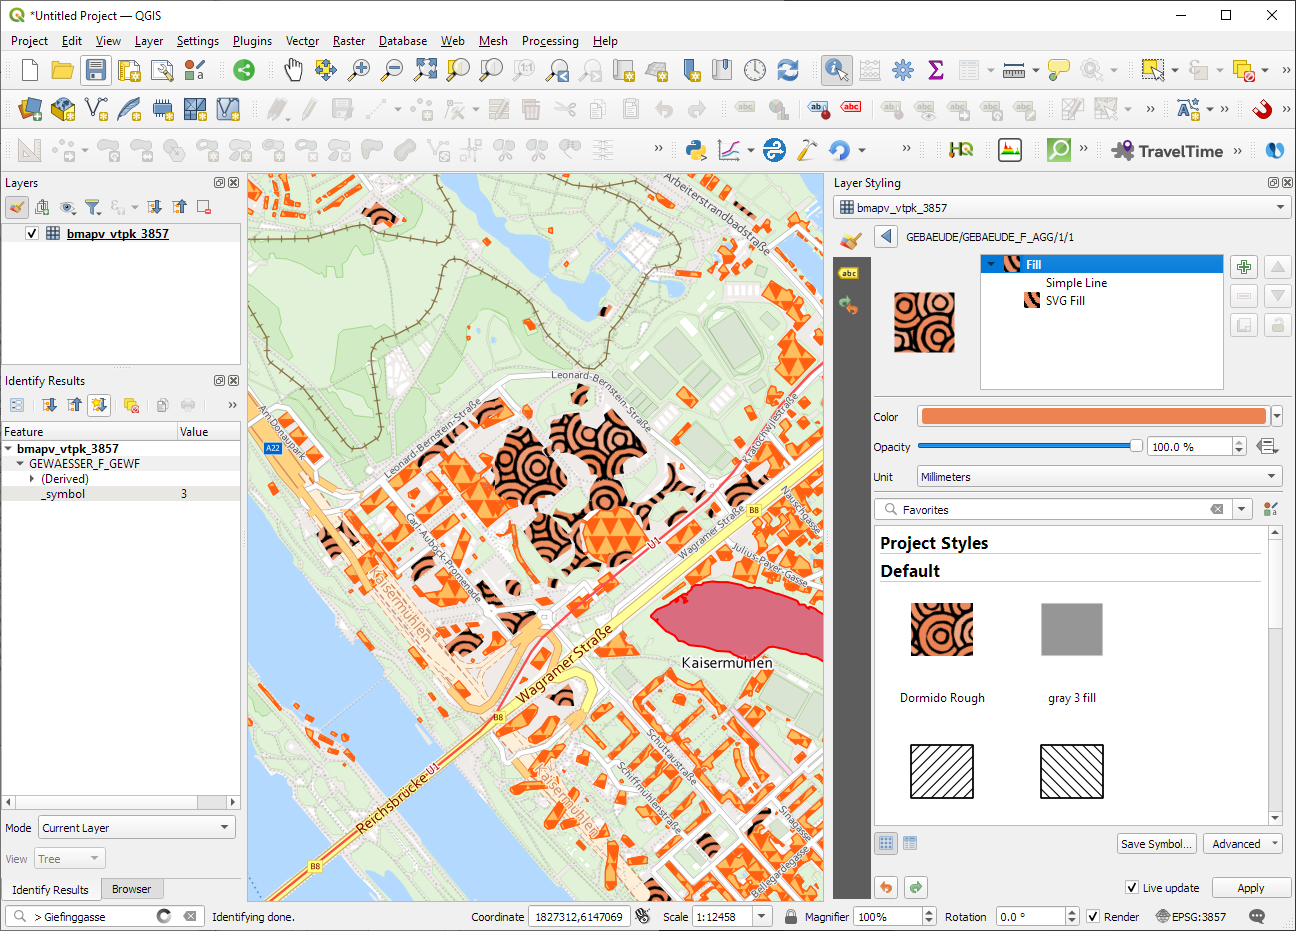
3. All done and ready, including the basemap styling and labeling — which we can customize as well:

Kudos to https://wien.rocks/@DieterKomendera/111568809248327077 for bringing this new feature to my attention.

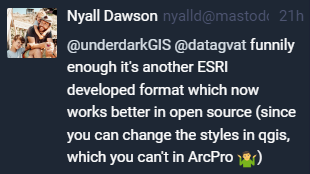
PS: And interesting tidbit from the developer of this feature, Nyall Dawson:

Official Austrian basemap and cadastre vector tiles

The BEV (Austrian Bundesamt für Eich- und Vermessungswesen) has recently published the Austrian cadastre as open data:

The URLs for vector tiles and styles can be found on https://kataster.bev.gv.at under Guide – External

The vector tile URL is:

https://kataster.bev.gv.at/tiles/{kataster | symbole}/{z}/{x}/{y}.pbf

There are 4 different style variations:

https://kataster.bev.gv.at/styles/{kataster | symbole}/style_{vermv | ortho | basic | gis}.json

When configuring the vector tiles in QGIS, we specify the desired tile and style URLs, for example:

For example, this is the “gis” style:

And this is the “basic” style:

The second vector tile source I want to mention is basemap.at. It has been around for a while, however, early versions suffered from a couple of issues that have now been resolved.

The basemap.at project provides extensive documentation on how to use the dataset in QGIS and other GIS, including manuals and sample projects:

Here’s the basic configuration: make sure to set the max zoom level to 16, otherwise, the map will not be rendered when you zoom in too far.

The level of detail is pretty impressive, even if it cannot quite keep up with the basemap raster tiles:

Vector tile details at Resselpark, Vienna
Raster basemap details at Resselpark, Vienna

Exploring ZAMG’s new open weather data

The Central Institution for Meteorology and Geodynamics (ZAMG) is Austrian’s meteorological and geophysical service. And as such, they have a large database of historical weather data which they have now made publicly available, as announced on 28th Oct 2021:

The new ZAMG Data Hub provides weather and station data, mainly in NetCDF and CSV formats:

I decided to grab a NetCDF sample from their analysis and nowcasting system INCA. I went with all available parameters for a period of one day (the data has a temporal resolution of one hour) and a bounding box around Vienna:

https://frontend.hub.zamg.ac.at/grid/d512d5b5-4e9f-4954-98b9-806acbf754f6/historical/form?anonymous=true

The loading screen of QGIS 3.22 shows the different NetCDF layers:

After adding the incal-hourly layer to QGIS, the layer styling panel provides access to the different weather parameters. We can switch between these parameters by clicking the gradient icon next to the parameter names. Here you can see the air temperature:

And because the NetCDF layer is time-aware, we can also use the QGIS Temporal Controller to step through the hourly measurements / create an animation:

Make sure to grab the latest version of QGIS to get access to all the functionality shown here.

A QGIS router for GIP.at

Monday, January 4th 2016, was the open data release date of the official Austrian street network dataset called GIP.at. As far as I know, the dataset is not totally complete yet but it should be in the upcoming months. I’ve blogged about GIP.at before in Open source IDF parser for QGIS and Open source IDF router for QGIS where I was implementing tools based on the data samples that were available then. Naturally, I was very curious if my parser and particularly the router could handle the whole country release …

Some code tweaking, patience for loading, and 9GB of RAM later, QGIS happily routes through Austria, for example from my work place to Salzburg – maybe for some skiing:

Screenshot 2016-01-06 17.11.27

The routing request itself takes something between 1 and 2 seconds. (I should still add a timer to it.)

So far, I’ve implemented shortest distance routing for pedestrians, bikes, and cars. Since the data also contains travel speeds, it should be quite straight-forward to also add shortest travel time routing.

The code is available on Github for you to try. I’d appreciate any feedback!


Routing in polygon layers? Yes we can!

A few weeks ago, the city of Vienna released a great dataset: the so-called “Flächen-Mehrzweckkarte” (FMZK) is a polygon vector layer with an amazing level of detail which contains roads, buildings, sidewalk, parking lots and much more detail:

preview of the Flächen-Mehrzweckkarte

preview of the Flächen-Mehrzweckkarte

Now, of course we can use this dataset to create gorgeous maps but wouldn’t it be great to use it for analysis? One thing that has been bugging me for a while is routing for pedestrians and how it’s still pretty bad in many situations. For example, if I’d be looking for a route from the northern to the southern side of the square in the previous screenshot, the suggestions would look something like this:

Pedestrian routing in Google Maps

Pedestrian routing in Google Maps

… Great! Google wants me to walk around it …

Pedestrian routing on openstreetmap.org

Pedestrian routing on openstreetmap.org

… Openstreetmap too – but on the other side :P

Wouldn’t it be nice if we could just cross the square? There’s no reason not to. The routing graphs of OSM and Google just don’t contain a connection. Polygon datasets like the FMZK could be a solution to the issue of routing pedestrians over squares. Here’s my first attempt using GRASS r.walk:

Routing with GRASS r.walk

Routing with GRASS r.walk (Green areas are walk-friendly, yellow/orange areas are harder to cross, and red buildings are basically impassable.)

… The route crosses the square – like any sane pedestrian would.

The key steps are:

  1. Assigning pedestrian costs to different polygon classes
  2. Rasterizing the polygons
  3. Computing a cost raster for moving using r.walk
  4. Computing the route using r.drain

I’ve been using GRASS 7 for this example. GRASS 7 is not yet compatible with QGIS but it would certainly be great to have access to this functionality from within QGIS. You can help make this happen by supporting the crowdfunding initiative for the GRASS plugin update.


Exploring open government population data collected by ODVIS-AT

At FOSS4G2013, I had the pleasure to attend a presentation about the ODVIS.AT project by Marius Schebella from the FH Salzburg. The goal of the project – which ended in Summer 2014 – was “to display open data (demographic, open government data) in a quick and easy way to end users” by combining it with OpenStreetMap. Even though their visualization does not work for me (“unable to get datasets” error), not all is lost because they provide an SQL dump of their PostGIS database.

Checking the data, it quickly becomes apparent that each data publisher decided to publish a slightly different dataset: some published their population counts as timelines over multiple years, others classified population by migration background, age, or gender. Also, according to the metadata table, no data from Salzburg and Burgenland were included. Most datasets’ reference date is between 2011 and 2013 but the data of the westernmost state Vorarlberg seems to be from 2001.

Based on this database, I created a dataset combining the municipalities with the Viennese districts and joined the population data from the individual state tables. The following map shows the population density based on this dataset: it is easy to recognize the densely populated regions around Vienna, Linz, Graz, and in the big Alpine valleys.

odvis_popdens

Overall, it is incredibly time-consuming to create this seemingly simple dataset. It would be very helpful if the publishers would agree on a common scheme for releasing at least the most basic information.

Considering that OpenStreetMap already contains population data, it barely seems worth all the trouble to merge these OGD datasets. Granted, the time lines of population development would be interesting but they are not available for each state.

P.S. If anyone is interested in the edited database, I would be happy to share the SQL dump.


  • Page 1 of 1 ( 6 posts )
  • ogd

Back to Top

Sustaining Members