Related Plugins and Tags

QGIS Planet

Sneak Peak

While it’s really exciting that the release of QGIS 2.0 is just around the corner, I’m finding it just as exciting that work is already under way on version 2.1! Some great new features have already landed and I can’t wait to see what else is planned. Personally, I’ve got plans for a raft of improvements relating to print composers with the goal of making the print composer behave as much like a full-blown DTP package as possible. In the meantime, here’s a quick teaser of a feature I’ve been working on that will hopefully be landing in master soon:

A sneak peak...

A neat trick in QGIS 2.0 – images in atlas prints

Here’s a cool trick which you can do in QGIS 2.0. It builds on two new features introduced in version 2.0 – atlas prints and html labels.

Atlas prints (previously available as a plugin, now integrated into QGIS core) were developed by Oslandia, and allow you to create data driven map layouts from a specified coverage layer. You can read more about them here.

Another new feature in QGIS 2.0 is the ability to render composer labels as html (courtesy of Olivier Dalang). This allows all kinds of fantastic effects, such as formatting text in the middle of a label (using <b>, <i>, and <font> tags) or creating labels which contain HTML tables. You can even use CSS stylesheets and rules to format the HTML! I’ve been told JavaScript also works inside the labels, but I’ve yet to try this out.

You can combine these two new features for some great tricks. Let’s say we’d like to create a set of maps of local councils, and we want each map to have a watermarked logo of the council on it. For this example I’ve created a basic basemap of Victorian councils, and I’ve downloaded all the council logos (in a variety of formats) to a local folder. Next, I’ll add an extra column to the council layer containing the name of the logo image:

adding_logo_column

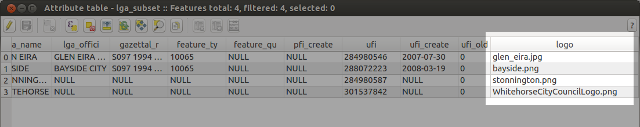
Adding a logo column to the table

Then, we’ll throw together a simple composition containing the map and set it up as an atlas print:
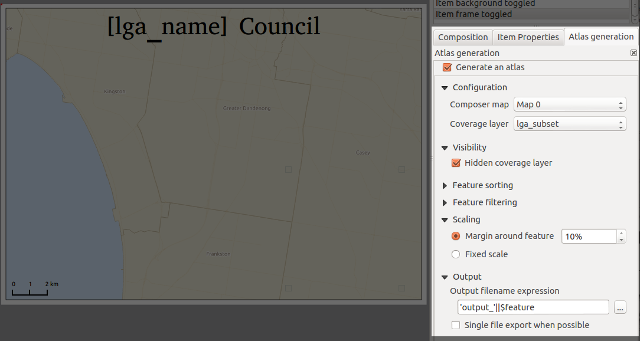
setting_up_atlas

Generating an atlas

Now for the fun bit. I’ll add a label item to the composer, set it to “Render as HTML”, and insert some specially-crafted html:

The magic HTML label...

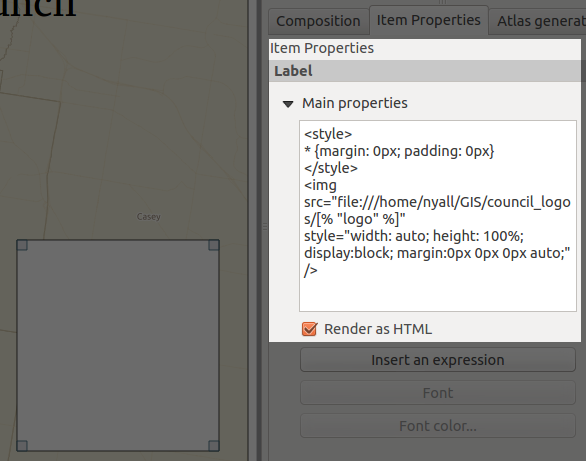
The magic HTML label…

For copy/paste purposes here’s the label contents again:

<style>
* {margin: 0px; padding: 0px}
</style>
<img src="file:///home/nyall/GIS/council_logos/[% "logo" %]"
style="width: auto; height: 100%; display: block; margin: 0px 0px 0px auto;" />

There’s a couple of things to note here. First, the magic happens in the image’s src attribute (“file:///home/nyall/GIS/council_logos/[% "logo" %]“). When the composer is exported, QGIS will replace the [% "logo" %] part with the contents of the logo field for each row in the councils table. This means the image source will then point to the local copy of the council’s logo, eg “file:///home/nyall/GIS/council_logos/glen_eira.jpg” for the first row.

Secondly, I’ve styled the image with the css:

width: auto; height: 100%; display: block;

This allows the image to resize to 100% of the height of the label while maintaining its correct aspect ratio. I’ve also added the rule

margin: 0px 0px 0px auto;

to force the image to right align within the html label. This ensures that all the watermarked logos will appear in a consistent size and position for each map.

Lastly, I’ll remove the label’s frame and background by unchecking these options, then set its transparency to 80% under the new “Rendering” section:

Yet another new feature in QGIS 2.0...

Yet another new feature in QGIS 2.0…

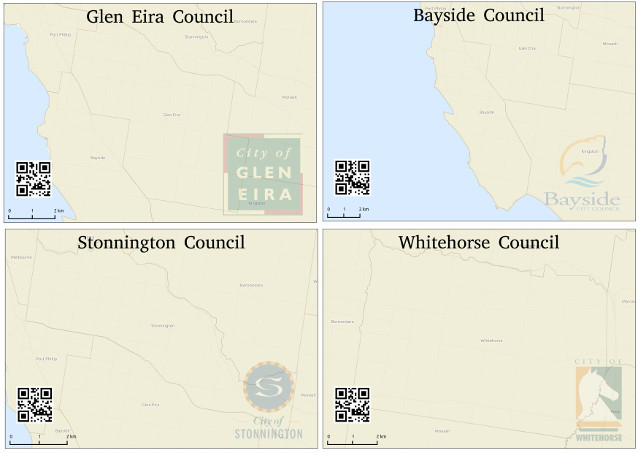
Ok, we’re all done. Now, when I select Composer -> “Export as Image”, we’ll get a lovely set of council maps complete with watermarked council logo!

A watermarked atlas!

A watermarked atlas!

There we go — all ready for print, with no manipulation in external programs required at all!

Bonus post-credits section

Here’s a kicker — the linked images don’t need to be local. That means you can even piggy-back off an existing web service to generate an image on the fly! Let’s say you were asked to add QR codes to your maps to link directly to the council website. All it takes is adding a new column to the table, then modifying the image src to read:

src="http://qrfree.kaywa.com/?l=1&s=8&d=[% "url" %]"

Now when we export the maps we’ll also get a QR image generated on the fly and inserted into the layout!

Complete with dynamically generated QR code!

Complete with dynamically generated QR code!

Combining HTML labels and atlas prints in this way is extremely powerful. This example is just touching the tip of the iceberg – I’m keen to see what the community can do with this when QGIS 2.0 is released!

Coming soon in QGIS Part 2 – Color control for raster layers

Continuing on from part 1, another feature I’ve recently pushed to QGIS is the ability to control the hue, saturation and colour of a raster layer. This builds off the excellent work done by Alexander Bruy (who added brightness and contrast controls for raster layers), and it’s another step in my ongoing quest to cut down the amount of map design tweaking required outside of QGIS. Let’s step through these new features and see what will be available when version 2.0 is released in June…

First up is the ability to tweak the saturation of a layer. Saturation basically refers to the intensity of a colour, with low saturation resulting in a more washed out, greyer image, and high saturation resulting in more vibrant and colourful images. Here’s a WMS layer showing an aerial view of Victoria at its driest, least appealing and most bushfire ready state:

Original layer

Raster layer before saturation controls…

Let’s tweak the saturation a bit to see if we can make it more appealing. In the Style tab under raster layer properties, you’ll see a new “Saturation and hue” section. For this layer I’ll bump the saturation up from its default value of zero:

Saturation settings

Saturation settings

Which results in something like this:

Resultant layer!

… and after increasing the saturation!

Ah, much better. This actually looks like somewhere I’d like to live. A bit over-the-top perhaps, but it IS handy to make quick adjustments to raster colours in this way without the need for any external programs.

How about turning an image grayscale? I regularly have to do this with street directory basemaps, and until now couldn’t find a satisfactory way of doing this in QGIS. Previously I’ve tried using various command line utilities, but never found one which could turn an image grayscale without losing embedded georeferencing tags. (I did manage to achieve it once in QGIS using a convoluted approach involving the raster calculator and some other steps I’ve thankfully forgotten.)

But now, you can forget about all that frustration and quickly turn a raster grayscale by using a control right inside the layer properties! You even get a choice of desaturation methods, including lightness, luminosity or average. Best part about this is you can then right click on the layer to save the altered version out to a full-resolution georeferenced image.

grayscale

Street map in grayscale… woohoo!

Lastly, there’s the colourise option. As expected, this behaves in a similar fashion to the colourise tools in GIMP and Photoshop. It allows you to tint a layer to a specified colour. Let’s take a WMS layer of Melbourne, tweak the brightness and contrast, and colourise it blue…

colorize_settings

Tweaking the colourize settings

… and the end result wouldn’t be out of place in Ingress or some mid 90′s conspiracy flick!

colorized

Colorized WMS layer

These changes are just a tiny, tiny part of what QGIS 2.0 has to offer. It’s looking to be a sensational release and I can’t wait for final version in June!

Coming soon in QGIS 2.0 – blend modes for layers

I’ve just pushed my first major contribution to QGIS — the ability to set the compositing mode for a layer. Compositing is a technique widely used by cartographers and graphic artists to fine tune how layers are blended together, and it allows for some spectacular results! Until now, the only way to get these effects would be to export a map to a separate editor like Photoshop or GIMP and playing with the layer modes there. But with QGIS 2.0, blending can be controlled via a simple drop down menu for both raster and vector layers:

Blending modes for a raster layer

Woohoo… blending modes in QGIS!

So what makes this so great? Well, in previous versions the only option for compositing layers in QGIS was by setting a layer’s opacity. This approach has some limitations. Let’s say you want to overlay two raster layers – a basemap layer and a heatmap. You could place the heatmap layer over the basemap and set its transparency at 50% so that the basemap shows through, but then both the basemap and heatmap layers will be partially faded out:

Overlaying layers with transparency

Overlaying layers by altering transparency – see how both the heatmap and basemap are partially faded

With QGIS 2.0, you’ll be able to use the “multiply” blend mode to overlay these layers. This means both the heatmap and underlying basemap will be shown with full intensity:

Overlaying rasters with multiply

Overlaying rasters with “multiply” blend mode – both layers are shown in their full intensity!

Ok… perhaps that’s not the prettiest example, but it is something I have to do a lot in my job. Until now it’s only been possible by exporting the map to GIMP or Photoshop/Illustrator and setting the blend modes there. That’s always fiddly, time consuming and generally frustrating all round. Much easier to just change it with a dropdown within QGIS itself.

Let’s move on to some more impressive example. First, here’s a terrain map using a combination of a landcover thematic with ‘overlay’ blending and a hillshade set to ‘multiply‘ blending. The graticule lines are also set to overlay – note how they aren’t visible over the lighter water areas and brighter hillshade regions.

Hill shading with advanced compositing

Hill shading with advanced compositing… Hal Shelton would be proud!

Ok, that’s nice, but let’s try something a little different. Using a combination of darkenscreenhard light and overlay:

Stamen-style watercolors directly within QGIS!

Live Stamen-style watercolors within QGIS – sweet!

These a just some rough examples — I’m keen to see what results others get using this feature (feel free to post links to your work in the comments).

One final note: I’m really appreciative of the efforts of the QGIS dev team, who’ve been really supportive and helpful while I find my way around the QGIS codebase. A big thank you has to go to Nathan Woodrow for taking the time to review this commit and answering all the questions I’ve had!

  • Page 1 of 1 ( 4 posts )
  • 2.0

Back to Top

Sustaining Members