Related Plugins and Tags

QGIS Planet

How Oslandia invests in OpenSource

You may be wondering where Oslandia’s name is coming from ? Or maybe you already know ? In this article we focus on the “OS” part of Oslandia : OpenSource !

Oslandia positions itself as IT expert in the field of OpenSource geographical information systems. QGIS is namely one of the proheminent opensource softwares for the geospatial industry. This position is a key element of our business model.

But do you know how we work behind the scene ? This article will give you an opportunity to discover some of our contributions to the OpenSource ecosystem.

Principles

Our general business model is based on projects we carry out for our clients. They fund us to design and implement solutions adapted to their needs and requirements. Part of these developments consist in core development of Opensource software. This allows us to contribute actively to FOSS4G components.

But this funding method makes it complicated to fund maintenance, or new exploratory developments, as well as communication, community management or other tasks necessary for healthy opensource projects.

As a consequence, we introduced at Oslandia a mechanism of internal OpenSource project grants.

These grants constitute self-investment from the company into the OpenSource ecosystem, and can be applied to new projects, research and development or existing projects.

This mechanism has multiple interests :

  • For opensource projects : maintenance and new contributions
  • For Oslandia : image and potential new business opportunities
  • For the team : work on projects that matter to them

These OpenSource grants consist in a large range of possible tasks, as we often say : “Opensource projects are not only code”. Instead of developers, we prefer the term contributors. Development, code review, maintenance, documentation, community management, communication, each collaborator can choose the type of task to focus on.

We differentiate software maintenance grants and opensource project grants. We call the latter “OpenSource mini-projects

Software maintenance consists in refactoring, bugfixing, packaging, release management… All these tasks need dedicated time which is difficult to fund directly on client’s project.

Opensource mini-projects grants are specific opensource proposal which can be submitted by any collaborator on any subject. We then vote on the best proposal and the team can start working on the subject within the allocated budget.

Some numbers

We allocate around 5% of the global production time to software maintenance grants. Our Opensource maintenance grant for 2022 is therefore approximately 190 days of work. It mainly focus on QGIS, PostGIS, QWC2, Giro3D and a few other components we actively maintain.

We also allocate 5% of the global production time to opensource mini-projects grants. It represents an additional 190 days of work for 2022.

Oslandia therefore invests almost 400 days of work into the OpenSource ecosystem, outside of direct contributions for client’s projects.

Opensource Mini-projects

OpenSource mini-projects grants are submitted by Oslandia’s collaborators and focus on various task and thematics : innovation, development, design, prototyping, communication or any other kind of Opensource contribution.

Proposals have to define goals, deliverables, planning, team and needed budget. Then we evaluate the proposals given the following criteria :

  • proposal coherency ( e.g. deliverables vs budget )
  • alignment with Oslandia’s strategy
  • innovation level
  • business opportunities
  • fun and motivation
  • impacts in terms of communication
  • links with other projects at Oslandia
  • possibility of extra R&D funding

We then vote on best proposal and manage these mini-projects just as a client project.

Examples

QGIS

The maintenance grant on QGIS allowed us to work on the following tasks :

  • Bugfixing
  • Code review for PRs submitted by other developers
  • Code refactoring
  • Documentation
  • Packaging pipeline
  • OSGeo4W improvement

OpenSource mini-projects grants

During the year of 2022, we worked on the following mini-projects :

In 2023 we will continue to work on these projects, and others ! for example pg_featureserv, py3dtiles, infoclimat website, MapProxypgRouting

Conclusion

This investment mechanism allows Oslandia to be an opensource “pure player” and contribute actively to these OpenSource projects and to the OpenSource ecosystem as a whole.

Should you be interested in our contribution model, or if you have any question regarding our internal OpenSource grant program, do not hesitate to contact us : [email protected] !

QField 2.0 Arctic Fox is here

Let’s not paraphrase it, QField 2.0 is here and it is taking professional GIS fieldwork to a completely new level.

TL;DR

After an intense development and testing period, we are ready, QField 2.0 is out.

QField 2.0 is packed with new features that will make your professional fieldwork even more efficient. You can get a taste of all you will be getting with this major update on QField’s changelog. Be aware, it will blow your mind… 🤯

If you do not have it yet, get it now!

Work efficiently 🚀 – Be anywhere ⛰ – Open anything 🔧

Survey and digitise data in no time. QField is the professional mobile app for QGIS, allowing users to deploy their existing QGIS projects to the field.

Edit your data on the go. The seamless integration with QFieldCloud allows your team to work on your projects anywhere anytime.

Open a wide range of spatial data formats, connect to industry-leading spatial databases and consume standardised geowebservices.

The 🤖 looks out of the 🪟 and sees lots of 🍎

For Android, iOS and Windows tablets and mobiles. But also for Linux, macOS and Windows laptops and desktops.

QField can be installed basically anywhere and can help thanks to its simplicity even on desktop work.
If you do not have it yet, get it now!

What mountain is Arctic Fox?

If you have been following QFields development, you might remember that we named each release after a mountain. We are very outdoorsy and this was a sort of tribute to the places we love. With each release, we had great fun looking for places that would be meaningful for us and our community. From beautiful mountains outside our window to the remotest island mountain on Earth and even further.

After Elbrus (0.5), Finsteraarhorn (0.6), Gonnus Mons (0.7), Hiendertelltihoren (0.8), Jungfraujoch (0.9), Kesch (0.10), Lucendro (0.11), Matterhorn (1.0 – 1.2), Ben Nevis (1.3), Olavtoppen (1.4), Piz Palü (1.5), Qinling (1.6), Rockies (1.7), Selma (1.8), Taivaskero (1.9) and Uluru (1.10), we decided to change the subject and for the 2.X series we’ll name the releases after cool animals that reflect different characteristics of QField.

The arctic fox is an incredibly hardy animal that can survive frigid Arctic temperatures as low as –50°C in the treeless lands where it makes its home. It has furry soles, short ears, and a short muzzle—all-important adaptations to the chilly clime. Arctic foxes live in burrows, and in a blizzard, they may tunnel into the snow to create shelter.

Like an Arctic Fox, QField is perfectly adapted to the outdoors and helps you get your data in the most efficient way possible.

Ah yes, and they seem to be pretty good navigators and tech-savvy too: https://www.space.com/arctic-fox-epic-journey-satellite-tracking.html

Packed with new functionalities

Obviously, the big news in QField 2.0 is the integration with QFieldCloud BETA, but besides that, we’ve added a lot of new features and fixed plenty of bugs. If you are interested in all the details, you should go to the changelog page and check out all the new goodies. If you just want the major additions, here you go:

  • – Support for the opening of projects and datasets directly from your favourite messenger app, browser, etc. on Android.
  • – Support for opening ZIP compressed projects on Android.
  • – Support for remote datasets via GDAL’s /vsicurl/ URIs
  • – Greatly improved scale bar overlay
  • – Incremental improvements to the user interface all across QField

Cloudy ☁ with a chance of meatballs

QFieldCloud’s unique technology allows your team to focus on what’s important, making sure you efficiently get the best field data possible. Thanks to the tight integration with QField, you will be able to start surveying and digitising data in no time.

Some of you may already have been part of the closed BETA testing phase. THANKS!
For all the others, great news, QFieldCloud is now officially in open BETA.

You can register directly from QField 2.0 or simply head to qfield.cloud and create your free account now.

What is QFieldCloud?

Seamless synchronisation

QFieldCloud is a synchronisation platform, that we offer as a service, which takes the pain out of syncing data from multiple data collectors. Thanks to seamless synchronization, your surveyors will be able to push their work anytime they want. Working in the wild? Your team can continue working with no limitations and sync back their changes once back in town.

Team management

QFieldCloud’s fine-grained permissions system allows you to efficiently define who can collaborate with you on your projects and what operations they are allowed to perform. You can for example add a junior surveyor as a reporter, a senior one as a project manager and you can even add users with read-only permissions.

Hosted or in your own cloud – open source

QFieldCloud perfectly integrates and extends your QGIS based geodata infrastructure, you can either subscribe for a worry-free Swiss-made solution hosted on Swiss data centres or contact us for your private cloud instance.

QFieldCloud code is open source so you can see what is actually happening to your data.

Known issues

Please note that on older AMRv7 architectures, some devices are suffering from a crash at launch. As such, we have not yet updated QField to 2.0 for these devices. If you own one such device and want to manually download and install QField, please visit the release page on GitHub.

Also, since November 2021, Google has enforced new storage access limitations for apps published on its Play store which prohibits direct storage access on Android 11 and above forcing QField to adapt and rely on importing projects and datasets to access those. As part of the enforcement of these new policies, Google came up with an arbitrary mechanism to whitelist some apps which allows those to retain full storage access given the user explicitly allowed for it. We here at OPENGIS.ch believe QField had ample justifications to be whitelisted, however, Google’s appeal process judged otherwise after a series of email exchanges detailing our reasoning. While we have so far lost this argument with Google, we will continue fighting for our users and for their freedom to choose. If you are interested in more details, read our blog post about it.

Join the effort

QField is an open-source project. It is free to share, use and modify and it will stay like that. We are very happy if this app helps you in whatever creative way you may use it. If you found it useful, we will be even happier if you could give something back. You can easily sponsor QField, contribute some help or ask us to develop a new feature.

QField collected data crucial in disaster relief after Tonga’s volcanic eruption

For once, it’s not an app from the Silicon Valley, but from Laax in the Swiss Alps that made the news. By publishing QField as an open-source app, OPENGIS.ch allows companies, organisations and even countries without the necessary financial means to have the opportunity to benefit from this important data collection app. And it is being used: Over half a million downloads have already been achieved. Now, since the volcanic eruption in Tonga on 15 January 2022, the app of the small Laax-based company is playing a not-unimportant role in disaster response planning. 

We’ve only been around for seven years. We could almost pass for a start-up. But OPENGIS.ch is already a household name when it comes to field data collection. OPENGIS.ch makes its field mapping tool QField available without restrictions (i.e. open-source) so that companies or even nations can collect their geographical data. In this way, data is brought from the field to the office and provides important insights for future decisions.

This was also the case for Tonga’s volcanic eruption. There, in December 2021, many relevant agricultural datasets were captured with “QField” and “QFieldCloud”. This currently helps the Ministry of Agriculture, Food, Forests, and Fisheries to analyse the damage after the volcanic eruption and the subsequent tsunami and plan the response.

Swiss software in use for Tonga

It is a technical and ethical decision for me. I want not only the privileged nations to benefit from our work.

Marco Bernasocchi, CEO

Co-founder Marco Bernasocchi’s credo is to focus on further developing the product (QField). OPENGIS.ch makes it freely available, so that nations like Tonga, with little financial means, can use professional software and invest their financial resources in reconstruction. “It is a technical and ethical decision for me. I want not only the privileged nations to benefit from our work. We are always developing the product and generate income mainly from support, paid developments and custom solutions. Our product, however, is publicly accessible”. This strategy is successful: the company is 90% financed by Swiss customers but the app is used all over the world. “Open source is a technological advantage for me. This way we get the input of many developers worldwide who are motivated to work out the best possible software. This leads to a superior product and is particularly valuable to me.,” adds Matthias Kuhn, co-founder of OPENGIS.ch.

This way we get the input of many developers worldwide who are motivated to work out the best possible software.

Matthias Kuhn, CTO

John Duncan, project manager at the University of Western Australia, who is working on the project in support of Tonga, explains the work done in December like this: “the workflow uses QField to map the extent of landscape features including agricultural fields and cropped holdings, recording detailed attributes about each feature’s farming system. QFieldCloud was used to support large teams of data collectors tasked with surveying every tax allotment across Tonga. The initiative has resulted in the detailed mapping of cropping and livestock systems for over 11,000 farms across Tonga’s three main island groups. These datasets provide actionable information for short-term decision making around food security, agricultural planning, and disaster response, and are a valuable resource for longer-term monitoring of agricultural and environmental changes in these climate-vulnerable locations.

The data was originally intended for food security and agricultural planning. But now they suddenly have acquired enormous value and can be used for disaster response planning. 

John Duncan, University of Western Australia

Further information on QField in connection with Tonga: 

Media articles

About OPENGIS.ch

OPENGIS.ch GmbH is a Swiss software development company based in Laax. OPENGIS.ch employs 19 people and works mainly in the field of spatial software development, geodata infrastructure deployments and professional support. Personalised open source GIS solutions are often planned and developed as desktop or mobile applications. OPENGIS.ch finances itself through tailor-made customer solutions, professional support and adaptations. Link: https://opengis.ch

OPENGIS.ch team in Summer 2021 company retreat

About the OPENGIS.ch product “QField” application

“QField” is an open-source app developed for efficient fieldwork in real-time in urban areas, with 5G connection or with offline data. The mobile GIS app combines a minimal design with sophisticated technology to conveniently bring data from the field to the office. Seamless QGIS integration, GPS centred, offline functionality, synchronisation capabilities, desktop configurable: “QField” is designed for fieldwork – simple but uncompromising. Link: https://qfield.org

About the OPENGIS.ch service “QFieldCloud

“QFieldCloud” is a spatial cloud service integrated into “QField” that allows remote provisioning and synchronisation of geodata and projects. Although “QFieldCloud” is still in an advanced beta stage, it is already being used by many groups to significantly improve their workflows. Link: https://qfield.cloud

Marco becomes QGIS.org Chair

Serving as a pragmatic community conciliator – collecting thoughts from people with differing opinions and trying to find the high road through difficult issues – I want to focus my and the community’s energies on our core product, QGIS.

Marco Bernasocchi · QGIS.org Chair

OPENGIS.ch has always been dedicated to sustaining QGIS’ technological and economical well-being, supporting it with endless hours of internally funded QA, infrastructure works and developments.

Today we are very proud to announce that our commitment has grown even more as one of our founders and CEO Marco Bernasocchi was elected Chair of the QGIS.org association.

With over 15 years of involvement with QGIS (he started working with QGIS 0.6) and two years serving as vice-chair, Marco will serve for the next two years as Chairperson of the QGIS.org association.

Understanding the importance of the role trusted him, Marco would like to thank the QGIS community for the trust and appreciation. Marco is looking forward to intensifying work with the PSC and the fantastic QGIS community to push QGIS even further.

We wish Marco and the rest of the elected PSC two very successful years full of QGIS awesomeness.

Rock on QGIS! – read more at QGIS Annual General Meeting – 2020

Marco’s vision for QGIS.org:

I want to help QGIS and it’s community thrive under the value proposition of:

Making the most amazing opensource GIS that provides users with value and that meets their needs by providing great functionality and usability, being cost-effective whilst being actively supported by a vibrant and knowledgeable community.

Sharing our work under an open-source license is part of the approach by which we achieve that value proposition as it allows broad collaboration with our developers and users community.

I see FOSS as a very socially responsible way to develop software, but even more, I see the immense technological advantage that writing open-source code brings. This is why I want our focus to be on allowing both pragmatic and ideological views to respectfully coexist and enrich each other.

One of my main motivations to be part of the PSC and to make myself available as project Chair is to help QGIS keep this incredible growth rate by being even more attractive to new community members, sponsors and large/corporate users. To achieve this, the key is maintaining the right balance between sustainable processes (that guarantee the great quality QGIS has been known for) and an interesting and motivating grassroots project to ensure that QGIS remains an attractive project for volunteers to contribute to and help QGIS and its community to grow to become even more the reference [Open Source] GIS project.

QGIS Versioning now supports foreign keys!

QGIS-versioning is a QGIS and PostGIS plugin dedicated to data versioning and history management. It supports :

  • Keeping full table history with all modifications
  • Transparent access to current data
  • Versioning tables with branches
  • Work offline
  • Work on a data subset
  • Conflict management with a GUI

QGIS versioning conflict management

In a previous blog article we detailed how QGIS versioning can manage data history, branches, and work offline with PostGIS-stored data and QGIS. We recently added foreign key support to QGIS versioning so you can now historize any complex database schema.

This QGIS plugin is available in the official QGIS plugin repository, and you can fork it on GitHub too !

Foreign key support

TL;DR

When a user decides to historize its PostgreSQL database with QGIS-versioning, the plugin alters the existing database schema and adds new fields in order to track down the different versions of a single table row. Every access to these versioned tables are subsequently made through updatable views in order to automatically fill in the new versioning fields.

Up to now, it was not possible to deal with primary keys and foreign keys : the original tables had to be constraints-free.  This limitation has been lifted thanks to this contribution.

To make it simple, the solution is to remove all constraints from the original database and transform them into a set of SQL check triggers installed on the working copy databases (SQLite or PostgreSQL). As verifications are made on the client side, it’s impossible to propagate invalid modifications on your base server when you “commit” updates.

Behind the curtains

When you choose to historize an existing database, a few fields are added to the existing table. Among these fields, versioning_ididentifies  one specific version of a row. For one existing row, there are several versions of this row, each with a different versioning_id but with the same original primary key field. As a consequence, that field cannot satisfy the unique constraint, so it cannot be a key, therefore no foreign key neither.

We therefore have to drop the primary key and foreign key constraints when historizing the table. Before removing them, constraints definitions are stored in a dedicated table so that these constraints can be checked later.

When the user checks out a specific table on a specific branch, QGIS-versioning uses that constraint table to build constraint checking triggers in the working copy. The way constraints are built depends on the checkout type (you can checkout in a SQLite file, in the master PostgreSQL database or in another PostgreSQL database).

What do we check ?

That’s where the fun begins ! The first thing we have to check is key uniqueness or foreign key referencing an existing key on insert or update. Remember that there are no primary key and foreign key anymore, we dropped them when activating historization. We keep the term for better understanding.

You also have to deal with deleting or updating a referenced row and the different ways of propagating the modification : cascade, set default, set null, or simply failure, as explained in PostgreSQL Foreign keys documentation .

Nevermind all that, this problem has been solved for you and everything is done automatically in QGIS-versioning. Before you ask, yes foreign keys spanning on multiple fields are also supported.

What’s new in QGIS ?

You will get a new message you probably already know about, when you try to make an invalid modification committing your changes to the master database

Error when foreign key constraint is violated

Partial checkout

One existing Qgis-versioning feature is partial checkout. It allows a user to select a subset of data to checkout in its working copy. It avoids downloading gigabytes of data you do not care about. You can, for instance, checkout features within a given spatial extent.

So far, so good. But if you have only a part of your data, you cannot ensure that modifying a data field as primary key will keep uniqueness. In this particular case, QGIS-versioning will trigger errors on commit, pointing out the invalid rows you have to modify so the unique constraint remains valid.

Error when committing non unique key after a partial checkout

Tests

There is a lot to check when you intend to replace the existing constraint system with your own constraint system based on triggers. In order to ensure QGIS-Versioning stability and reliability, we put some special effort on building a test set that cover all use cases and possible exceptions.

What’s next

There is now no known limitations on using QGIS-versioning on any of your database. If you think about a missing feature or just want to know more about QGIS and QGIS-versioning, feel free to contact us at [email protected]. And please have a look at our support offering for QGIS.

Many thanks to eHealth Africa who helped us develop these new features. eHealth Africa is a non-governmental organization based in Nigeria. Their mission is to build stronger health systems through the design and implementation of data-driven solutions.

Funding for selective masking in QGIS is now complete!

Few months ago, Oslandia launched QGIS lab’s , a place to advertise our new ideas for QGIS, but also a place to help you find co funders to make dreams become reality.

The first initiative is about label selective masking, a feature that will allow us to achieve even more professional rendering for our maps.

Selective masking


Thanks to the commitment of the Swiss QGIS user group and local authorities, this work is now funded !

We now can start working hard to deliver you this great feature for QGIS 3.10

Thanks again to our funders

A last word, this is not a classical crowd funding initiative, but a classical contract for each funder.

No more reason not to contribute to free and open source software!

New QGIS geometry editing tool: trim/extend

Oslandia is continuing to improve QGIS to offer the draftsman the same experience as with the computer-aided design (CAD) software on the market.
Today we introduce you to the “trim/extend” tool.

As its name suggests, this tool, well known to CAD draftsmen, allows you to trim / shorten or extend segments.

However, where CAD tools impose some limitations – such as using on the end of polyline segments and only on 2D objects – we wanted to go further in QGIS:
– you can modify any segment of a line or polygon geometry and not just its end;
– you can of course modify multi geometries;
– you can hang on to 3D points.

Click to view our demo video.

The tool will be available in version 3.6, but you can use it now in the development version, via the advanced Windows installer for example

This tool was developed thanks to the funding of the Megève Town Hall, which we would like to thank in particular.

It is still possible to improve the tool by offering:

– multiple selection of limits and entities to be modified;
– an option to modify the two selected entities up to their intersection point;
– better support for curved geometries in the future;
– to add topology support when using the tool.

Would you like to participate in its improvement or the development of QGIS?

Need a study or support to move from CAD to GIS?

Do not hesitate to contact us.

Follow us also on twitter or Linkedin to be informed about our new CAD tools in QGIS.

QGIS Server 3 : OGC Certification work for WFS 1.1.0

QGIS Server is an open source OGC data server which uses QGIS engine as backend. It becomes really awesome because a simple desktop qgis project file can be rendered as web services with exactly the same rendering, and without any mapfile or xml coding by hand.

QGIS Server provides a way to serve OGC web services like WMS, WCS, WFS and WMTS resources from a QGIS project, but can also extend services like GetPrint which takes advantage of QGIS’s map composer power to generate high quality PDF outputs.

Since the 3.0.2 version, QGIS Server is certified as an official OGC reference implementation for WMS 1.3.0 and reports are generated in a daily continuous integration to avoid regressions.


Thus, the next step was naturally to take a look at the WFS 1.1.0 thanks to the support of the QGIS Grant Program

Side note, this Grant program is made possible thanks to your direct sponsoring and micro-donations to QGIS.org.

TEAM Engine test suite for WFS 1.1.0

We use a tool provided by the OGC Compliance Program to run dedicated tests on the server : Teamengine (Test, Evaluation, And Measurement Engine).

Test suites are available through a web interface. However, for the needs of continuous integration, these tests have to be run without user interaction. In the case of WMS 1.3.0, nothing more easy than using the REST API:

$ curl "http://localhost:8081/teamengine/rest/suites/wms/1.20/run?queryable=queryable&basic=basic&capabilities-url=http://172.17.0.2/qgisserver?REQUEST=GetCapabilities%26SERVICE=WMS%26VERSION=1.3.0%26MAP=/data/teamengine_wms_130.qgs


However, the WFS 1.1.0 test suite does not provide a REST API and makes the situation less straightforward. We switched to using TEAM Engine directly from command line:

$ cd te_base
$ ./bin/unix/test.sh -source=wfs/1.1.0/ctl/main.ctl -form=params.xml

The params.xml file allows to configure underlying tests. In this particular case, the GetCapabilities URL of the QGIS Server to test is given.  Results are available thanks to the viewlog.sh shell script:

$ ./bin/unix/viewlog.sh -logdir=te_base/users/root/ -session=s0001
Test wfs:wfs-main type Mandatory (s0001) Failed (InheritedFailure)
   Test wfs:readiness-tests type Mandatory (s0001/d68e38807_1) Failed (InheritedFailure)
      Test ctl:SchematronValidatingParser type Mandatory (s0001/d68e38807_1/d68e588_1) Failed
      Test wfs:basic-main type Mandatory (s0001/d68e38807_1/d68e636_1) Failed (InheritedFailure)
         Test wfs:run-GetCapabilities-basic-cc-GET type Mandatory (s0001/d68e38807_1/d68e636_1/d68e28810_1) Failed (InheritedFailure)
            Test wfs:wfs-1.1.0-Basic-GetCapabilities-tc1 type Mandatory (s0001/d68e38807_1/d68e636_1/d68e28810_1/d68e1095_1) Passed
               Test ctl:assert-xpath type Mandatory (s0001/d68e38807_1/d68e636_1/d68e28810_1/d68e1095_1/d68e1234_1) Passed
            Test wfs:wfs-1.1.0-Basic-GetCapabilities-tc2 type Mandatory (s0001/d68e38807_1/d68e636_1/d68e28810_1/d68e1100_1) Passed
               Test ctl:assert-xpath type Mandatory (s0001/d68e38807_1/d68e636_1/d68e28810_1/d68e1100_1/d68e1305_1) Passed
            Test wfs:wfs-1.1.0-Basic-GetCapabilities-tc3 type Mandatory (s0001/d68e38807_1/d68e636_1/d68e28810_1/d68e1105_1) Passed
               Test ctl:assert-xpath type Mandatory (s0001/d68e38807_1/d68e636_1/d68e28810_1/d68e1105_1/d68e1558_1) Passed
               Test ctl:assert-xpath type Mandatory (s0001/d68e38807_1/d68e636_1/d68e28810_1/d68e1105_1/d68e1582_1) Passed
               Test ctl:assert-xpath type Mandatory (s0001/d68e38807_1/d68e636_1/d68e28810_1/d68e1105_1/d68e1606_1) Passed
...
...

Finally, a Python script has been written to read these logs and generate HTML report easily readable. Thanks to our QGIS-Server-CertifSuite, providing the continuous integration infrastructure with Docker images, these reports are also generated daily.

Bugfix and Conclusion

First results were clear: a lot of work is necessary to have a QGIS Server certified for WFS 1.1.0!

We started fixing the issues one by one:

And now we have a much better support than 6 months ago

However, some work still need to be done to finally obtain the OGC certification for WFS 1.1.0. To be continued!

Please contact us if you want QGIS server to become a reference implementation for all OGC service !

French Ministry in charge of the ecological transition selected Oslandia

Ministère de la Transition Écologique et Solidaire Logo

The French ministry of the ecological transition  selected Oslandia for two of the three packages of its call for tender procedure dedicated to geomatic tools.  We are very proud to dedicate our team to one of the strongest support of geomatics and Open Source in France for the next 2 to 4 years.

First package is dedicated to expert studies covering spatial databases, software, components, protocols, norms and standards in the geomatics fields.

Second package provides support and development for QGIS,  the spatial cartridge PostGIS of PostgreSQL and their components. We are really happy to continue a common work already engaged in the previous contract.

This is again another proof that we face a major tendency of open source investment, where geomatics components are currently among the most dynamic and strongest open source projects. This is also a confirmation that actors are now integrating deeply the economic rationale of open source contribution inside their politics.

QGIS 3.0 has been released

We are very pleased to convey the announcement of the  QGIS 3.0 major release called “Girona”.

The whole QGIS community has been working hard on so many changes for the last two years. This version is a major step in the evolution of QGIS. There are a lot of features, and many changes to the underlying code.

At Oslandia, we pushed some great new features, a lot of bugfixes and made our best to help in synchronizing efforts with the community.

Please note that the installers and binaries are still currently being built for all platforms, Ubuntu and Windows are already there,  and Mac packages are still building.

The ChangeLog and the documentation are still being worked on so please start testing that brand new version and let’s make it stronger and stronger together. The more contributors, the better!

While QGIS 3.0 represent a lot of work, note that this version is not a “Long Term Release” and may not be as stable as required for production work.

We would like to thank all the contributors who helped making QGIS 3 a reality.

Oslandia contributors should acknowledged too : Hugo Mercier, Paul Blottière, Régis Haubourg, Vincent Mora and Loïc Bartoletti.

We also want to thank some those who supported directly important features of QGIS3 :

Orange

The QWAT / QGEP organization

The French Ministry for an Ecological and Inclusive Transition

ESG

and also Grenoble Alpes Métropole

QGIS versioning plugin

We developped a tool to manage data history, branches, and to work offline with your PostGIS-stored data and QGIS. Read more to get the insight of QGIS Versioning plugin.

The QGIS plugin is available in QGIS plugin repository, and you can `fork it on GitHub too https://github.com/Oslandia/qgis-versioning !

Introduction

Even if the necessity of data versioning often arises, no standard solution exist for databases.

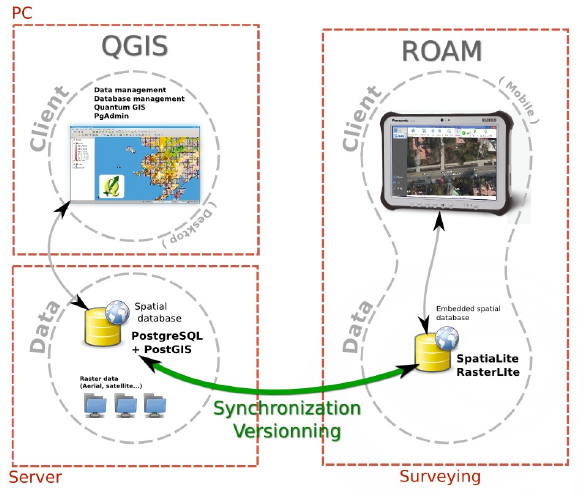
The GeoGit project proposes a solution to store versioned geospatial data. There is also an existing plugin for QGIS, pgversion, which uses views and triggers to version a PostGIS database. Unfortunately those solutions were not adapted to the specific constrains of this project, namely: using a PostGIS database as the main repository (excludes GeoGit) and the ability to working off-line (excludes pgversion).The project we developed QGIS/PostGIS versioning looks like the following.


Design

The database is stored in a PostGIS schema, the complete schema is versioned (i.e. not individual tables). Revisions are identified by a revision number. A revision table in the versioned schema, called ‘revisions’, keeps track of the date, author, commit message and branch of all revisions.

Once a table structure is defined, three operations can be performed on rows: INSERT, DELETE and UPDATE. To be able to track history, every row is kept in the tables. Deleted rows are marked as such and updated rows are a combined insertion-deletion where the deleted and added rows are linked to one another as parent and child.|

A total of five columns are needed for versioning the first branch:

PRIMARY KEY
a unique identifier across the table

branch_rev_begin
revision when this record was inserted

branch_rev_end
last revision for which this record exist (i.e. revision when it was deleted minus one)

branch_parent
in case the row has been inserted as the result of an update, this fields stores the hid of the row that has been updated

branch_child
in case the row has been marked as deleted as the result of an update, this field stores the hid of the row that has been inserted in its place.

For each additional branch, four additional columns are needed (the ones with the prefix branch_).

Note:
If the branch_rev_begin is null, it means that a row belongs to another branch.

SQL views are used to see the database for a given revision number. If we note ‘rev’ the revision we want to see. For each table, the condition for a row to be present is the view is::

(branch_rev_end IS NULL OR branch_rev_end >= rev) AND branch_rev_begin <= rev

In the special case of the current revision, or head revision, the condition reads::

branch_rev_end IS NULL AND branch_rev_begin IS NOT NULL

Note:
Since elements are not deleted (but merely marked as such) from an historized table, care must be taken with the definition of constrains, in particular the conceptual unicity of a field values.

Withing the PostGIS database, the views on revisions must be read-only  and historized tables should not be edited directly. This is a basic principle for version control: editions must be made to working copies an then committed to the database. Please note that by default PostGIS 9.3 creates updatable views.
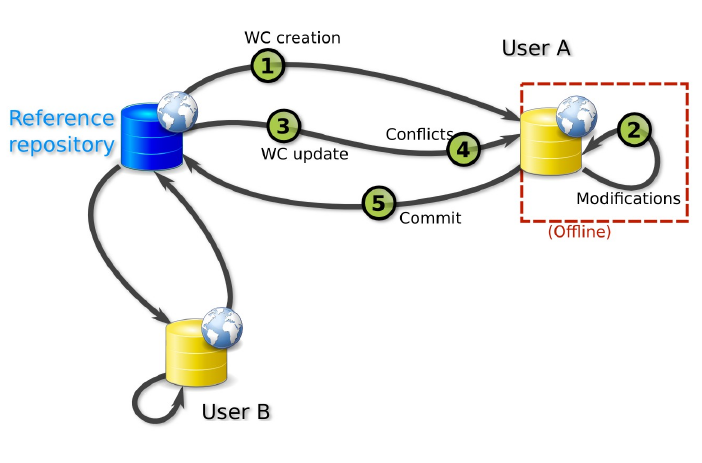
Workflow schema

This setup allows for multiple users to use and edit data offline from a central repository, and commit their modifications concurrently.

Working copies

Two kinds of working copies are available:

SpatiaLite working copies
They are meant to be used off-line. They consist of the versioned tables of a given versioned database (i.e. PostGIS schema) or any subset. For each table, only the elements that have not been marked as deleted in the head revision need to be present. Furthermore only a subset of the elements the user needs to edit can be selected (e.g. a spatial extend).  To create a working copy (i.e. to checkout), tables from the versioned schema (or the aforementioned subsets) are converted to a SpatiaLite database using ogr2ogr.

PostGIS working copies
They are meant to be used when the connection to the original database will remain available. They are quite similar to pgversion working copies since they only store differences from a given revision (the one checked out).

The following description is aimed at understanding the inner workings of the qgis versioning plugin. The user does not need to perform the described operations manually.

For each versioned table in the working copy, a view is created with the suffix _view (e.g. mytable_view). Those views typically filters out the historization columns and shows the head revision. A set of triggers is defined to allow updating on those views (DELETE, UPDATE and INSERT).

The DELETE trigger simply marks the end revision of a given record.

The INSERT trigger create a new record and fills the branch_rev_begin field.

The UPDATE trigger create a new record and fills the branch_rev_begin and branch_parent fields. It then marks the parent record as deleted, and fills the branch_rev_end and branch_child fields.

Updating the working copy

Changes can be made to the database while editing the working copy. In order to reconcile those edition, the user needs to update the working copy.

When updating, a set of records can be in conflicts: the records for which the end revision has been set since the initial checkout or last update if any.

Multiple editions can be made to the same record. Therefore the child relation must be followed to the last child in order to present tu user with the latest state of a given conflicting feature.

Conflicts are stored in a table and identified with a conflict id and the tag ‘theirs’ or ‘mine’. A DELETE trigger on this table is used for conflict resolution. On deletion of ‘mine’, the working copy edition is discarded, on deletion of ‘theirs’ the working copy edition is appended to the feature history (i.e. the working copy feature becomes a child of the last state of the feature in the historized database).

Committing the editions to the versionned database

If a working copy is up to date, the editions can be integrated in the versioned database. This operation consists simply in the insertion of a record in the revisions table, and, for each versioned table, the update of rows that are different and inserting rows that are not present.

Branching

A branch can be created from any revision by adding the four history columns and setting the branch_rev_begin field of features that are present in their revision.

Plugin interface tutorial

Groups are used for all versioning operations in QGIS since the versions are for a complete PostGIS schema or SpatiaLite database.

The versioning toolbar will change depending on the group selected in the QGIS legend.

Note:
The group elements must share the same connection information (i.e. share the same database and schema for PostGIS working copies and revision views or share same SpatiaLite database for SpatiaLite working copies).

Versioning a PostGIS schema

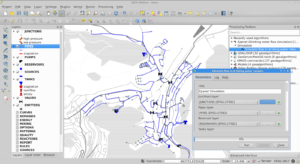
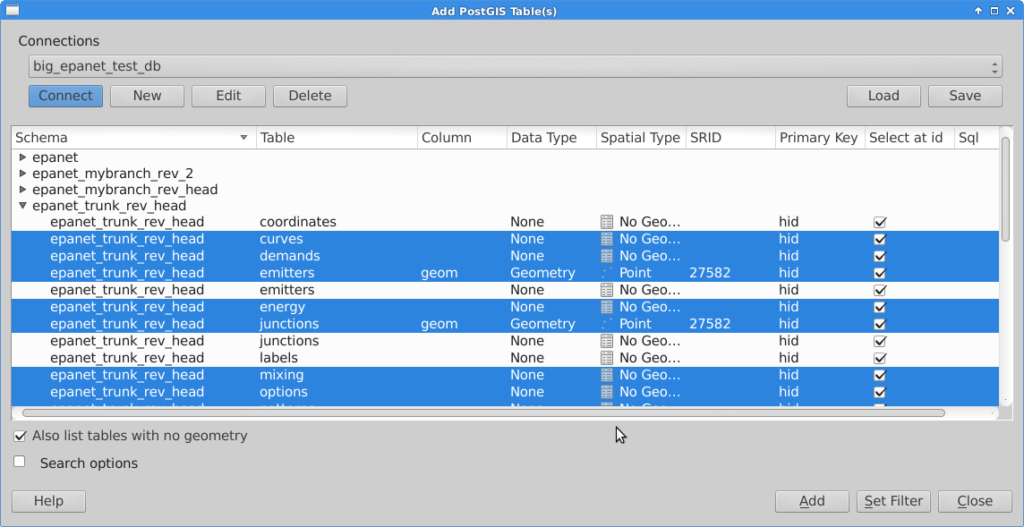
Starting with an unversioned database, import a number of layers from a schema that needs to be versioned into a QGIS project.

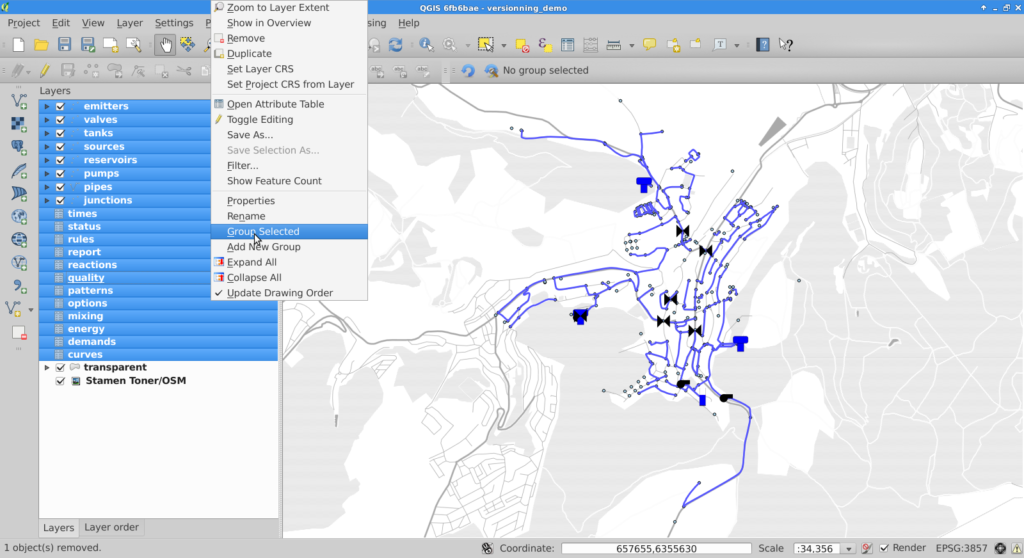
Once the layers are imported, they must be grouped together.

Selecting the newly created group will cause the versioning toolbar to display the historize button (green V). On click a confirmation is requested to version the database schema.

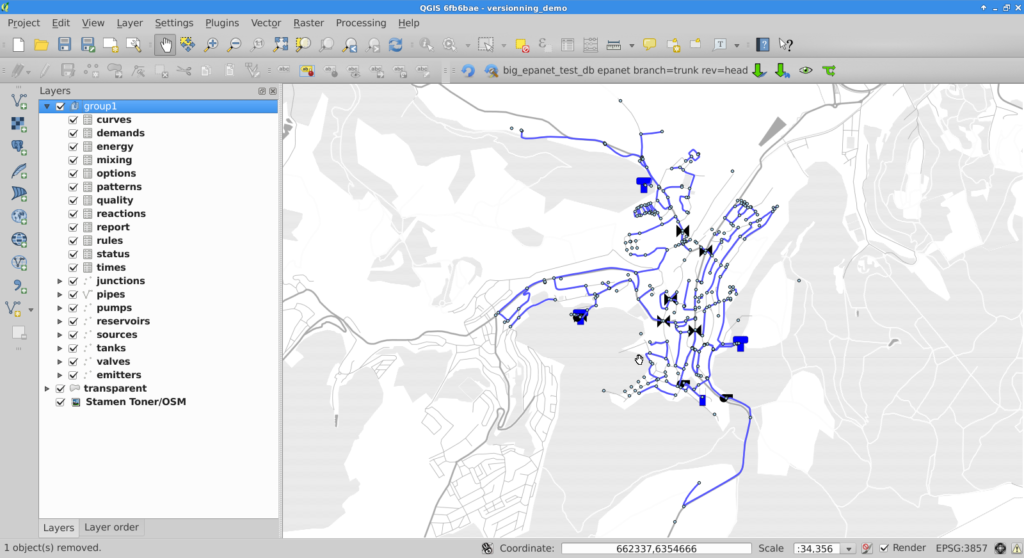
The versioned layers are imported in a new group and the original layers are removed from the project.

Note:
The symobology is not kept in the process.

Working with a versioned PostGIS schema

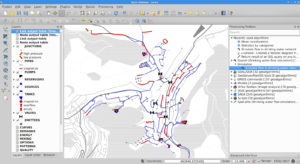
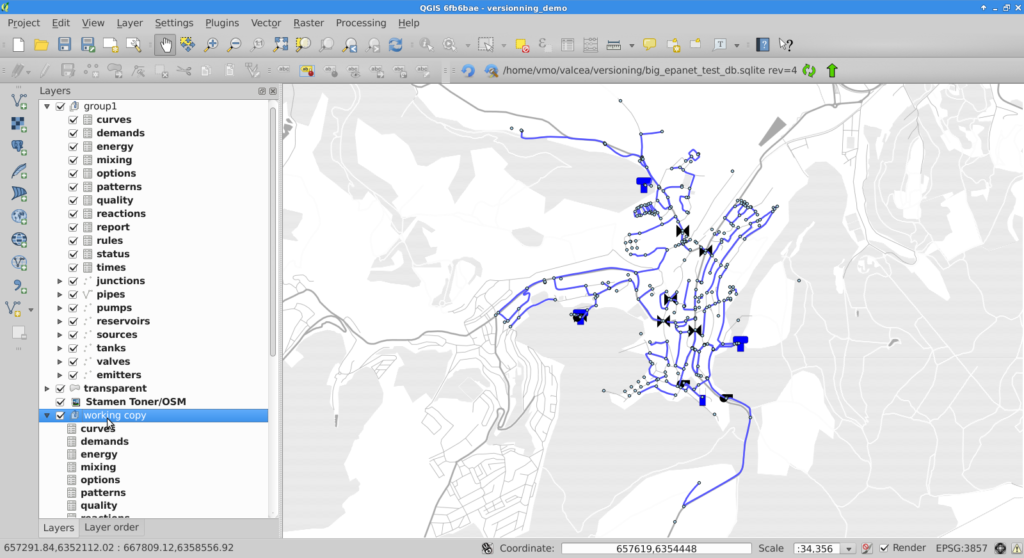
Versioned layers can be imported in QGIS. The layers must be from a head revision or a view on any revision.


Once the layers are in QGIS, they must be grouped.


For PostGIS groups at head revision, the versioning plugin allows the user to create a SpatiaLite or a PostGIS working copy, create a view on a given revision or create a branch. A corresponding group will be imported in QGIS.

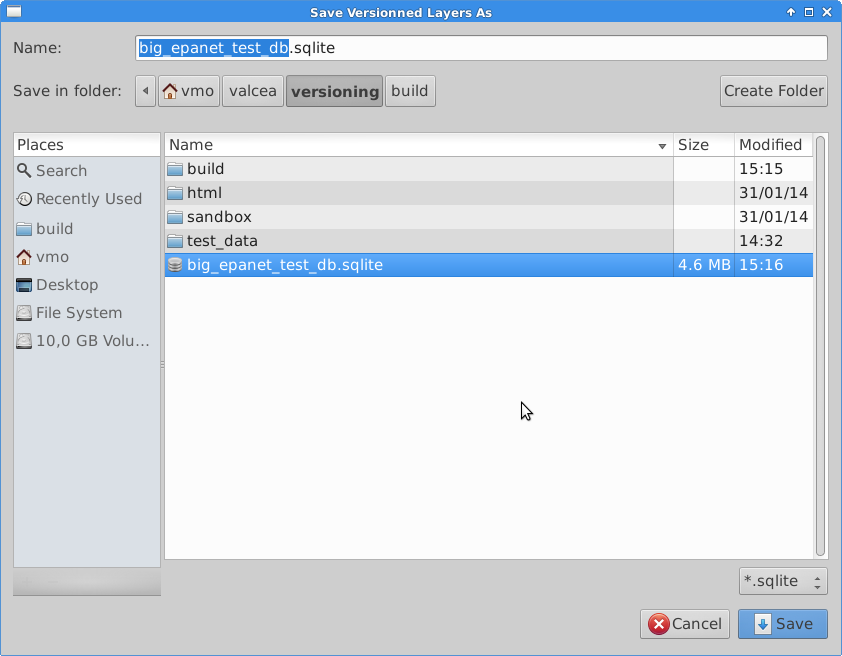
If the user chooses to create a SpatiaLite working copy, he will be asked to select a file to store the working copy.


Commiting changes

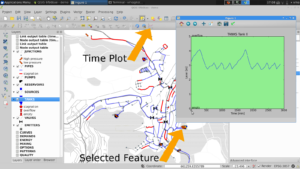
Once the working copy is imported in QGIS, the user can start edition of its layers. With SpatiaLite working copies, this edition can be done off-line.

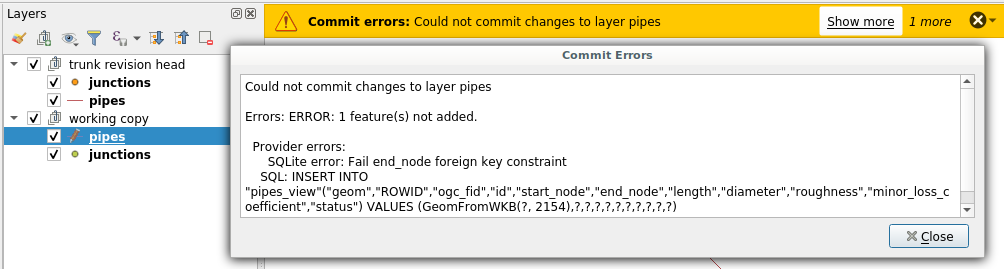
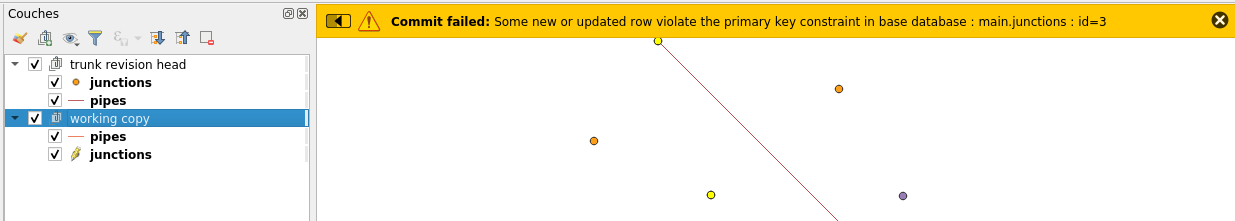
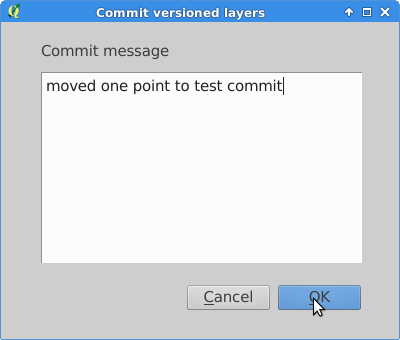
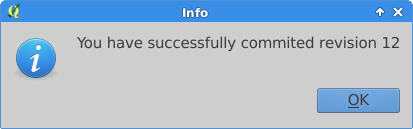
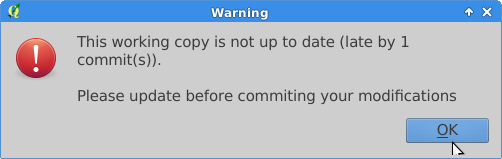
When the user is done with edition, he can commit the changes to the database and if commit is feasible (i.e. the working copy is up to date with the versioned database), he will be prompted for a commit message and subsequently be informed of the revision number he committed.


If the commit is not feasible, the user will be informed that he must update his working copy prior to commit.

Resolving conflicts

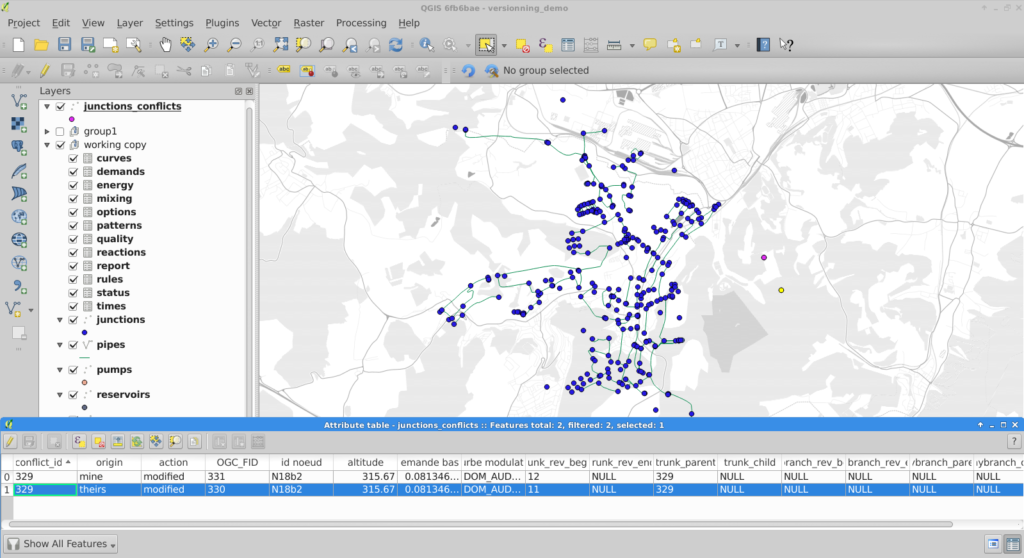
Conflicts are detected during update, the user is informed, and conflicts layers are imported into QGIS.

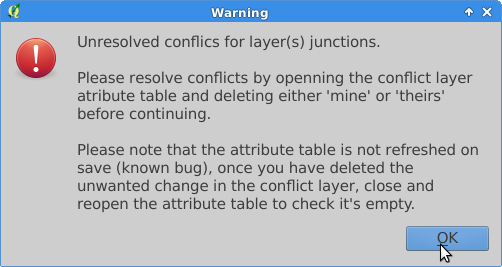
To resolve conflicts, the user can open the conflict layer’s attribute table. Selected entries are also selected on the map canvas and the user can decide which version, either his or the database’s, he wants to keep. User version is tagged with ‘mine’ and database version with ‘theirs’. The conflict is resolved by deleting the unwanted entry in the conflict layer.

Note:
On deletion of one conflict entry, both entries are removed (by a trigger) but the attribute table (and canvas) are not refreshed. As a workaround, the user can close and re-open the attribute table to see the actual state of the conflict table.

Once the conflict table is empty, the commit can be done.

Restrictions

Due to design choices and tools used for conversion to SpatiaLite, a number of restrictions apply to the versioned database:

  • |schemas, tables and branch names should not have space, caps or quotes
  • tables must have primary keys
  • columns are lowercase (because of conversion to SpatiaLite) but can have spaces (not that it’s recommended
  • geometry column is geom in PostGIS, GEOMETRY in SpatiaLite

Note
Do not edit OGC_FID or ROWID

Note
The constrains on the tables are be lost in the PostGIS to SpatiaLite conversion.

Known bug

The conflict layer won’t be loaded automatically is it has no geometry. The user will have to load it manually.

Masking features in QGIS 2.4

Have you ever wondered how to mask features on a map, so that only a particular zone is highlighted ? There have been a simple plugin to do that for a while. Called ‘Mask’, it allowed to turn a vector selection into a new memory layer with only one geometry made by the geometric inversion of the selection: the polygons that were selected get transformed into holes of a squared polygon bigger than the current extent.

One could then use this new layer, like any other one and apply a vector symbology on it. An opaque color to mask everything but the selection, or some semi-transparent color in order to only highlight the selection. It was very useful but came with some limitations, and especially the fact that no update of the ‘mask’ layer was done during an atlas printing.

Thanks to the support of Agence de l’Eau Adour Garonne, Oslandia has been developing some evolutions to the core of QGIS, as well as to the mask plugin.

The core part consists of a new feature renderer that can be used on any polygon vector layer, as a symbology element. It is called inverted polygon renderer and allows to apply any other renderer to polygons that have been inverted.
It was designed originally to allow only simple filling mode to be applied to the exterior ring of polygons, but it now allows to use more complex renderers like graduated, categorized or even rule-based renderers.

Inverted polygons: Simple usage

The simplest usage is to select the default sub renderer that is set to “single symbol” in order to have a uniform exterior fill of a layer.

Advanced usage

When the sub-renderer used by the inverted polygon renderer has different symbol categories, features are grouped by symbol category before being inverted and rendered. It then only makes sense when the symbology used is partly transparent, so that the different inverted polygons can be distinguished from each other.
This can be used for example to render a semi-transparent shapeburst fill around the current atlas feature.

In this example, we have an inverted polygon renderer with a rule-based sub renderer. The rule will only select the current atlas geometry, thanks to the expression $id=$atlasfeatureid.
The symbol used is made of two symbol layers: a semi-transparent blue simple fill and a shapeburst fill on top of it.
The polygon layer is then duplicated to also have a green “interior fill” for each polygon.
The output can be seen hereafter:

Label masking

When the map has labels enabled, this inverted polygon renderer is not sufficient to mask labels as well. When a user wants to highlight a particular zone on a map, she usually also wants to mask labels that are around, or at least make them less visible. The way QGIS handles labels out of the box is not directly compatible with this need. QGIS always displays labels on top of every other layers.

To circumvent this, the original ‘mask’ plugin has been enhanced in order to be aware of layers with labels. A new ‘mask’ layer can be computed and its geometry can be used to test whether a feature has to be labeled or not. The plugin exposes two special variables that are available for any expressions :

  • in_mask(srid) will return a boolean that tests if the current feature is in the mask. The parameter srid is the SRID projection code of the layer where this function is used.
  • $mask_geometry will return the current mask geometry

Different spatial predicates can be used to test if the current feature lies inside the highlighted zone. A different type of predicate will be used for polygon layers, line layers and point layers.

Suppose we have a map of some french départements with a background raster map, and some linear layer displaying rivers.

If we want to highlight only one département, we can use the mask plugin for that. We will first select it and call the plugin.

A fancy inverted polygon symbology, based on a shapeburst fill is created. We see here that we can choose the function that will be used for filtering the labeling. By default these functions are “pointOnSurface” for polygon layers and “intersects” for line layers.Here, we want both the départements layer and the rivers layers to see their labeling rules modified in order to hide the labels outside of the defined mask polygon.

By modifying the mask symbology, adding a little bit of transparency, we obtain the following result :

The plugin is able to interact with the atlas printing and will update its mask geometry as well as the labels that are allowed to be displayed.

The mask layer can also be saved with the project, using a memory layer if you use the Memory Layer Saver plugin, or using an OGR vector file format.

Here is a short video that shows how the plugin can be setup for a simple mask with an atlas print.

How to get the plugin ?

The new mask plugin is available in its 1.0 version on the QGIS official repository of plugins. It requires QGIS 2.4. We are currently investigating the addition of this label masking feature to the QGIS core. The idea would be to have a concept of “label layer” that could then be hidden by others, or even made partly transparent.

It is not an easy task, though, since it would require to rework parts of the labeling and rendering engine.
If you are interested by such a feature, please let us know !

QGIS plugin for water management

Oslandia releases today a new plugin for the QGIS processing framework, allowing for water distribution network simulation. It integrates the opensource EPANET simulation software. EPANET models water distribution networks. It’s a widely used public-domain simulation software developed by the US Environmental Protection Agency.

Hydraulic simulation is used to understand water distribution in distribution network, to forecast the impact of network alterations, to dimension network elements or study extreme case scenarios (e.g. important demand for firefighting, pipes breakages, interruption in supply).

QGIS provides a graphical user interface that can be used to import/edit/export hydraulic model elements and simulation parameters from various sources, launch simulation and visualize results directly inside QGIS.

Hydraulic model

A hydraulic model consists of junctions (POINT) and pipes (LINESTRING) along with various other elements like tanks, pumps and valves. Those elements can be stored as features in a spatially enabled database. Features attributes can be simple (e.g. pipe diameter) or complex (e.g. pumps characteristic curves or water consumption). Complex attributes are stored via a foreign key in other alphanumeric tables.

This is the kind of data QGIS is designed to handle. It can import/export them from/to a variety of sources and also display and edit them.

Simulation parameters

Simulation parameters and options (e.g. simulation time step or accuracy) are key-value pairs. The values can be stored in a table which columns are keys. Each set of simulation parameters is then a record in this table. This kind of table can be loaded in QGIS as a vector layer without geometry.

Integration in the processing framework

Once the hydraulic model and simulation parameters are loaded in QGIS, the simulation can be launched through the Processing toolbox. The plugin uses the standalone command line interface of EPANET (CLI) which path needs to be specified in processing Options and configuration.

The plugin assembles an EPANET input file, runs EPANET and parses its output to generate result layers.

One interesting aspect with processing modules is that they can be used for chained processing: the user can use other modules to do additional transformations of simulation results, as feeding them into another simulation model.

Result visualization

Simulation results are water pressure and velocity at all points in the network along with state of network elements (e.g. volume in tanks, power of pumps) for all simulation time steps . This represent a huge amount of data that are usually displayed either as time-plots or as map-plots of time aggregated data (e.g. max and min during simulation).

Results of particular interest are:

  • time-plots of:
    • volume in reservoirs
    • flow at pumps
    • pressure in pipes and at junctions
  • map-plots of:
    • low speed (stagnation)
    • high and low pressure (risk of breakage, unhappy consumer)
    • lack of level variation in reservoirs (stagnation)
    • empty reservoir
    • reservoir overflow
    • abnormal pressure (typical of error in the altitude of a node in the model)
    • flow direction

QGIS is naturally suited for map-plots. Time-aggregated simulation results are automatically joined to map layers when the result table is added to the map. Rule-based symbology is used to highlight zones of concern (e.g. low water velocity or empty reservoirs).

The matplotlib library provides 2D plotting facilities in python and QGIS provides an extensive set of selection tools (on the map or in tables). The plugin’s button plots the appropriate value depending on the selected feature type (e.g. water level for tanks, pressure for junctions).

Screencast

For a full demo of this plugin, see the following video :


Where and who

The plugin is available on GitHub and should be available soon on QGIS plugin repository : https://github.com/Oslandia/qgis-epanet

This work has been funded by European Funds. Many thanks to the GIS Office of Apavil, Valcea County (Romania). Oslandia has developped this plugin, and provides support and development around QGIS, PostGIS and this plugin. Get in touch if you need more : [email protected]

We are looking for a free dataset with full informations (pumps, tanks, valves, pipes and their characteristics…) to distribute with this plugin as a test case and demonstration. If you can provide this, mail us !

We also are implementing a Processing plugin for SWMM, the public domain Waste-water simulation tool. If you are interested to participate to the development, please contact us.

QGIS 2.4 release out, Oslandia inside

There is a new QGIS release out : version 2.4, codename Chugiak is now available. Binary packages for your platform have been generated, and you can directly download and try out this new release  of the famous Desktop GIS software. QGIS 2.4 has a lot of new features in all of its components. There is a visual changelog available where you can discover QGIS improvements.

Oslandia inside

Oslandia is a **QGIS core contributor**, and we have been busy improving QGIS 2.4. We contributed to various of these new features. Here are a few enhancements we developped.

Predefined scales mode for atlas maps

When working with atlas map items, you can now specify a predefined scale mode for the map. It will use the best fitting option from the list of predefined scales in you your project properties settings (see Project -> Project Properties -> General -> Project Scales to configure these predefined scales).

This feature has been funded by `the city of Uster

New Inverted Polygon renderer

The biggest feature Oslandia developped is the inverted Polygon renderer. This feature has been funded by Agence de l’Eau Adour-Garonne and mainly developped by Hugo Mercier.

A new renderer has been added for polygon features, allowing you to style everything outside your polygons. This can be useful for highlighting areas, or for creating cartographic masks. When used with new shapeburst style, you can now produce output as shown in the image for this entry.

New Mask Plugin

Alongside with the inverted polygon renderer feature, Oslandia developped a new Mask plugin. It enables you to make atlases focusing on the specific feature you are interested in, occulting the rest with a really nice effect. Furthermore, it helps masking the labels when you mask geometry objects.

This plugin has also be funded by Agence de l’Eau Adour Garonne.

Layered SVG export


Another feature implemented in this version is the ability to export layered SVG files. Beforehand, all features were exported as a single layer, whatever the QGIS layer was. Now you can use Inkscape or Illustrator and their layering capabilities to finish the design of your map with greater ease of use. There also is an option to vectorize labels.

This feature has been funded by Agence de Développement du Grand Amiénois (ADUGA).

WAsP format support

The WAsP format is the standard format for roughness and elevation in the wind science field. This format was not supported by QGIS until recently, when Vincent Mora added WAsP to QGIS supported GIS file formats. In fact, we did better as we implemented WAsP support in GDAL/OGR, so that any software using this library is now able to read and write WASP files. WAsP is available starting from GDAL/OGR >= 1.11.0.

This was an opportunity to add Vincent Mora as an official GDAL/OGR commiter, in charge of maintaining this driver. This feature will enable wind management operations to be completed on QGIS with a better user experience. No more file conversion before working on the GIS side.  We also developped a companion plugin to manage data simplification when needed. It is available in QGIS plugins repository.

With this work, QGIS becomes a great complement to opensource computational wind engineering softwares like ZephyTools.

This work has been funded by La Compagnie du Vent

Epanet Plugin

Oslandia has integrated the EPANET water distribution model inside QGIS Processing, as a plugin. Epanet integration has been funded by European funds and the GIS office of Apavil, Romania.

Vizitown Plugin

Vizitown is part of our efforts on 3D GIS development, alongside PostGIS 3D and more. It is a QGIS plugin allowing users to display QGIS layers in 3D in a Three.js / WebGL environment, in a browser. It can leverage PostGIS 3D, and display live data from the database, as well as other sources of data. It can display DEM, a raster background, 2D vector data draped on the DEM, 2.5D data (e.g. buildings), or real 3D Meshes. The user can set a symbology in QGIS and see the modifications live in the browser in 3D.

You can see Vizitown in action on Youtube. Vizitown has been developped with IG3 students from ESIPE

Multiple bugfixes

Oslandia also work continuously on improving QGIS quality, and we try to fix as many bugs as we can. These bugfixes are funded by our `QGIS support offer clients, and also by the french Ministère de l’environnement and Agence de l’Eau Adour-Garonne.

What next ?

We continue to work on new QGIS features, corrections, refactoring and integration with other tools. We namely studied a possible unification of all database-like features in QGIS, using SQLITE/Spatialite features. We intend to work on Native Read+Write support of Mapinfo TAB files.

We offer a wide range of services around QGIS, be it for training, assistance, development, or consulting in general.

We also propose `various support opportunities for QGIS. This is the best way for you to improve the quality of this software, contribute to its development, and ensure that you can work in good conditions without having to worry about potential bugs. Our team of experienced engineers, who contribute to QGIS core, will be available in any case of critical bug.

We can offer you personalized support, with specific conditions and fares. Do not hesitate to contact us at [email protected] .

PostGIS 3D &#8211; Foss4g video and workshop

The latest PostGIS and QGIS 3D enhancements presented at FOSS4G by Oslandia are available online.We suggest you to have a look on our PostGIS 3D / QGIS 3D video demonstration using SFCGAL library and the QGIS Horao plugin.

A step by step workshop, (really close to the video workflow) is also available online  https://github.com/Oslandia/Workshops/tree/master/FOSS4G_2013_PostGIS_3D

We can provide you the full virtual machine on demand, with proper software environment (6GB Virtual Box Image).

We would be really interested in having your advice on these new 3D features, and the use cases you could be interested in. Do not hesitate to get in touch.

Contact us at [email protected] for any information.

QGIS Community meeting in Brighton

Developers and contributors from the QGIS project are used to gather physically twice a year across different countries. Such an event allows people to synchronize their effort, and discuss new possible developments.cThe latest QGIS community meeting took place in Brighton from the 12th to the 16th of September, just before the FOSS4G event. It was the biggest community meeting organized so far, with close to 50 people attending ! Everything went smooth thanks to the perfect organization by Lutra Consulting.

This session was of particular interest in the project’s history, since it was dedicated to the release of the eagerly-awaited new 2.0 version of QGIS.

Oslandia is used to take part in the event and even organized the march 2012 session in Lyon.


Presentations

Despite being originally oriented toward code and translations, some presentations took place during the event. Some of them have been video recorded, some did not. Hereafter is a subset of them.

A new website

In parallel to the release of the 2.0 version, the QGIS website has been updated. Its look and feel, but also the way it is now build. Richard Duivenvoorde presented the efforts that have been put on the support of multiple languages, adaptation to mobile devices, and the reuse of tools used for building the documentation of the project. The new website is now online.

Richard presenting the new website


Presentation of the new website : http://www.ustream.tv/recorded/38687971

Constraints on attributes

Some more developer-oriented presentations and discussions also took place. Matthias Kuhn and Nathan Woodrow presented an idea about extending the way attributes are handled by QGIS. In particular, the concept of constrained attributes emerged. The idea is to be able to express, manipulate and edit contrains on attributes (possible range of values for instance) as it is found in databases. This could then be used to constrain user editing of layers, presenting to the user an appropriate widget (combo box for an enumeration for instance), especially for layers that do not have native support for these constraints.

QGIS for Android tablets

RealworldSystems presented their work on what they called the “QGIS Mobility framework”, based on previous works by Marco Bernasocchi on QGIS for Android. It is dedicated to the design of custom QGIS applications for deployment on Android tablets (for on-the-field editing campains for instance). It looks promising and has already been used in a real-world application for gaz pipeline inspection. The framework can be found on github.

QGIS webserver

Andreas Neumann presented evolutions of QGIS webserver and webclient. More can be found in the corresponding video.

Andreas presenting the work on QGIS webserver and webclient

Video 1 http://www.ustream.tv/recorded/38741015

Evolution of the Globe plugin

Matthias Kuhn presented evolutions he made to the Globe plugin that allows to display a 3D earth with different kinds of data on it. Lots of osgearth features are now integrated into the Globe plugin (in particular the support for 2D vector layers).

Matthias presenting its work on the Globe plugin

Video 2 http://www.ustream.tv/recorded/38737991

Visualisation of 3D data

Oslandia presented also its ongoing work on the integration of Postgis 3D. After a thourought evaluation of osgearth, which is the base of the Globe plugin, we decided to develop our own 3D visualisation stack directly on top of OpenSceneGraph.

A QGIS plugin has also been developed in order to be able to view QGIS layers in 3D.

With this new 3D visualisation stack we are able to display and manipulate data of a whole city between 20 and 60 frames per second on a laptop (here the demo has been designed on data from the city of Lyon) , when we were hardly able to display a small city quarter with Globe.

Oslandia presenting its work on its 3D visualisation stack

Video 3 http://www.ustream.tv/recorded/38738897

Slides https://github.com/Oslandia/presentations/tree/master/qgis_hf_2013

QGIS 2.0

All the work done during this community meeting allowed to polish the 2.0 version of QGIS which has been publicly announced during the FOSS4G in Nottingham by Tim Sutton.
Waiting now for the 2.1 release 🙂

ArcGIS REST API Connector Plugin for QGIS

ArcGIS REST Connector Plugin

Last year we described a command line method that adds ESRI REST layers in QGIS. Well, a team at the Geometa Lab in the University of Applied Sciences Rapperswil (HSR) Switzerland, have released a plugin for QGIS that adds ESRI REST layers via a GUI (Github page). The plugin is experimental so you will need to tick the box “Show also experimental plugins” in the settings panel of the “Plugins – Manage and Install Plugins” dialogue in order to add the plugin to QGIS. The following URLs lists numerous REST layers in the plugin’s GUI:

http://services.arcgisonline.com/arcgis/rest/services

http://basemap.nationalmap.gov/arcgis/rest/services

http://services.nationalmap.gov/arcgis/rest/services

Reference:

REST API Connector Plug-in Wiki Page

The 10th annual FOSS4G conference

The 10th annual FOSS4G conference was held from 8th-13th September in Portland, Oregon, USA. FOSS4G is the world’s premier global gathering of developers, users and key decision-makers involved in open source geospatial software. With over 180 talks presented covering topics from 3D printing maps with Grass GIS 7 to QGIS Map Server and beyond, FOSS4G 2014 was a resounding success. Don’t be disappointed if you could not attend, all the talks given at FOSS4G 2014 are now viewable on Vimeo, including 8 one hour invited presentations from staff at Amazon, MapZen, Boundless, Mapbox etc. These talks are well worth watching if you want to keep up to date with the latest developments in open source geospatial software.

FOSS4G 2014 General Sessions – Talks and Invited Presentations

Oceancolor Data Downloader v1.0 for QGIS

Aqua Modis SST 2015-01-13

Sea Surface Temperature data downloaded by Oceancolor Data Downloader.

The Oceancolor Data Downloader is a new plugin for QGIS from the Mapping and Geographic Information Centre of the British Antarctic Survey that downloads Oceancolor and Sea Surface Temperature data from NASA’s Oceancolor website. The plugin currently downloads three datasets:

  • MODIS AQUA chlorophyll concentration
  • SeaWiFS chlorophyll concentration
  • MODIS AQUA night time Sea Surface Temperatures

The data accessed includes daily, 8 day, monthly and yearly composites, all of which can be saved to disk while downloading. Future plans for the plugin include additional access to other datasets such as ocean Net Primary Production, selection by bounding box, the ability to save in other formats, a progress bar etc.

I used the plugin to download global Sea Surface Temperatures for the 13th Jan 2015. I then used shapefiles from Natural Earth to create a simple basemap. I finally chose the IBCAO Polar Stereographic projection (EPSG: 3996) to create a map centred on the North Pole.

If you use the plugin to produce published research, please cite:

10.5281/zenodo.15018

  • Page 1 of 6 ( 111 posts )
  • >>
  • news

Back to Top

Sustaining Members