QGIS Community meeting in Brighton
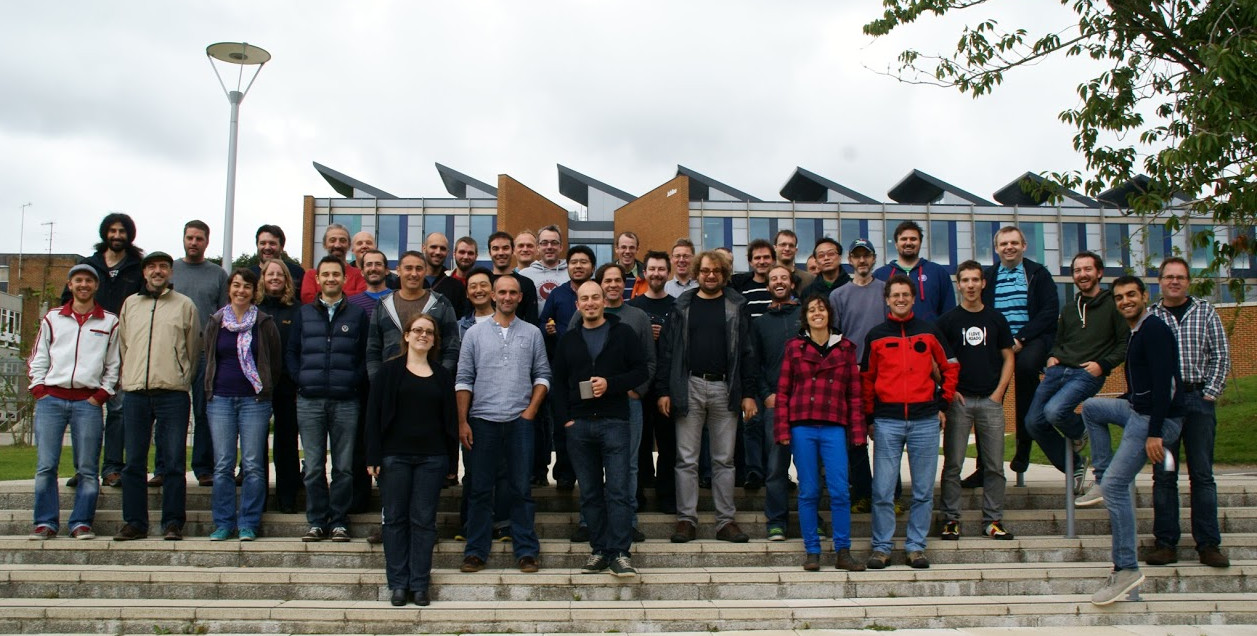
Developers and contributors from the QGIS project are used to gather physically twice a year across different countries. Such an event allows people to synchronize their effort, and discuss new possible developments.cThe latest QGIS community meeting took place in Brighton from the 12th to the 16th of September, just before the FOSS4G event. It was the biggest community meeting organized so far, with close to 50 people attending ! Everything went smooth thanks to the perfect organization by Lutra Consulting.
This session was of particular interest in the project’s history, since it was dedicated to the release of the eagerly-awaited new 2.0 version of QGIS.
Oslandia is used to take part in the event and even organized the march 2012 session in Lyon.
Presentations
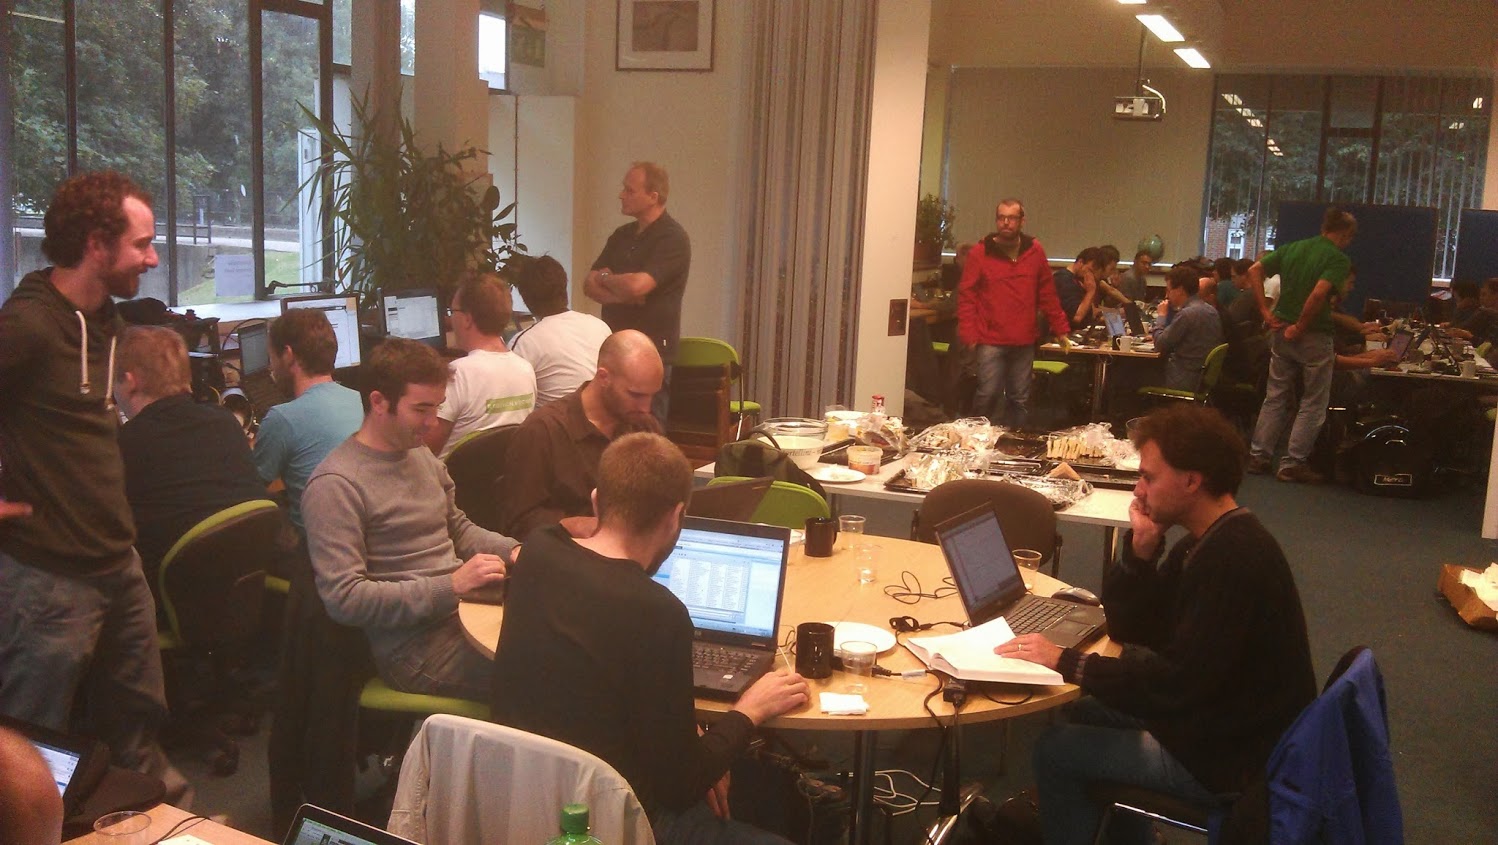
Despite being originally oriented toward code and translations, some presentations took place during the event. Some of them have been video recorded, some did not. Hereafter is a subset of them.
A new website
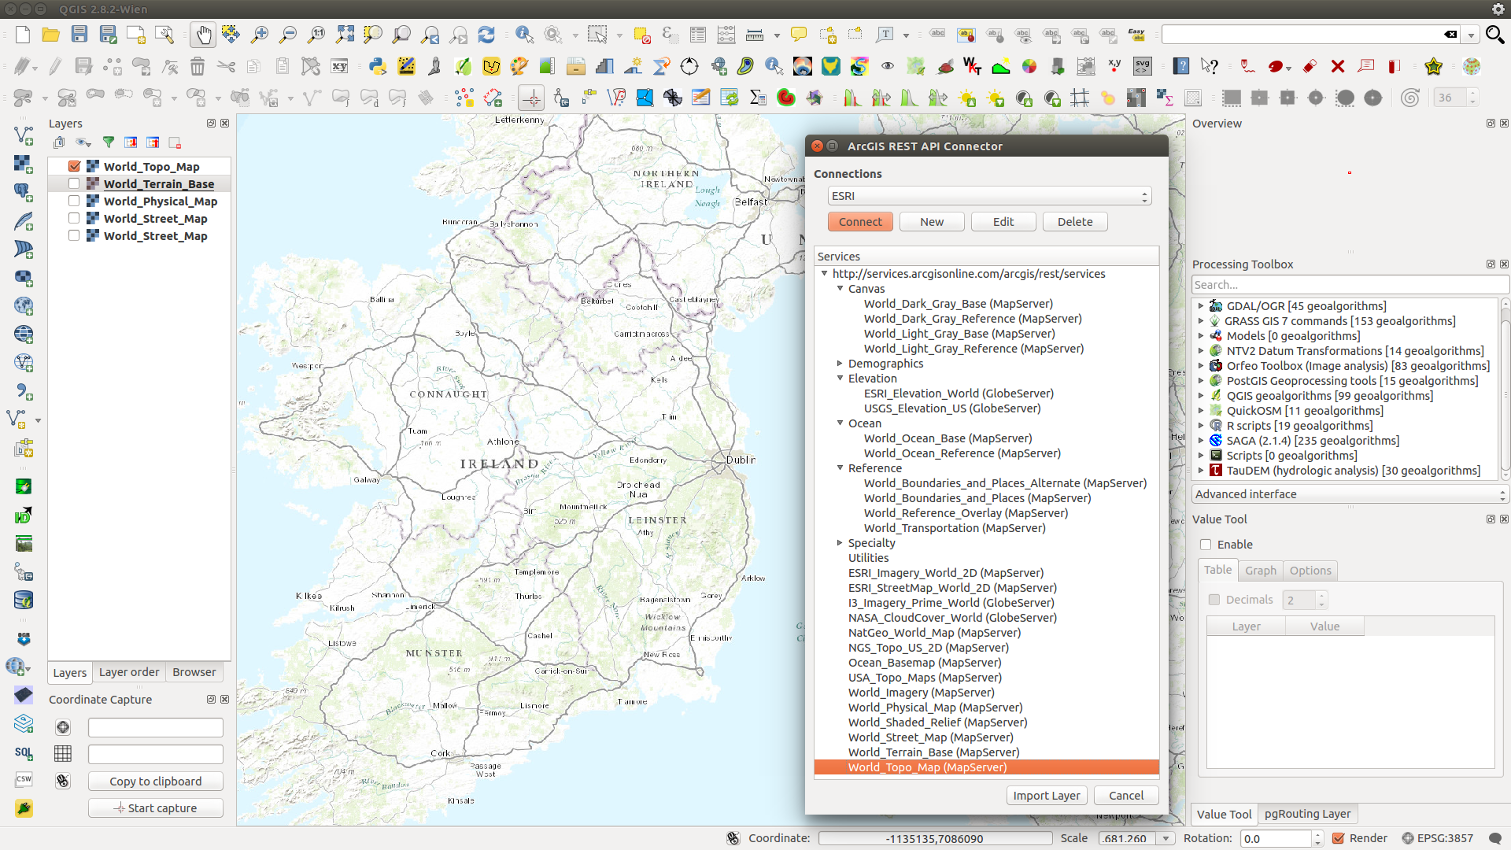
In parallel to the release of the 2.0 version, the QGIS website has been updated. Its look and feel, but also the way it is now build. Richard Duivenvoorde presented the efforts that have been put on the support of multiple languages, adaptation to mobile devices, and the reuse of tools used for building the documentation of the project. The new website is now online.
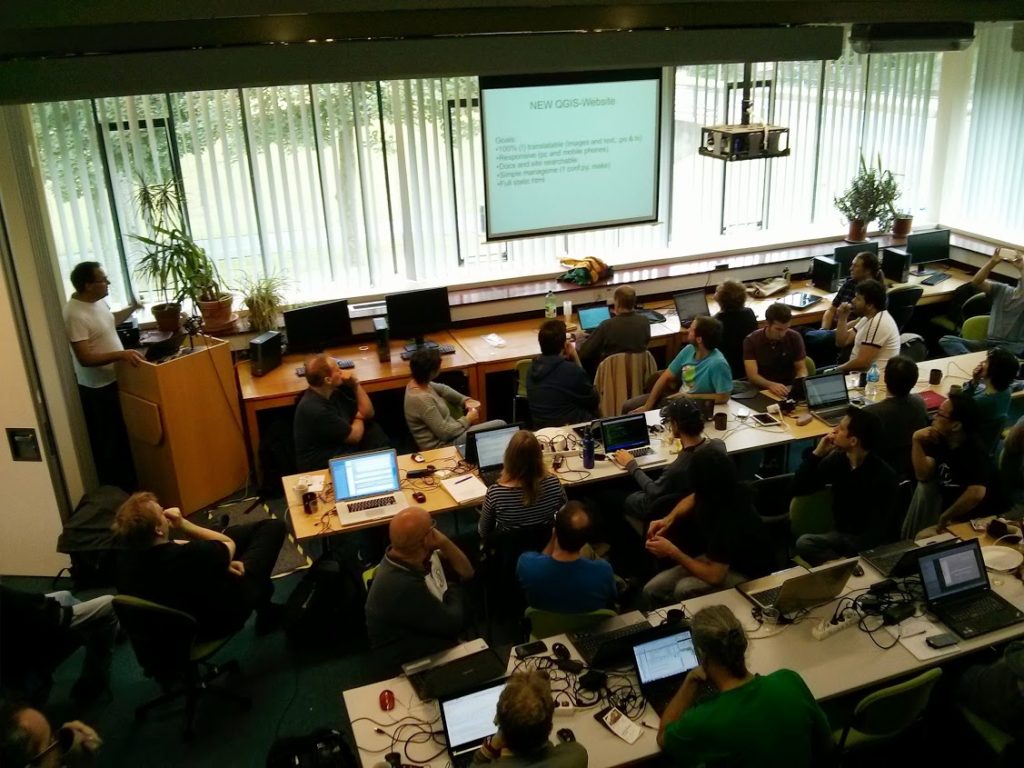
Richard presenting the new website
Presentation of the new website : http://www.ustream.tv/recorded/38687971
Constraints on attributes
Some more developer-oriented presentations and discussions also took place. Matthias Kuhn and Nathan Woodrow presented an idea about extending the way attributes are handled by QGIS. In particular, the concept of constrained attributes emerged. The idea is to be able to express, manipulate and edit contrains on attributes (possible range of values for instance) as it is found in databases. This could then be used to constrain user editing of layers, presenting to the user an appropriate widget (combo box for an enumeration for instance), especially for layers that do not have native support for these constraints.
QGIS for Android tablets
RealworldSystems presented their work on what they called the “QGIS Mobility framework”, based on previous works by Marco Bernasocchi on QGIS for Android. It is dedicated to the design of custom QGIS applications for deployment on Android tablets (for on-the-field editing campains for instance). It looks promising and has already been used in a real-world application for gaz pipeline inspection. The framework can be found on github.
QGIS webserver
Andreas Neumann presented evolutions of QGIS webserver and webclient. More can be found in the corresponding video.
Andreas presenting the work on QGIS webserver and webclient
Video 1 http://www.ustream.tv/recorded/38741015
Evolution of the Globe plugin
Matthias Kuhn presented evolutions he made to the Globe plugin that allows to display a 3D earth with different kinds of data on it. Lots of osgearth features are now integrated into the Globe plugin (in particular the support for 2D vector layers).
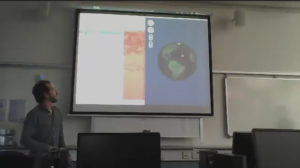
Matthias presenting its work on the Globe plugin
Video 2 http://www.ustream.tv/recorded/38737991
Visualisation of 3D data
Oslandia presented also its ongoing work on the integration of Postgis 3D. After a thourought evaluation of osgearth, which is the base of the Globe plugin, we decided to develop our own 3D visualisation stack directly on top of OpenSceneGraph.
A QGIS plugin has also been developed in order to be able to view QGIS layers in 3D.
With this new 3D visualisation stack we are able to display and manipulate data of a whole city between 20 and 60 frames per second on a laptop (here the demo has been designed on data from the city of Lyon) , when we were hardly able to display a small city quarter with Globe.
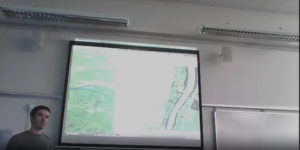
Oslandia presenting its work on its 3D visualisation stack
Video 3 http://www.ustream.tv/recorded/38738897
Slides https://github.com/Oslandia/presentations/tree/master/qgis_hf_2013
QGIS 2.0
All the work done during this community meeting allowed to polish the 2.0 version of QGIS which has been publicly announced during the FOSS4G in Nottingham by Tim Sutton.
Waiting now for the 2.1 release