Related Plugins and Tags

QGIS Planet

WCS QGIS and PDOK

Rant? This WCS investigation started off because my PDOKServicesPlugin was not working for the PDOK WCS services anymore. I wanted to see all fired network requests, so am creating a future plugin for that: https://github.com/rduivenvoorde/qgisnetworklogger. But I hit all kind of issues when trying out the service(s). This is some write up of my findings … Continue reading WCS QGIS and PDOK

Visualization of borehole logs with QGIS

At Oslandia, we have been working on a component based on the QGIS API for the visualization of well and borehole logs.

This component is aiming at displaying data collected vertically along wells dug underground. It mainly focuses on data organized in series of contiguous samples, and is generic enough to be used for both vertical (where the Y axis corresponds to a depth underground) and horizontal data (where the X axis corresponds to time for example). One of the main concerns was to ensure good display performances with an important volume of sample points (usually hundred of thousands sample points).

We have already been working on plot components in the past, but for specific QGIS plugins (both for timeseries and stratigraphic logs) and thought we will put these past experiences to good use by creating a more generic library.

We decided to represent sample points as geometry features in order to be able to reuse the rich symbology engine of QGIS. This allows users to represent their data whatever they like without having to rewrite an entire symbology engine. We also benefit from all the performance optimizations that have been added and polished over the years (on-the-fly geometry simplification for example).

Albeit written in Python, we achieved good display performances. The key trick was to avoid copy of data between the sample points read by QGIS and the Python graphing component. It is achieved thanks to the fact that the PyQGIS API has some functions that respect the buffer protocol.

You can have a look at the following video to see this component integrated in an existing plugin.

Visualization of borehole logs withing QGIS

It is distributed as usual under an open source license and the code repository can be found on GitHub.

Do not hesitate to contact us ( [email protected] ) if you are interested in any enhancements around this component.

On custom layout checks in QGIS 3.6, and how they can do your work for you!

Recently, we had the opportunity to implement an exciting new feature within QGIS. An enterprise with a large number of QGIS installs was looking for a way to control the outputs which staff were creating from the software, and enforce a set of predefined policies. The policies were designed to ensure that maps created in QGIS’ print layout designer would meet a set of minimum standards, e.g.:

  • Layouts must include a “Copyright 2019 by XXX” label somewhere on the page
  • All maps must have a linked scale bar
  • No layers from certain blacklisted sources (e.g. Google Maps tiles) are permitted
  • Required attribution text for other layers must be included somewhere on the layout

Instead of just making a set of written policies and hoping that staff correctly follow them, it was instead decided that the checks should be performed automatically by QGIS itself. If any of the checks failed (indicating that the map wasn’t complying to the policies), the layout export would be blocked and the user would be advised what they needed to change in their map to make it compliant.

The result of this work is a brand new API for implementing custom “validity checks” within QGIS. Out of the box, QGIS 3.6 ships with two in-built validity checks. These are:

  • A check to warn users when a layout includes a scale bar which isn’t linked to a map
  • A check to warn users if a map overview in a layout isn’t linked to a map (e.g. if the linked map has been deleted)

All QGIS 3.6 users will see a friendly warning if either of these conditions are met, advising them of the potential issue.


The exciting stuff comes in custom, in-house checks. These are written in PyQGIS, so they can be deployed through in-house plugins or startup scripts. Let’s explore some examples to see how these work.

A basic check looks something like this:

from qgis.core import check

@check.register(type=QgsAbstractValidityCheck.TypeLayoutCheck)
def my_layout_check(context, feedback):
  results = ...
  return results

Checks are created using the @check.register decorator. This takes a single argument, the check type. For now, only layout checks are implemented, so this should be set to QgsAbstractValidityCheck.TypeLayoutCheck. The check function is given two arguments, a QgsValidityCheckContext argument, and a feedback argument. We can safely ignore the feedback option for now, but the context argument is important. This context contains information useful for the check to run — in the case of layout checks, the context contains a reference to the layout being checked. The check function should return a list of QgsValidityCheckResult objects, or an empty list if the check was passed successfully with no warnings or errors.

Here’s a more complete example. This one throws a warning whenever a layout map item is set to the web mercator (EPSG:3875) projection:

@check.register(type=QgsAbstractValidityCheck.TypeLayoutCheck)
def layout_map_crs_choice_check(context, feedback):
  layout = context.layout
  results = []
  for i in layout.items():
    if isinstance(i, QgsLayoutItemMap) and i.crs().authid() == 'EPSG:3857':
      res = QgsValidityCheckResult()
      res.type = QgsValidityCheckResult.Warning
      res.title='Map projection is misleading'
      res.detailedDescription='The projection for the map item {} is set to Web Mercator (EPSG:3857) which misrepresents areas and shapes. Consider using an appropriate local projection instead.'.format(i.displayName())
      results.append(res)

  return results

Here, our check loops through all the items in the layout being tested, looking for QgsLayoutItemMap instances. It then checks the CRS for each map, and if that CRS is ‘EPSG:3857’, a warning result is returned. The warning includes a friendly message for users advising them why the check failed.

In this example our check is returning results with a QgsValidityCheckResult.Warning type. Warning results are shown to users, but they don’t prevent users from proceeding and continuing to export their layout.

Checks can also return “critical” results. If any critical results are obtained, then the actual export itself is blocked. The user is still shown the messages generated by the check so that they know how to resolve the issue, but they can’t proceed with the export until they’ve fixed their layout. Here’s an example of a check which returns critical results, preventing layout export if there’s no “Copyright 2019 North Road” labels included on their layout:

@check.register(type=QgsAbstractValidityCheck.TypeLayoutCheck)
def layout_map_crs_choice_check(context, feedback):
  layout = context.layout
  for i in layout.items():
    if isinstance(i, QgsLayoutItemLabel) and 'Copyright 2019 North Road' in i.currentText():
      return

  # did not find copyright text, block layout export
  res = QgsValidityCheckResult()
  res.type = QgsValidityCheckResult.Critical
  res.title = 'Missing copyright label'
  res.detailedDescription = 'Layout has no "Copyright" label. Please add a label containing the text "Copyright 2019 North Road".'
  return [res]

If we try to export a layout with the copyright notice, we now get this error:

Notice how the OK button is disabled, and users are forced to fix the error before they can export their layouts.

Here’s a final example. This one runs through all the layers included within maps in the layout, and if any of them come from a “blacklisted” source, the user is not permitted to proceed with the export:

@check.register(type=QgsAbstractValidityCheck.TypeLayoutCheck)
def layout_map_crs_choice_check(context, feedback):
  layout = context.layout
  for i in layout.items():
    if isinstance(i, QgsLayoutItemMap):
      for l in i.layersToRender():
        # check if layer source is blacklisted
        if 'mt1.google.com' in l.source():
          res = QgsValidityCheckResult()
          res.type = QgsValidityCheckResult.Critical
          res.title = 'Blacklisted layer source'
          res.detailedDescription = 'This layout includes a Google maps layer ("{}"), which is in violation of their Terms of Service.'.format(l.name())
          return [res]

Of course, all checks are run each time — so if a layout fails multiple checks, the user will see a summary of ALL failed checks, and can click on each in turn to see the detailed description of the failure.

So there we go — when QGIS 3.6 is released in late February 2019, you’ll  have access to this API and can start making QGIS automatically enforce your organisation policies for you! The really neat thing is that this doesn’t only apply to large organisations. Even if you’re a one-person shop using QGIS, you could write your own checks to  make QGIS “remind” you when you’ve forgotten to include something in your products. It’d even be possible to hook into one of the available Python spell checking libraries to write a spelling check! With any luck, this should lead to better quality outputs and less back and forth with your clients.

North Road are leading experts in customising the QGIS application for enterprise installs. If you’d like to discuss how you can deploy in-house customisation like this within your organisation, contact us for further details!

GRASS GIS 7.4.4 released: QGIS friendship release

We are pleased to announce the GRASS GIS 7.4.4 release

What’s new in a nutshell

The new update release GRASS GIS 7.4.4 is release with a few bugfixes and the addition of r.mapcalc.simple esp. for QGIS integration. An overview of the new features in the 7.4 release series is available at New Features in GRASS GIS 7.4.

As a stable release series, 7.4.x enjoys long-term support.

Binaries/Installer download:

Source code download:

More details:

See also our detailed announcement:

About GRASS GIS

The Geographic Resources Analysis Support System (https://grass.osgeo.org/), commonly referred to as GRASS GIS, is an Open Source Geographic Information System providing powerful raster, vector and geospatial processing capabilities in a single integrated software suite. GRASS GIS includes tools for spatial modeling, visualization of raster and vector data, management and analysis of geospatial data, and the processing of satellite and aerial imagery. It also provides the capability to produce sophisticated presentation graphics and hardcopy maps. GRASS GIS has been translated into about twenty languages and supports a huge array of data formats. It can be used either as a stand-alone application or as backend for other software packages such as QGIS and R geostatistics. It is distributed freely under the terms of the GNU General Public License (GPL). GRASS GIS is a founding member of the Open Source Geospatial Foundation (OSGeo).

The GRASS Development Team, January 2019

The post GRASS GIS 7.4.4 released: QGIS friendship release appeared first on GFOSS Blog | GRASS GIS and OSGeo News.

PyQGIS101 part 10 published!

PyQGIS 101: Introduction to QGIS Python programming for non-programmers has now reached the part 10 milestone!

Beyond the obligatory Hello world! example, the contents so far include:

If you’ve been thinking about learning Python programming, but never got around to actually start doing it, give PyQGIS101 a try.

I’d like to thank everyone who has already provided feedback to the exercises. Every comment is important to help me understand the pain points of learning Python for QGIS.

I recently read an article – unfortunately I forgot to bookmark it and cannot locate it anymore – that described the problems with learning to program very well: in the beginning, it’s rather slow going, you don’t know the right terminology and therefore don’t know what to google for when you run into issues. But there comes this point, when you finally get it, when the terminology becomes clearer, when you start thinking “that might work” and it actually does! I hope that PyQGIS101 will be a help along the way.

QGIS and Call Before You Dig

Just released a new version of the KLIC viewer plugin for QGIS. This was neccesary because the format of the information received has changed a lot! Before it only included the information on pipelines in raster format. Now the information on pipelines delivered in XML can include information in vector format . The KLIC viewer … Continue reading QGIS and Call Before You Dig

New QGIS geometry editing tool: trim/extend

Oslandia is continuing to improve QGIS to offer the draftsman the same experience as with the computer-aided design (CAD) software on the market.
Today we introduce you to the “trim/extend” tool.

As its name suggests, this tool, well known to CAD draftsmen, allows you to trim / shorten or extend segments.

However, where CAD tools impose some limitations – such as using on the end of polyline segments and only on 2D objects – we wanted to go further in QGIS:
– you can modify any segment of a line or polygon geometry and not just its end;
– you can of course modify multi geometries;
– you can hang on to 3D points.

Click to view our demo video.

The tool will be available in version 3.6, but you can use it now in the development version, via the advanced Windows installer for example

This tool was developed thanks to the funding of the Megève Town Hall, which we would like to thank in particular.

It is still possible to improve the tool by offering:

– multiple selection of limits and entities to be modified;
– an option to modify the two selected entities up to their intersection point;
– better support for curved geometries in the future;
– to add topology support when using the tool.

Would you like to participate in its improvement or the development of QGIS?

Need a study or support to move from CAD to GIS?

Do not hesitate to contact us.

Follow us also on twitter or Linkedin to be informed about our new CAD tools in QGIS.

Movement data in GIS #17: spatial analysis of GeoPandas trajectories

In Movement data in GIS #16, I presented a new way to deal with trajectory data using GeoPandas and how to load the trajectory GeoDataframes as a QGIS layer. Following up on this initial experiment, I’ve now implemented a first version of an algorithm that performs a spatial analysis on my GeoPandas trajectories.

The first spatial analysis algorithm I’ve implemented is Clip trajectories by extent. Implementing this algorithm revealed a couple of pitfalls:

  • To achieve correct results, we need to compute spatial intersections between linear trajectory segments and the extent. Therefore, we need to convert our point GeoDataframe to a line GeoDataframe.
  • Based on the spatial intersection, we need to take care of computing the corresponding timestamps of the events when trajectories enter or leave the extent.
  • A trajectory can intersect the extent multiple times. Therefore, we cannot simply use the global minimum and maximum timestamp of intersecting segments.
  • GeoPandas provides spatial intersection functionality but if the trajectory contains consecutive rows without location change, these will result in zero length lines and those cause an empty intersection result.

So far, the clip result only contains the trajectory id plus a suffix indicating the sequence of the intersection segments for a specific trajectory (because one trajectory can intersect the extent multiple times). The following screenshot shows one highlighted trajectory that intersects the extent three times and the resulting clipped trajectories:

This algorithm together with the basic trajectory from points algorithm is now available in a Processing algorithm provider plugin called Processing Trajectory.

Note: This plugin depends on GeoPandas.

Note for Windows users: GeoPandas is not a standard package that is available in OSGeo4W, so you’ll have to install it manually. (For the necessary steps, see this answer on gis.stackexchange.com)

The implemented tests show how to use the Trajectory class independently of QGIS. So far, I’m only testing the spatial properties though:

def test_two_intersections_with_same_polygon(self):
    polygon = Polygon([(5,-5),(7,-5),(7,12),(5,12),(5,-5)])
    data = [{'id':1, 'geometry':Point(0,0), 't':datetime(2018,1,1,12,0,0)},
        {'id':1, 'geometry':Point(6,0), 't':datetime(2018,1,1,12,10,0)},
        {'id':1, 'geometry':Point(10,0), 't':datetime(2018,1,1,12,15,0)},
        {'id':1, 'geometry':Point(10,10), 't':datetime(2018,1,1,12,30,0)},
        {'id':1, 'geometry':Point(0,10), 't':datetime(2018,1,1,13,0,0)}]
    df = pd.DataFrame(data).set_index('t')
    geo_df = GeoDataFrame(df, crs={'init': '31256'})
    traj = Trajectory(1, geo_df)
    intersections = traj.intersection(polygon)
    result = []
    for x in intersections:
        result.append(x.to_linestring())
    expected_result = [LineString([(5,0),(6,0),(7,0)]), LineString([(7,10),(5,10)])]
    self.assertEqual(result, expected_result) 

One issue with implementing the algorithms as QGIS Processing tools in this way is that the tools are independent of one another. That means that each tool has to repeat the expensive step of creating the trajectory objects in memory. I’m not sure this can be solved.

TimeManager 3.0.2 released!

Bugfix release 3.0.2 fixes an issue where “accumulate features” was broken for timestamps with milliseconds.

If you like TimeManager, know your way around setting up Travis for testing QGIS plugins, and want to help improve TimeManager stability, please get in touch!

Thoughts on “FOSS4G/SOTM Oceania 2018”, and the PyQGIS API improvements which it caused

Last week the first official “FOSS4G/SOTM Oceania” conference was held at Melbourne University. This was a fantastic event, and there’s simply no way I can extend sufficient thanks to all the organisers and volunteers who put this event together. They did a brilliant job, and their efforts are even more impressive considering it was the inaugural event!

Upfront — this is not a recap of the conference (I’m sure someone else is working on a much more detailed write up of the event!), just some musings I’ve had following my experiences assisting Nathan Woodrow deliver an introductory Python for QGIS workshop he put together for the conference. In short, we both found that delivering this workshop to a group of PyQGIS newcomers was a great way for us to identify “pain points” in the PyQGIS API and areas where we need to improve. The good news is that as a direct result of the experiences during this workshop the API has been improved and streamlined! Let’s explore how:

Part of Nathan’s workshop (notes are available here) focused on a hands-on example of creating a custom QGIS “Processing” script. I’ve found that preparing workshops is guaranteed to expose a bunch of rare and tricky software bugs, and this was no exception! Unfortunately the workshop was scheduled just before the QGIS 3.4.2 patch release which fixed these bugs, but at least they’re fixed now and we can move on…

The bulk of Nathan’s example algorithm is contained within the following block (where “distance” is the length of line segments we want to chop our features up into):

for input_feature in enumerate(features):
    geom = feature.geometry().constGet()
    if isinstance(geom, QgsLineString):
        continue
    first_part = geom.geometryN(0)
    start = 0
    end = distance
    length = first_part.length()

    while start < length:
        new_geom = first_part.curveSubstring(start,end)

        output_feature = input_feature
        output_feature.setGeometry(QgsGeometry(new_geom))
        sink.addFeature(output_feature)

        start += distance
        end += distance

There’s a lot here, but really the guts of this algorithm breaks down to one line:

new_geom = first_part.curveSubstring(start,end)

Basically, a new geometry is created for each trimmed section in the output layer by calling the “curveSubstring” method on the input geometry and passing it a start and end distance along the input line. This returns the portion of that input LineString (or CircularString, or CompoundCurve) between those distances. The PyQGIS API nicely hides the details here – you can safely call this one method and be confident that regardless of the input geometry type the result will be correct.

Unfortunately, while calling the “curveSubstring” method is elegant, all the code surrounding this call is not so elegant. As a (mostly) full-time QGIS developer myself, I tend to look over oddities in the API. It’s easy to justify ugly API as just “how it’s always been”, and over time it’s natural to develop a type of blind spot to these issues.

Let’s start with the first ugly part of this code:

geom = input_feature.geometry().constGet()
if isinstance(geom, QgsLineString):
    continue
first_part = geom.geometryN(0)
# chop first_part into sections of desired length
...

This is rather… confusing… logic to follow. Here the script is fetching the geometry of the input feature, checking if it’s a LineString, and if it IS, then it skips that feature and continues to the next. Wait… what? It’s skipping features with LineString geometries?

Well, yes. The algorithm was written specifically for one workshop, which was using a MultiLineString layer as the demo layer. The script takes a huge shortcut here and says “if the input feature isn’t a MultiLineString, ignore it — we only know how to deal with multi-part geometries”. Immediately following this logic there’s a call to geometryN( 0 ), which returns just the first part of the MultiLineString geometry.

There’s two issues here — one is that the script just plain won’t work for LineString inputs, and the second is that it ignores everything BUT the first part in the geometry. While it would be possible to fix the script and add a check for the input geometry type, put in logic to loop over all the parts of a multi-part input, etc, that’s instantly going to add a LOT of complexity or duplicate code here.

Fortunately, this was the perfect excuse to improve the PyQGIS API itself so that this kind of operation is simpler in future! Nathan and I had a debrief/brainstorm after the workshop, and as a result a new “parts iterator” has been implemented and merged to QGIS master. It’ll be available from version 3.6 on. Using the new iterator, we can simplify the script:

geom = input_feature.geometry()
for part in geom.parts():
    # chop part into sections of desired length
    ...

Win! This is simultaneously more readable, more Pythonic, and automatically works for both LineString and MultiLineString inputs (and in the case of MultiLineStrings, we now correctly handle all parts).

Here’s another pain-point. Looking at the block:

new_geom = part.curveSubstring(start,end)
output_feature = input_feature
output_feature.setGeometry(QgsGeometry(new_geom))

At first glance this looks reasonable – we use curveSubstring to get the portion of the curve, then make a copy of the input_feature as output_feature (this ensures that the features output by the algorithm maintain all the attributes from the input features), and finally set the geometry of the output_feature to be the newly calculated curve portion. The ugliness here comes in this line:

output_feature.setGeometry(QgsGeometry(new_geom))

What’s that extra QgsGeometry(…) call doing here? Without getting too sidetracked into the QGIS geometry API internals, QgsFeature.setGeometry requires a QgsGeometry argument, not the QgsAbstractGeometry subclass which is returned by curveSubstring.

This is a prime example of a “paper-cut” style issue in the PyQGIS API. Experienced developers know and understand the reasons behind this, but for newcomers to PyQGIS, it’s an obscure complexity. Fortunately the solution here was simple — and after the workshop Nathan and I added a new overload to QgsFeature.setGeometry which accepts a QgsAbstractGeometry argument. So in QGIS 3.6 this line can be simplified to:

output_feature.setGeometry(new_geom)

Or, if you wanted to make things more concise, you could put the curveSubstring call directly in here:

output_feature = input_feature
output_feature.setGeometry(part.curveSubstring(start,end))

Let’s have a look at the simplified script for QGIS 3.6:

for input_feature in enumerate(features):
    geom = feature.geometry()
    for part in geom.parts():
        start = 0
        end = distance
        length = part.length()

        while start < length:
            output_feature = input_feature
            output_feature.setGeometry(part.curveSubstring(start,end))
            sink.addFeature(output_feature)

            start += distance
            end += distance

This is MUCH nicer, and will be much easier to explain in the next workshop! The good news is that Nathan has more niceness on the way which will further improve the process of writing QGIS Processing script algorithms. You can see some early prototypes of this work here:

So there we go. The process of writing and delivering a workshop helps to look past “API blind spots” and identify the ugly points and traps for those new to the API. As a direct result of this FOSS4G/SOTM Oceania 2018 Workshop, the QGIS 3.6 PyQGIS API will be easier to use, more readable, and less buggy! That’s a win all round!

Movement data in GIS #16: towards pure Python trajectories using GeoPandas

Many of my previous posts in this series [1][2][3] have relied on PostGIS for trajectory data handling. While I love PostGIS, it feels like overkill to require a database to analyze smaller movement datasets. Wouldn’t it be great to have a pure Python solution?

If we look into moving object data literature, beyond the “trajectories are points with timestamps” perspective, which is common in GIS, we also encounter the “trajectories are time series with coordinates” perspective. I don’t know about you, but if I hear “time series” and Python, I think Pandas! In the Python Data Science Handbook, Jake VanderPlas writes:

Pandas was developed in the context of financial modeling, so as you might expect, it contains a fairly extensive set of tools for working with dates, times, and time-indexed data.

Of course, time series are one thing, but spatial data handling is another. Lucky for us, this is where GeoPandas comes in. GeoPandas has been around for a while and version 0.4 has been released in June 2018. So far, I haven’t found examples that use GeoPandas to manage movement data, so I’ve set out to give it a shot. My trajectory class uses a GeoDataFrame df for data storage. For visualization purposes, it can be converted to a LineString:

import pandas as pd 
from geopandas import GeoDataFrame
from shapely.geometry import Point, LineString

class Trajectory():
    def __init__(self, id, df, id_col):
        self.id = id
        self.df = df    
        self.id_col = id_col
        
    def __str__(self):
        return "Trajectory {1} ({2} to {3}) | Size: {0}".format(
            self.df.geometry.count(), self.id, self.get_start_time(), 
            self.get_end_time())
        
    def get_start_time(self):
        return self.df.index.min()
        
    def get_end_time(self):
        return self.df.index.max()
        
    def to_linestring(self):
        return self.make_line(self.df)
        
    def make_line(self, df):
        if df.size > 1:
            return df.groupby(self.id_col)['geometry'].apply(
                lambda x: LineString(x.tolist())).values[0]
        else:
            raise RuntimeError('Dataframe needs at least two points to make line!')

    def get_position_at(self, t):
        try:
            return self.df.loc[t]['geometry'][0]
        except:
            return self.df.iloc[self.df.index.drop_duplicates().get_loc(
                t, method='nearest')]['geometry']

Of course, this class can be used in stand-alone Python scripts, but it can also be used in QGIS. The following script takes data from a QGIS point layer, creates a GeoDataFrame, and finally generates trajectories. These trajectories can then be added to the map as a line layer.

All we need to do to ensure that our data is ordered by time is to set the GeoDataFrame’s index to the time field. From then on, Pandas takes care of the time series aspects and we can access the index as shown in the Trajectory.get_position_at() function above.

# Get data from a point layer
l = iface.activeLayer()
time_field_name = 't'
trajectory_id_field = 'trajectory_id' 
names = [field.name() for field in l.fields()]
data = []
for feature in l.getFeatures():
    my_dict = {}
    for i, a in enumerate(feature.attributes()):
        my_dict[names[i]] = a
    x = feature.geometry().asPoint().x()
    y = feature.geometry().asPoint().y()
    my_dict['geometry']=Point((x,y))
    data.append(my_dict)

# Create a GeoDataFrame
df = pd.DataFrame(data).set_index(time_field_name)
crs = {'init': l.crs().geographicCrsAuthId()} 
geo_df = GeoDataFrame(df, crs=crs)
print(geo_df)

# Test if spatial functions work
print(geo_df.dissolve([True]*len(geo_df)).centroid)

# Create a QGIS layer for trajectory lines
vl = QgsVectorLayer("LineString", "trajectories", "memory")
vl.setCrs(l.crs()) # doesn't stop popup :(
pr = vl.dataProvider()
pr.addAttributes([QgsField("id", QVariant.String)])
vl.updateFields() 

df_by_id = dict(tuple(geo_df.groupby(trajectory_id_field)))
trajectories = {}
for key, value in df_by_id.items():
    traj = Trajectory(key, value, trajectory_id_field)
    trajectories[key] = traj
    line = QgsGeometry.fromWkt(traj.to_linestring().wkt)
    f = QgsFeature()
    f.setGeometry(line)
    f.setAttributes([key])
    pr.addFeature(f) 
print(trajectories[1])

vl.updateExtents() 
QgsProject.instance().addMapLayer(vl)

The following screenshot shows this script applied to a sample of the Geolife datasets containing 100 trajectories with a total of 236,776 points. On my notebook, the runtime is approx. 20 seconds.

So far, GeoPandas has proven to be a convenient way to handle time series with coordinates. Trying to implement some trajectory analysis tools will show if it is indeed a promising data structure for trajectories.

My favorite new recipe in QGIS Map Design 2nd ed

If you follow me on Twitter, you have probably already heard that the ebook of “QGIS Map Design 2nd Edition” has now been published and we are expecting the print version to be up for sale later this month. Gretchen Peterson and I – together with our editor Gary Sherman (yes, that Gary Sherman!) – have been working hard to provide you with tons of new and improved map design workflows and many many completely new maps. By Gretchen’s count, this edition contains 23 new maps, so it’s very hard to pick a favorite!

Like the 1st edition, we provide increasingly advanced recipes in three chapters, each focusing on either layer styling, labeling, or creating print layouts. If I had to pick a favorite, I’d have to go with “Mastering Rotated Maps”, one of the advanced recipes in the print layouts chapter. It looks deceptively simple but it combines a variety of great QGIS features and clever ideas to design a map that provides information on multiple levels of detail. Besides the name inspiring rotated map items, this design combines

  • map overviews
  • map themes
  • graduated lines and polygons
  • a rotated north arrow
  • fancy leader lines

all in one:

“QGIS Map Design 2nd Edition” provides how-to instructions, as well as data and project files for each recipe. So you can jump right into it and work with the provided materials or apply the techniques to your own data.

The ebook is available at LocatePress.

(Nederlands) BGT Import plugin vernieuwd

Sorry, this entry is only available in the Dutch language

QGIS Server 3 : OGC Certification work for WFS 1.1.0

QGIS Server is an open source OGC data server which uses QGIS engine as backend. It becomes really awesome because a simple desktop qgis project file can be rendered as web services with exactly the same rendering, and without any mapfile or xml coding by hand.

QGIS Server provides a way to serve OGC web services like WMS, WCS, WFS and WMTS resources from a QGIS project, but can also extend services like GetPrint which takes advantage of QGIS’s map composer power to generate high quality PDF outputs.

Since the 3.0.2 version, QGIS Server is certified as an official OGC reference implementation for WMS 1.3.0 and reports are generated in a daily continuous integration to avoid regressions.


Thus, the next step was naturally to take a look at the WFS 1.1.0 thanks to the support of the QGIS Grant Program

Side note, this Grant program is made possible thanks to your direct sponsoring and micro-donations to QGIS.org.

TEAM Engine test suite for WFS 1.1.0

We use a tool provided by the OGC Compliance Program to run dedicated tests on the server : Teamengine (Test, Evaluation, And Measurement Engine).

Test suites are available through a web interface. However, for the needs of continuous integration, these tests have to be run without user interaction. In the case of WMS 1.3.0, nothing more easy than using the REST API:

$ curl "http://localhost:8081/teamengine/rest/suites/wms/1.20/run?queryable=queryable&basic=basic&capabilities-url=http://172.17.0.2/qgisserver?REQUEST=GetCapabilities%26SERVICE=WMS%26VERSION=1.3.0%26MAP=/data/teamengine_wms_130.qgs


However, the WFS 1.1.0 test suite does not provide a REST API and makes the situation less straightforward. We switched to using TEAM Engine directly from command line:

$ cd te_base
$ ./bin/unix/test.sh -source=wfs/1.1.0/ctl/main.ctl -form=params.xml

The params.xml file allows to configure underlying tests. In this particular case, the GetCapabilities URL of the QGIS Server to test is given.  Results are available thanks to the viewlog.sh shell script:

$ ./bin/unix/viewlog.sh -logdir=te_base/users/root/ -session=s0001
Test wfs:wfs-main type Mandatory (s0001) Failed (InheritedFailure)
   Test wfs:readiness-tests type Mandatory (s0001/d68e38807_1) Failed (InheritedFailure)
      Test ctl:SchematronValidatingParser type Mandatory (s0001/d68e38807_1/d68e588_1) Failed
      Test wfs:basic-main type Mandatory (s0001/d68e38807_1/d68e636_1) Failed (InheritedFailure)
         Test wfs:run-GetCapabilities-basic-cc-GET type Mandatory (s0001/d68e38807_1/d68e636_1/d68e28810_1) Failed (InheritedFailure)
            Test wfs:wfs-1.1.0-Basic-GetCapabilities-tc1 type Mandatory (s0001/d68e38807_1/d68e636_1/d68e28810_1/d68e1095_1) Passed
               Test ctl:assert-xpath type Mandatory (s0001/d68e38807_1/d68e636_1/d68e28810_1/d68e1095_1/d68e1234_1) Passed
            Test wfs:wfs-1.1.0-Basic-GetCapabilities-tc2 type Mandatory (s0001/d68e38807_1/d68e636_1/d68e28810_1/d68e1100_1) Passed
               Test ctl:assert-xpath type Mandatory (s0001/d68e38807_1/d68e636_1/d68e28810_1/d68e1100_1/d68e1305_1) Passed
            Test wfs:wfs-1.1.0-Basic-GetCapabilities-tc3 type Mandatory (s0001/d68e38807_1/d68e636_1/d68e28810_1/d68e1105_1) Passed
               Test ctl:assert-xpath type Mandatory (s0001/d68e38807_1/d68e636_1/d68e28810_1/d68e1105_1/d68e1558_1) Passed
               Test ctl:assert-xpath type Mandatory (s0001/d68e38807_1/d68e636_1/d68e28810_1/d68e1105_1/d68e1582_1) Passed
               Test ctl:assert-xpath type Mandatory (s0001/d68e38807_1/d68e636_1/d68e28810_1/d68e1105_1/d68e1606_1) Passed
...
...

Finally, a Python script has been written to read these logs and generate HTML report easily readable. Thanks to our QGIS-Server-CertifSuite, providing the continuous integration infrastructure with Docker images, these reports are also generated daily.

Bugfix and Conclusion

First results were clear: a lot of work is necessary to have a QGIS Server certified for WFS 1.1.0!

We started fixing the issues one by one:

And now we have a much better support than 6 months ago

However, some work still need to be done to finally obtain the OGC certification for WFS 1.1.0. To be continued!

Please contact us if you want QGIS server to become a reference implementation for all OGC service !

French Ministry in charge of the ecological transition selected Oslandia

Ministère de la Transition Écologique et Solidaire Logo

The French ministry of the ecological transition  selected Oslandia for two of the three packages of its call for tender procedure dedicated to geomatic tools.  We are very proud to dedicate our team to one of the strongest support of geomatics and Open Source in France for the next 2 to 4 years.

First package is dedicated to expert studies covering spatial databases, software, components, protocols, norms and standards in the geomatics fields.

Second package provides support and development for QGIS,  the spatial cartridge PostGIS of PostgreSQL and their components. We are really happy to continue a common work already engaged in the previous contract.

This is again another proof that we face a major tendency of open source investment, where geomatics components are currently among the most dynamic and strongest open source projects. This is also a confirmation that actors are now integrating deeply the economic rationale of open source contribution inside their politics.

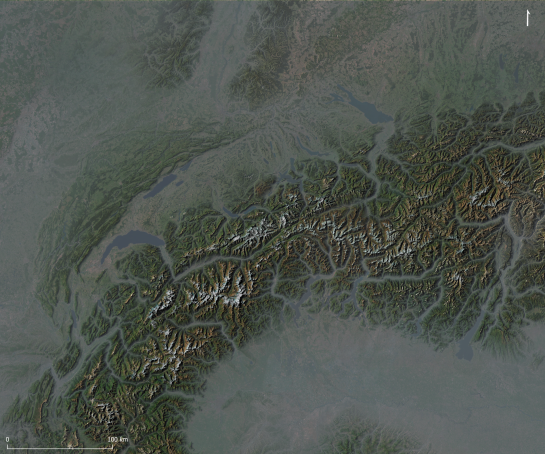
Add Realistic Mist and Fog to Topography in QGIS 3.2

I recently came across a great tutorial by in which he demonstrated how to create map of Switzerland in the style of Edward Imhof, the famed Swiss cartographer renowned for his hand painted maps of Switzerland and other mountainous regions of the world. John’s map used traditional hillshading, multidirectional hillshading and crucially, a translucent topographic layer that created a mist like appearance he likened to the sfumato technique used by painters since the Renascence.

I followed John’s tutorial in QGIS 3.2 and I was quite pleased with the initial result below. However, the process creating it is a bit too complicated for a tutorial so I set about simplifying the process and rather than imitating Imhof’s distinct style, my goal this time is realism.

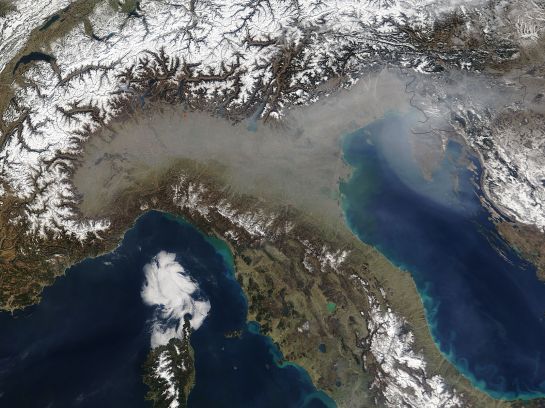
The heart of the effect involves the very clever idea of using the topographic layer as a subtle opacity mask to simulate mist, fog and atmospheric haze. Have a look at the image below taken on March 17th, 2005 by NASA’s Terra satellite. This is the industrialised Po valley of northern Italy, surrounded by the Alps and Apennine Mountains that rise above the valley’s hazy pollution. The haze adds a sense of depth to the surrounding hills and mountains. It’s not uncommon to see fog and pollution in satellite imagery that gives way to the clear air in high mountains e.g. northern India and Nepal, China, Pakistan and India. Creating a similar mist effect in QGIS is actually quite simple.

First download topography for the Alps and Po region (a 68.55 Mb GeoTiff file derived from freely available EU-DEM data I resampled from 25 to 100m resolution). Next, make sure you have the plugin QuickMapServics (QMS) installed (menu Plugins – Manage and Install Plugins). This great plugin provides access to over 1000 basemaps.

Load the GeoTiff file into QGIS (Raster – Load) and rename the layer Hillshade. Right click the layer to open the Layer Properties window. In the Symbology panel, next to Render Type, choose Hillshade. Change the altitude to 35 degrees, Azimuth to 300 degrees and Z Factor of 1.5 (illuminating the landscape from the top left). Finally, change the Blending mode to Multiply. Click OK to close the dialogue.

To add the basemap layer, Esri World Imagery (Clarity), type “ESRI clarity” in the QMS search bar to find and add the basemap; Go to View – Panels and activate the QMS search bar if it isn’t initially visible. Make sure it’s the bottommost layer.

Oh, that’s a bit disappointing, we only increased the relief little a bit. It’s missing the vitally important mist layer.

To create mist, right click the Hillshade layer and choose Duplicate. Rename the new layer Mist and make sure it’s above the Hillshade layer. Now open the Layer Properties window of the layer, we’re going edit it’s attributes to make it look like mist.

Change the Render type to Singleband Pseudocolor and use 0 and 3000 for the min and max values (limiting maximum latitude of the mist to 3000 meters). Then open the colour ramp window by clicking on the Color ramp and enter these values:

  • Left Gradient – HSV 215 15 50 and 75% transparency
  • Right Gradient – HSV 215 15 50 and 0% transparency

Close the Color Ramp dialogue. In the Layer Properties window, and this is very important, change the Blending mode to Lighten. Click OK to close the Layer Properties window.

Wow, we have mist!

The mist effect looks great. It certainly adds a lot of realism to the topographic map, it now looks quite like NASA’s images. This is just a quick and basic map so there’s lots of scope to improve the effect. Play around with the colour of the mist layer and its opacity, or even brighten the Hillshade layer underneath. See what effects these changes have.

Here’s another example below. In this example I duplicated the hillshade layer and set the second hillshade layer to Multidirectional Hillshading (yes, QGIS 3.2 has Multidirectional Hillshading). I then adjusted the transparency of both hillshade layers so they blended together nicely. I then replaced the basemap with another duplicated topography layer that I coloured using the gradient sd-a (by Jim Mossman, 2005) using the cpt-city plugin. And lastly, I doubled the opacity of the mist layer turning it into a milky fog. I think it looks great!

What next? Well, there’s lots of possibilities. Perhaps download Martian topography and add mist to the bottom of Valles Marineris?

References:

Eduard Imhof – Biography

TV documentary about Eduard Imhof

The Map as an Artistic Territory: Relief Shading Works and Studies by Eduard Imhof

Haze in northern Italy – NASA Terra Satellite

Tzvetkov, J., 2018. Relief visualization techniques using free and open source GIS tools. Polish Cartographical Review, 50(2), pp.61-71.

Programme change…

See the Dutch website for more info on the programme.

Edit Features “In Place” crowdfund — made it to QGIS 3.4!

Well, thanks to the resounding success of our QGIS edit-in-place crowdfunding campaign, we’ve been frantically smashing away at our keyboards in an attempt to reward the QGIS community by sneaking this feature in a whole 4 months earlier than originally promised! And, we’re very proud to announce, that this exciting new feature has been implemented and will be included in the upcoming QGIS 3.4 release (due late October 2018). So go ahead — grab one of the nightly pre-release of QGIS 3.4 and checkout the results.

This wouldn’t have been possible without the rapid response to the campaign and the generosity of our wonderful backers:

(In addition to these backers, we’ve also received numerous anonymous donations to this feature from many other individuals — while we can’t list you all publicly, you’re also in our thanks!)


Keep an eye on this blog for other upcoming QGIS crowdfunding campaigns targeted at QGIS 3.6 and beyond… we’ve got lots more exciting work planned for these releases!


Dutch QGIS usergroup meeting

All presentations will be in Dutch. Please have a look at the Dutch version of this page to see more…

Edit Features “In Place” crowdfund — target reached!

Well, the final pledges have been tallied and we’re very proud to announce that our latest crowd funding campaign has been a roaring success!

We’ve been completely blown away by the response to this campaign. Thanks to some incredibly generous backers and donors, we’ve been able to hit the campaign target with plenty of time to spare. As a result, we’ll be pushing hard to reward the generosity of the community by trying to sneak this feature in for the upcoming QGIS 3.4 release (instead of the originally promised 3.6 release)! You can read more about what we’re adding at the campaign page.

We’d like to take this opportunity to extend our heartfelt thanks to all the backers who have pledged to support this project:

In addition to these backers, we’ve also received numerous anonymous donations to this feature from many other individuals — while we can’t list you all publicly, you’re also in our thanks!

Stay tuned for more updates to come as work proceeds on this feature…

  • <<
  • Page 8 of 44 ( 874 posts )
  • >>
  • qgis

Back to Top

Sustaining Members