(Nederlands) 3 oktober QGIS gebruikersdag in Nieuwegein
Sorry, this entry is only available in the Dutch language
Sorry, this entry is only available in the Dutch language
From https://en.wikipedia.org/wiki/OpenCL:
OpenCL (Open Computing Language) is a framework for writing programs that execute across heterogeneous platforms consisting of central processing units (CPUs), graphics processing units (GPUs), digital signal processors (DSPs), field-programmable gate arrays (FPGAs) and other processors or hardware accelerators. OpenCL specifies programming languages (based on C99 and C++11) for programming these devices and application programming interfaces (APIs) to control the platform and execute programs on the compute devices. OpenCL provides a standard interface for parallel computing using task- and data-based parallelism.
Basically, you write a program and you execute it on a GPU (or, less frequently, on a CPU or on a DSP) taking advantage of the huge parallel programming capabilities of the modern graphic cards.
Depending on many different factors, the speed gain can vary to a great extent, but it is typically around one order of magnitude.
The work I’ve done consisted in integrating OpenCL support into QGIS and writing all the utilities to load, build and run OpenCL programs.
For now, I’ve ported the following QGIS core algorithms, all of them are availabe in processing:
Since the framework to support OpenCL is now in place, I think that more algorithms will be ported over the time.
During this development, even if was not in scope, the hillshade renderer has been optimized for speed and it can also benefit of OpenCL acceleration.
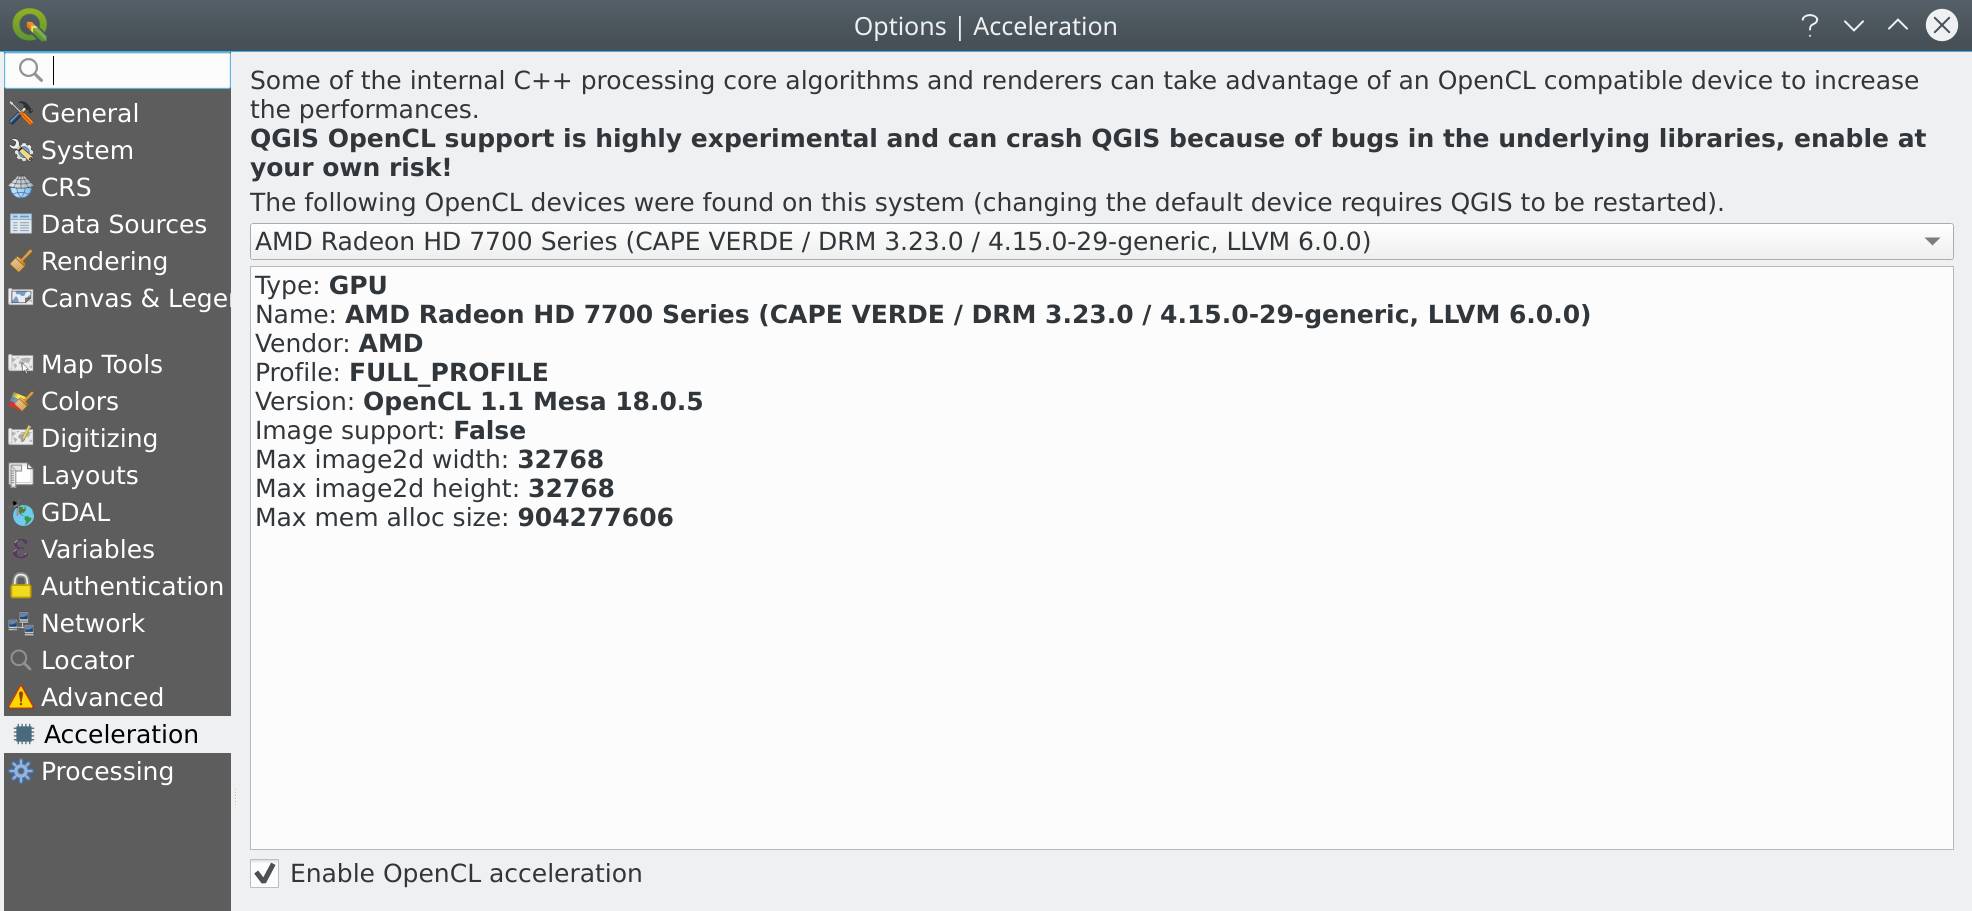
OpenCL support is optional and opt-in, to use it, you need to activate it into the QGIS options dialog like shown in the screenshot below:
Well, YMMV, but here are some figures for a big DEM raster, low values mean faster execution.
GDAL means CPU execution using the GDAL processing algorithm.
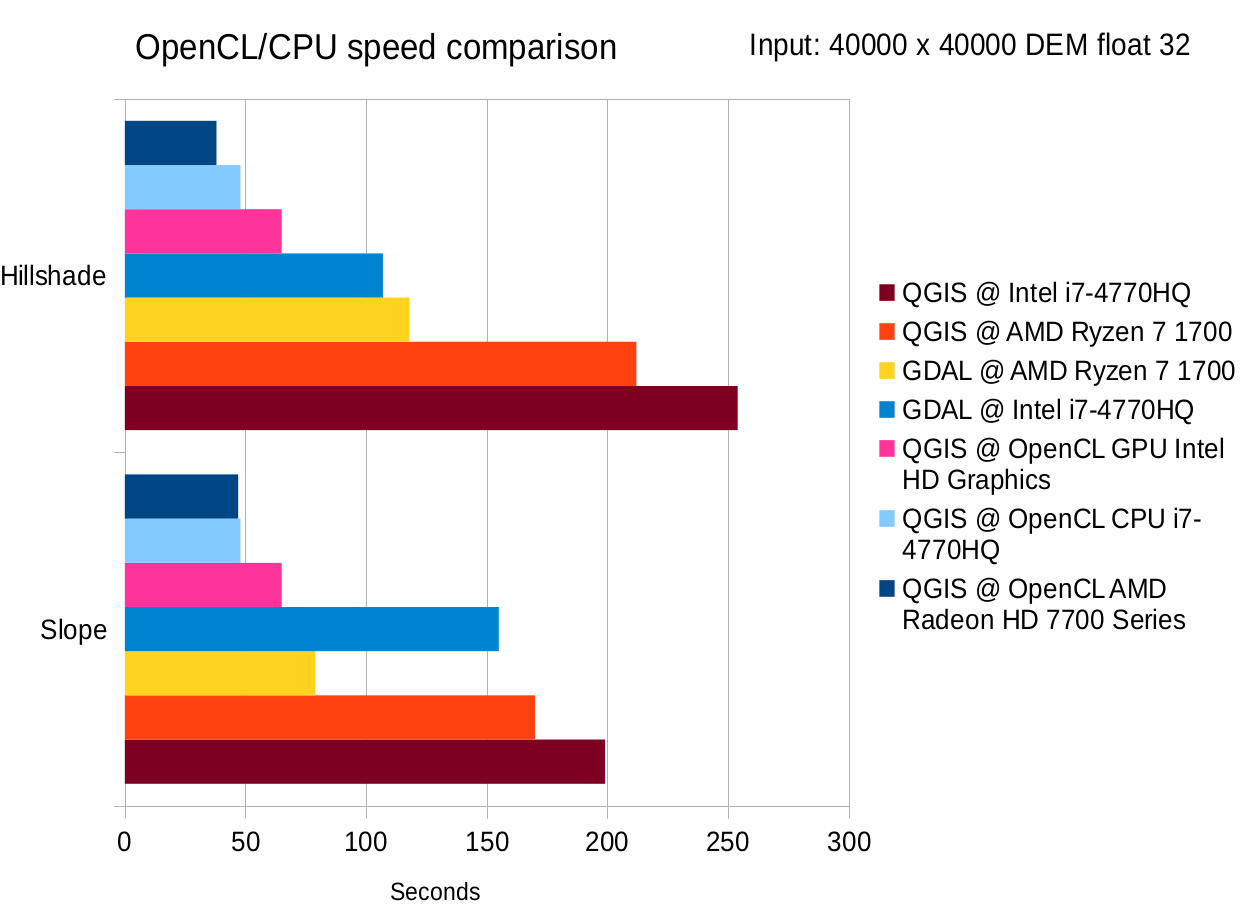
Of course it depends on your specific hardware and on your O.S., AMD, NVidia and Intel have different distributions channels, in general the driver for your graphic card will also provide the OpenCL driver, if your GPU is compatible, if OpenCL is not available on your current machine, try to Google for OpenCL, your O.S. and graphic card.
If there is no OpenCL support for your graphic card, you might try to install a driver for your GPU (Intel for example provides them) and you will probably have a decent acceleration even if not as much as you can get on a real graphic card.
This fact worths some more explanation: you might ask your self why running and algorithm directly on the CPU and running it on the same CPU but using OpenCL would make any difference and the reason why it is generally faster by using OpenCL is that OpenCL will run the algorithm in parallel on all cores of your CPU, while a normal application (and QGIS does not make an exception here) will use a single core.
Just a quick note: you’ll need to install the OpenCL headers and the ICD library:
sudo apt-get install opencl-headers ocl-icd-opencl-dev
I started this work as a proof of concept in my spare time (that it is not much, lately) and when I realized that it was promising, I submitted a QGIS grant proposal in order to allocate some working time to port more algorithms, write tests and polish the implementation.
This work would not be possible without all the generous sponsors and donors that feed the QGIS grant program year after year, many thanks to the QGIS community for this amazing support!
Jürgen Fischer was as usual very helpful and took care of the windows builds, now available in OSGeo4W packages.
Nyall Dawson helped with the code review and with testing the implementation on different cards and machines.
Matthias Kuhn reviewed the code.
Even Rouault pointed me to some highly efficient GDAL algorithm optimizations that I’ve been able to integrate in QGIS.
The post OpenCL acceleration now available in QGIS first appeared on Open Web Solutions, GIS & Python Development.
We’ve just launched a new QGIS crowd funding campaign which we’re super-excited about! This time, we’re addressing what we see as the major shortcoming within QGIS vector layer editing tools, and bridging the gap between the vast power of QGIS’ Processing algorithms and easy-to-use operations which modify layer features “in place”. Here’s a quick sneak preview of what we have planned:

QGIS is already a vector editing powerhouse, and we believe that this improvement will boost the current functionality up an order of magnitude! To make it possible we need 6500€ pledged before 30 September 2018.
This is also our first crowdfunding campaign in which we’re running a “dual funding” approach, which we think should make things friendly and easy for both corporate backers and end user contributions alike. Read more about this at the full campaign page.
You can help make this a reality by supporting the campaign or by sharing the page and increasing exposure to the campaign. Updates to follow!
If you’re are following me on Twitter, you’ve certainly already read that I’m working on PyQGIS 101 a tutorial to help GIS users to get started with Python programming for QGIS.
I’ve often been asked to recommend Python tutorials for beginners and I’ve been surprised how difficult it can be to find an engaging tutorial for Python 3 that does not assume that the reader already knows all kinds of programming concepts.
It’s been a while since I started programming, but I do teach QGIS and Python programming for QGIS to university students and therefore have some ideas of which concepts are challenging. Nonetheless, it’s well possible that I overlook something that is not self explanatory. If you’re using PyQGIS 101 and find that some points could use further explanations, please leave a comment on the corresponding page.
PyQGIS 101 is a work in progress. I’d appreciate any feedback, particularly from beginners!
My main reasons for having Python data provider were:
This topic has been floating in my head for a while since I decided to give it a second look and I finally implemented it and merged for the next 3.2 release.
To make this possible I had to:
First, let me say that it wasn’t like a walk in the park: the Python bindings part is always like diving into woodoo and black magic recipes before I can get it to work properly.
For the Python provider sample implementation I decided to re-implement the memory (aka: scratch layers) provider because that’s one of the simplest providers and it does not depend on any external storage or backend.
For now, the main source of information is the API and the tests:
To register your own provider (PyProvider in the snippet below) these are the basic steps:
metadata = QgsProviderMetadata(PyProvider.providerKey(), PyProvider.description(), PyProvider.createProvider)
QgsProviderRegistry.instance().registerProvider(metadata)
To create your own provider you will need at least the following components:
QgsVectorDataProvider)QgsAbstractFeatureSource)QgsAbstractFeatureIterator)Be aware that the implementation of a data provider is not easy and you will need to write a lot of code, but at least you could get some inspiration from the existing example.
Enjoy wirting data providers in Python and please let me know if you’ve fond this implementation useful!
The post Create a QGIS vector data provider in Python is now possible first appeared on Open Web Solutions, GIS & Python Development.
Last year we had the opportunity to implement ‘.QGZ’ as anew variant of the QGIS 3 project file format.
This is simply a zipped container for the QGS xml file. We took benefit of that container to store the auxiliary storage database into it – only if users choose that optional format though.
In classical mode, the auxiliary database is saved as a .qgd file along the xml file.
qgd auxiliary storage file
qgz file format saving
When choosing the zipped container, the qgd file falls into the qgz, and this becomes totally transparent for end users. No more issues, you can’t delete it or forget to copy it when sharing project files!
The great news today is that for qgis 3.2, qgz will be the default format!
This will offers many possibilities like embbeding:
If you are interested in going further this, please contact us!
For those interested in dutch OpenData: our national OpenData service PDOK has a Solr based geocoding service available. Since this week it is possible to search for ‘parcel’ codes to find cadastral parcels, but also to search on so called ‘hectometer-paaltjes': the little green number signs you see when you drive the dutch highways. So … Continue reading Locatieserver: about parcels and roadnumbers
Via twitter: AmsterdamTimeMachine.nl. Jan Hartman’s and WebMappers hard work of georeferencing a set of Old Amsterdam maps: http://amsterdamtimemachine.nl. 6 XYZ-Map services with maps old as 1625 to have a look into history, off course also to be loaded in QGIS Wanna see ‘the red light district’ in 1625? Or see Dutch 17th century glory on … Continue reading AmsterdamTimeMachine
What is a Locator (plugin) Some months ago, Nyall Dawson silently dropped a nice widget into the lower left corner of your QGIS screen: People familiar with QtCreator (the Qt-development environment) should recognize it as a QtCreator Locator look-a-like: a way to (very) quickly search in your project for words, classes, bookmarks, help topics, files … Continue reading Coding a QgsLocator (Plugin)
In Movement data in GIS #2: visualization I mentioned that it should be possible to label trajectory segments without having to break the original trajectory feature. While it’s not a straightforward process, it is indeed possible to create timestamp labels at desired intervals:
The main point here is that we cannot use regular labels because there would be only one label for the whole trajectory feature. Instead, we are using a marker line with a font marker:
By default, font markers only display one character from a given font but by using expressions we can make it display longer text, including datetime strings:
If you want to have a label at every node of the trajectory, the expression looks like this:
format_date(
   to_datetime('1970-01-01T00:00:00Z')+to_interval(
      m(start_point(geometry_n(
         segments_to_lines( $geometry ),
         @geometry_part_num)
      ))||' seconds'
   ),
   'HH:mm:ss'
)
You probably remember those parts of the expression that extract the m value from previous posts. Note that – compared to 2016 – it is now necessary to add the segments_to_lines() function.
The m value (which stores time as seconds since Unix epoch) is then converted to datetime and finally formatted to only show time. Of course you can edit the datetime format string to also include the date.
If we only want a label every 30 seconds, we can add a case statement around that:
CASE WHEN
m(start_point(geometry_n(
   segments_to_lines( $geometry ),
   @geometry_part_num)
)) % 30 = 0
THEN
format_date(
   to_datetime('1970-01-01T00:00:00Z')+to_interval(
      m(start_point(geometry_n(
         segments_to_lines( $geometry ),
         @geometry_part_num)
      ))||' seconds'
   ),
   'HH:mm:ss'
)
END
This works well if the trajectory sampling interval is fairly regular. This is not always the case and that means that the above case statement wouldn’t find many nodes with a timestamp that ends in :30 or :00. In such a case, we could resort to labeling nodes based on their order in the linestring:
CASE WHEN
 @geometry_part_num  % 30 = 0
THEN
...
Thanks a lot to @JuergenEFischer for providing a solution for converting seconds since Unix epoch to datetime without a custom function!
Note that expressions using @geometry_part_num currently suffer from the following issue: Combination of segments_to_lines($geometry) and @geometry_part_num gives wrong segment numbers
This post is part of a series. Read more about movement data in GIS.
Update: donations are now closed, with the outcome of the campaign pending!
We’re nearing the final hours of our crowd funding campaign to implement a drill-down (cascading) field support within QGIS forms, and thanks to numerous generous backers we’re very close to hitting the funding goal! This is a really exciting new feature which would help add greater flexibility and power to QGIS feature forms, but in order to implement it for QGIS 3.2 we need to hit the funding target by 11 May 2018.
As a result, we’re dropping the minimum contribution amount and throwing open the campaign for payments of any amount. These smaller payment will be treated as direct donations to the campaign, so unlike the standard campaign backing these are payable up front. In the case that the campaign IS NOT successful, the donations will not be refunded and will instead be reinvested back into the QGIS (via bug fixing and maintenance efforts). Of course, if you’d prefer to pledge using the standard crowdfunding “no payment if campaign unsuccessful” model you’re more than welcome to! (Full details are available on the campaign page).
Donations closed – outcome pending!

Full details are available on the campaign page.
 With support from Orange we’ve created Docker images for QGIS. All the material for building and running these images is open-source and freely available on GitHub: https://github.com/Oslandia/docker-qgis.
![]()
The docker-qgis repository includes two Docker images: qgis-build and qgis-exec.
The qgis-build image includes all the libraries and tools necessary for building QGIS from source. Building QGIS requires installing a lot of dependencies, so it might not be easy depending on the Operating System you use. The qgis-build image makes it easy and repeatable. The result of a QGIS build is Debian Stretch packages that can be used for building the qgis-exec image, as explained below.
The qgis-exec image includes a runtime environment for QGIS Server. The image makes it easy to deploy and run QGIS Server. It is meant to be be generic and usable in various contexts, and in production. There are two ways to build the qgis-exec image. It can be built from the official QGIS 3 Debian packages (http://qgis.org/debian/), or from local QGIS Debian Stretch packages that were built using the qgis-build image.
We encourage you to go test and use our images! We haven’t pushed the images to the Docker Hub yet, but this is in the plans.
Feel free to contact us on GitHub or by email for any question or request!
This post is to announce the availability of a new version of the PdokServicePlugin. Unless a heavy user of Dutch Public Datasources (WMS, WFS, WCS), this is probably mostly interesting for Dutchies. But if you want to know how many kilometers somebody is living from the nearest Fire Department Station:
We’ve just launched a new crowd funding campaign to implement a drill-down (cascading) field support within QGIS forms. Full details are available on the campaign page.

This is a really exciting new feature which would help add greater flexibility and power to QGIS feature forms! To make it possible we need 3500€ pledged before 11 May 2018. You can help make this a reality by supporting the campaign or by sharing the page and increasing exposure to the campaign. Updates to follow!
Remember the good old times when all parameters in Processing were mandatory?
Inputs and outputs are fixed, and optional parameters or outputs are not supported. [Graser & Olaya, 2015]
Since QGIS 2.14, this is no longer the case. Scripts, as well as models, can now have optional parameters. Here is how for QGIS 3:
When defining a Processing script parameter, the parameter’s constructor takes a boolean flag indicating whether the parameter should be optional. It’s false by default:
class qgis.core.QgsProcessingParameterNumber(
   name: str, description: str = '',
   type: QgsProcessingParameterNumber.Type = QgsProcessingParameterNumber.Integer,
   defaultValue: Any = None,
   optional: bool = False,
   minValue: float = -DBL_MAX+1, maxValue: float = DBL_MAX)
(Source: http://python.qgis.org/api/core/Processing/QgsProcessingParameterNumber.html)
One standard tool that uses optional parameters is Add autoincremental field:
From Python, this algorithm can be called with or without the optional parameters:
When building a model, an optional input can be assigned to the optional parameter. To create an optional input, make sure to deactivate the mandatory checkbox at the bottom of the input parameter definition:
Then this optional input can be used in an algorithm. For example, here the numerical input optional_value is passed to the Start values at parameter:
You can get access to all available inputs by clicking the … button next to the Start values at field. In this example, I have access to values of the input layer as well as the optional value:
Once this is set up, this is how it looks when the model is run:
You can see that the optional value is indeed Not set.
Processing has been overhauled significantly for QGIS 3.0. Besides speed-ups, one of the most obvious changes is the way to write Processing scripts. Instead of the old Processing-specific syntax, Processing scripts for QGIS3 are purely pythonic implementations of QgsProcessingAlgorithm.
Here’s a template that you can use to develop your own algorithms:
from qgis.PyQt.QtCore import QCoreApplication, QVariant
from qgis.core import (QgsField, QgsFeature, QgsFeatureSink, QgsFeatureRequest, QgsProcessing, QgsProcessingAlgorithm, QgsProcessingParameterFeatureSource, QgsProcessingParameterFeatureSink)

class ExAlgo(QgsProcessingAlgorithm):
    INPUT = 'INPUT'
    OUTPUT = 'OUTPUT'

    def __init__(self):
        super().__init__()

    def name(self):
        return "exalgo"

    def tr(self, text):
        return QCoreApplication.translate("exalgo", text)

    def displayName(self):
        return self.tr("Example script")

    def group(self):
        return self.tr("Examples")

    def groupId(self):
        return "examples"

    def shortHelpString(self):
        return self.tr("Example script without logic")

    def helpUrl(self):
        return "https://qgis.org"

    def createInstance(self):
        return type(self)()

    def initAlgorithm(self, config=None):
        self.addParameter(QgsProcessingParameterFeatureSource(
            self.INPUT,
            self.tr("Input layer"),
            [QgsProcessing.TypeVectorAnyGeometry]))
        self.addParameter(QgsProcessingParameterFeatureSink(
            self.OUTPUT,
            self.tr("Output layer"),
            QgsProcessing.TypeVectorAnyGeometry))

    def processAlgorithm(self, parameters, context, feedback):
        source = self.parameterAsSource(parameters, self.INPUT, context)
        (sink, dest_id) = self.parameterAsSink(parameters, self.OUTPUT, context,
                                               source.fields(), source.wkbType(), source.sourceCrs())

        features = source.getFeatures(QgsFeatureRequest())
        for feat in features:
            out_feat = QgsFeature()
            out_feat.setGeometry(feat.geometry())
            out_feat.setAttributes(feat.attributes())
            sink.addFeature(out_feat, QgsFeatureSink.FastInsert)

        return {self.OUTPUT: dest_id}
This script just copies the features of the input layer to the output layer without any modifications. Add your logic to the processAlgorithm() function to get started.
Use Create New Script from the Toolbox toolbar:
Paste the example script:
Once saved, the script will show up in the Processing toolbox:
Joining polygon attributes to points based on their location is a very common GIS task. In QGIS 2, QGIS’ own implementation of “Join attributes by location” was much slower than SAGA’s “Add polygon attributes to points”. Thus, installations without SAGA were out of good options.
Luckily this issue (and many more) has been fixed by the rewrite of many geoprocessing algorithms for QGIS 3! Let’s revisit the comparison:
I’m using publicly available datasets from Naturalearth: The small scale populated places (243 points) and the large scale countries (255 polygons with many nodes). Turns out that QGIS 3’s built-in tool takes a little less than two seconds while the SAGA Processing tool requires a litte less than six seconds:
 Like in the previous comparison, times were measured using the Python Console:
In both tools, only the countries’ SOVEREIGNT attribute is joined to the point attribute table:
import processing
t0 = datetime.datetime.now()
print("QGIS Join attributes by location ...")
processing.runAndLoadResults(
   "qgis:joinattributesbylocation",
   {'INPUT':'E:/Geodata/NaturalEarth/vector_v4/natural_earth_vector/110m_cultural/ne_110m_populated_places.shp',
   'JOIN':'E:/Geodata/NaturalEarth/vector_v4/natural_earth_vector/10m_cultural/ne_10m_admin_0_countries.shp',
   'PREDICATE':[5],'JOIN_FIELDS':['SOVEREIGNT'],
   'METHOD':0,'DISCARD_NONMATCHING':False,'OUTPUT':'memory:'})
t1 = datetime.datetime.now()
print("Runtime: "+str(t1-t0))
print("SAGA Add polygon attributers to points ...")
processing.runAndLoadResults("saga:addpolygonattributestopoints",
   {'INPUT':'E:/Geodata/NaturalEarth/vector_v4/natural_earth_vector/110m_cultural/ne_110m_populated_places.shp',
   'POLYGONS':'E:/Geodata/NaturalEarth/vector_v4/natural_earth_vector/10m_cultural/ne_10m_admin_0_countries.shp',
   'FIELDS':'SOVEREIGNT','OUTPUT':'C:/Users/anita/AppData/Local/Temp/processing_8b1bbde78de5490285dd530e115cca52/099660d88bf14c54a853cc230e388e55/OUTPUT.shp'})
t2 = datetime.datetime.now()
print("Runtime: "+str(t2-t1))
It is worth noting that it takes longer if more attributes are to be joined to the point layer attribute table. For example, if the JOIN_FIELDS parameter is empty:
'JOIN_FIELDS':[]
instead of
'JOIN_FIELDS':['SOVEREIGNT']
then the the Join attributes by location takes almost 16 seconds. (The country layer contains 71 attributes after all.)
(The SAGA tool currently allows only joining one attribute at a time.)
Recently I was invited by the colleagues from OpenGIS.ch to lend a hand in a training session about QGIS server.
This was a good opportunity to update my presentation for QGIS3, to fix a few bugs and to explore the powerful capabilities of QGIS server and Python.
As a result, I published the full recipe of a Vagrant VM on github: https://github.com/elpaso/qgis3-server-vagrant
The presentation is online here: http://www.itopen.it/bulk/qgis3-server/
What’s worth mentioning is the sample plugins (I’ll eventually package and upload them to the official plugin site):
The VM uses 4 different (although similar) deployment strategies:
Have fun with QGIS server: it was completely refactored in QGIS 3 and it’s now better than ever!
The post QGIS 3 Server deployment showcase with Python superpowers first appeared on Open Web Solutions, GIS & Python Development.
Sorry, this entry is only available in the Dutch language
Do you want to share your GPS data from your phone to QGIS?
Here is how:
QGIS comes with a core plugin named GPS Tools that can be enabled in the Plugin installer dialog:
 There are several ways to forward data from your phone and most of them are very well described in the QGIS manual page: https://docs.qgis.org/testing/en/docs/user_manual/working_with_gps/plugins_gps.html
What I’m going to describe here is mostly useful when your phone and your host machine running QGIS are on the same network (for example they are connected to the same WiFi access point) and it is based on the simple application GPS 2 NET
Once the application is installed and started on your phone, you need to know the IP address of the phone, on a linux box you can simply run a port scanner and it will find all devices connected to the port 6000 (the default port used by GPS 2 NET):
# Assuming your subnet is 192.168.9

nmap -p 6000 192.168.1.*

Nmap scan report for android-8899989888d02271.homenet.telecomitalia.it (192.168.99.50)
Host is up (0.0093s latency).
PORT STATE SERVICE
6000/tcp open X11
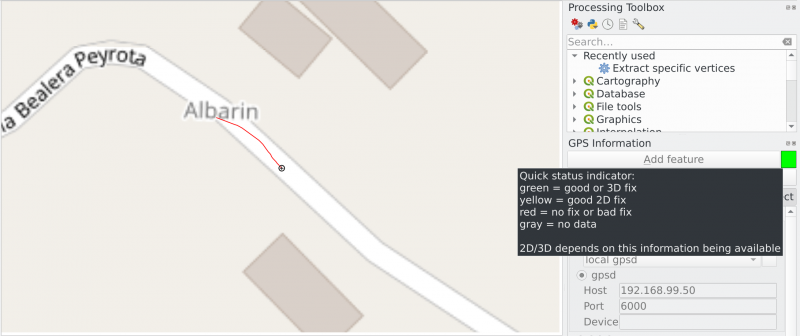
Now, in QGIS you can open the plugin dialog through Vector -> GPS -> GPS Tools and enter the IP address and port of your GPS device:
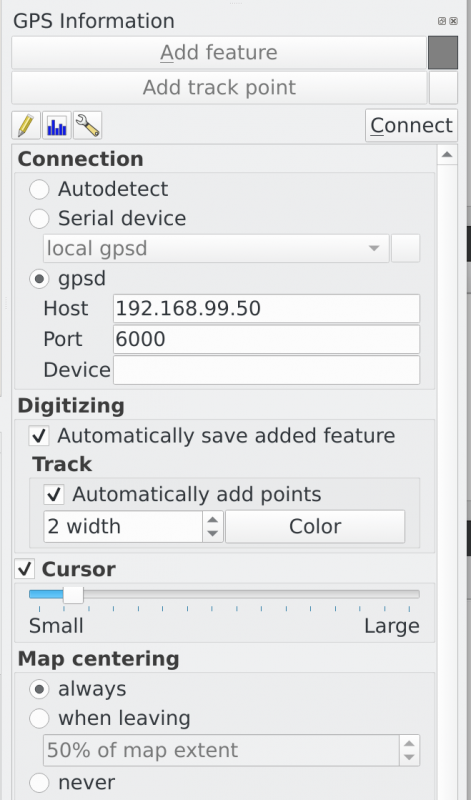 Click on Connect button on the top right corner (mouse over the gray square for GPS status information)
Start digitizing!
The post Use your android phone’s GPS in QGIS first appeared on Open Web Solutions, GIS & Python Development.