Related Plugins and Tags

QGIS Planet

Colour shortcuts in QGIS 2.4

Quick poll… what’s the most frustrating thing about GIS? Fighting with colour plotters? Trying to remember GDAL command line syntax? MapInfo’s new ribbon interface* [1]? All of the above?

Wrong!

It’s getting a colour from here:

colour1

…all the way over to here:

colour2

Since the dawn of GIS humanity has struggled with this simple task* [2]. We’ve come up with multiple techniques for solving this problem, ranging from the RSI inducing “select and copy red value, alt-tab, paste, alt-tab, select and copy green value, alt-tab, paste, etc….” method, through to chanting “70, 145, 160… 70, 145, 160… 70, 145, 150… 70, 145, 150” to ourselves as we frantically try and rearrange dialogs to find the destination colour picker, all the while avoiding strange looks from co-workers.

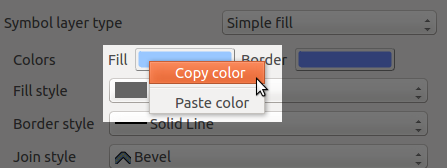
Fortunately, QGIS 2.4 is coming to the rescue! Now, you can right click on any of QGIS’ colour picker buttons for a handy copy/paste colour shortcut menu. Pasting colours works from a whole range of formats, including hex codes, color names, and css-style “rgb” and “rgba” strings.

Fixed!

Problem solved!

Even better, you can just drag colours from one colour button to another:

Fixed again...

… and solved again…

Or, drag a colour from GIMP and drop it onto a QGIS colour button:

x

… and yet again!

Or even drag a colour from a QGIS button directly onto a shape in Inkscape! All this win is coming your way in QGIS 2.4, due June 2014.

[1] Pre-empting the inevitable flood of complaints when this new interface is rolled out
[2] I assume

And now… colour preview modes in QGIS’ map canvas

As a quick follow-up to my last post on colour preview modes for the print composer in QGIS 2.4, this feature has also been added to the main map canvas window! Now it’s even easier to adjust your symbol colours and immediately see how they’d appear under a range of different circumstances:

Colour previews modes for the map canvas

Colour previews modes for the map canvas


Colour blindness and grayscale previews in QGIS 2.4

Since QGIS 2.4 is nearing feature freeze it seems like a good time to start exploring some of the great new features in this release. So, let’s get started with my most recent addition to QGIS’ print composer… preview modes!

As every first year cartography text book will tell you, it’s important to know your target media and audience when creating a usable map. Some important considerations are whether or not your map will be photocopied or printed in black and white, and whether you need to consider colour blind map readers in your audience. In the past, designing maps with these considerations has been a time consuming, tedious process. You’d have to export your map, open it in another graphics editing program, apply some colour transform, work out what issues there are, flip back to QGIS, make your changes and repeat. If you’re working with a tight deadline it can be difficult to justify the time this all takes.

QGIS 2.4 will help to make this whole process a lot simpler. In the print composer there’s now an option to enable a number of different live “preview modes“. These include grayscale, monochrome, and two colour blindness simulations (Protanope and Deuteranope).

Composer preview modes in QGIS 2.4

Composer preview modes in QGIS 2.4

These preview modes are live, so you can continue to edit and tweak the colours in your composition while a preview mode is active! For a quick demonstration, let’s start with this creatively coloured thematic map:

bad_colored_map

While it might not be the most aesthetically pleasing map, at least the thematic colours can be easily matched to their corresponding values in the legend. Let’s see what would happen if we photocopied this map. This is as easy as activating the “Simulate photocopy (grayscale)” preview mode:

greyscalepreview

Hmm… not so usable now. The five thematic colours have been reduced to just three discernible colours. Oh well, at least we haven’t had to export our map to find this out, and it’s nice and easy to adjust the colours and composition to work for photocopies without having to leave QGIS to test the results!

Let’s see how this map would look to someone with colour blindness, by activating the “Simulate colour blindness (Protanope)” mode:

color_blindness

In this case, our map isn’t too bad. The different classes are still discernible and the map can be interpreted by someone with protanopia.

So there we have it – now it’s easy to determine how our map outputs will look under different circumstances and adjust them to suit! Composer preview modes will be a part of the upcoming 2.4 release of QGIS, which is due out at the end of June 2014.

Update:

This feature has also been added to the main map canvas.

GDAL/OGR 1.11.0 released

The new version 1.11.0  of GDAL/OGR (http://www.gdal.org/) which offers major new features has been released. GDAL/OGR is a C++ geospatial data access library for raster and vector file formats, databases and web services.  It includes bindings for several languages, and a variety of command line tools.

Highlights:

More complete information on the new features and fixes in the 1.11.0 release can be found at http://trac.osgeo.org/gdal/wiki/Release/1.11.0-News

The new release can be downloaded from:

The post GDAL/OGR 1.11.0 released appeared first on GFOSS Blog | GRASS GIS Courses.

Composition styling in QGIS 2.2

Here’s a quick run-down on some new feature in QGIS 2.2 which I never got around to writing about before the release. I feel like I’ve got to give these features their due publicity before moving on to all the exciting new stuff which is being added for 2.4. So, without further ado, let’s take a dive into print composer shape and page styling in QGIS 2.2…

Shape styling

It’s no secret that QGIS has pretty impressive capabilities when it comes to cartographic styling of polygon features. Everything from line and point pattern fills, SVG image fills, gradients and even buffered gradients (new in 2.4 — more on that in a later post) can be used to shade polygons. That’s all in addition to the whole range of line styles which can be used to outline the edges of polygons. In QGIS 2.2 all these fill effects are now available for styling shapes in the print composer. What exactly does this mean?

Well, now you can draw a frame onto your print layout and style it with a gradient fill…

Gradient shape fill in composer

…or a line pattern fill….

Line pattern fill in composer

…or some crazy combination of everything…

Advanced fill in composer

It’s totally up to you how far you take this! Here’s a nice example of a map created in QGIS 2.2’s print composer using these new styling options.

Page styling for compositions

Why is this cool? Well, for a start, if we take a quick look at the QGIS map showcase on Flickr very few of the maps shown there have a white background. In previous versions of QGIS achieving a non-white background would require drawing a giant coloured rectangle over your whole composition, banishing it to the back of the stack, and then continually being annoyed by it getting in the way while you tried to work on the rest of the composition. Now, just like the shape styling described above, you can style the page background using any of the available options in QGIS for polygon fills!

Creating a composition with a black page background

Creating a composition with a black page background

It doesn’t end there though. Since the page background can now be styled like this, it’s also possible to have transparent or semi-transparent page backgrounds. I’ll show the result opened here in GIMP so that you can see the full transparency effect over GIMP’s checkerboard background pattern:

A composition exported with a transparent background

A QGIS 2.2 composition exported with a transparent background

Using a transparent composition background like this also allows for transparency effects in map layers to show through – so, for instance, if your map layer is set to 50% transparent then the resultant export from the composer will also be 50% transparent.

And now for the final stinger…

Have I mentioned yet that you can also use data defined symbology for both shape and page styling? No? Well, this was actually my main motivator in adding styling support to these elements. For a long time I’ve been wanting to create atlases which vary the page background based on attributes in the atlas coverage layer. Think flip-book style maps, where the page border is colour-coded to highlight areas that need attention. For example, areas with high rates showing with red borders, average rates with yellow, and low rates with green borders. Using a combination of page and shape styling, data defined symbology, and QGIS’ atlas features, this is now possible!

…And that (belatedly) wraps up my exploration of new features in QGIS 2.2. Next up I’ll start showcasing all the sweet new features which have landed for 2.4…

Workshop at FOSS4G 2014: Spatio-temporal data handling and visualization in GRASS GIS 7

Drowning in too many maps? Have some fun exploring fascinating geometries of changing landscapes in Space Time Cube and creating 2D and 3D animations from time series of geospatial data. Learn about the new capabilities for spatio-temporal data handling in GRASS GIS 7 (http://grass.osgeo.org/grass7/) and explore various techniques for dynamic visualizations.

First, we will introduce you to GRASS GIS 7, including its spatio-temporal capabilities and you will learn how to manage and analyze geospatial data time series. Then, we will explore new tools for visualization of spatio-temporal data. You will create both 2D and 3D dynamic visualizations directly in GRASS GIS 7. Additionally, we will explain the Space Time Cube concept using various applications based on raster and vector data time series. You will learn to manage and visualize data in space time cubes (voxel models). No prior knowledge of GRASS GIS is necessary, we will cover the basics needed for the workshop. All relevant material including an overview of the tools and hands-on practical instructions along with the sample data sets will be available on-line. And, by the way, GRASS GIS is a free and open source geographic information system (GIS) used for geospatial data management, analysis, modeling, image processing, and visualization which runs on Linux, MS Windows, Mac OS X and other systems.

Presenters: Vaclav Petras, Anna Petrasova, Helena Mitasova, Markus Neteler

When:  FOSS4G 2014, Sept 8th-13th 2014, Portland, OR, USA

Register at: https://2014.foss4g.org/schedule/workshops/#wshop-526

The post Workshop at FOSS4G 2014: Spatio-temporal data handling and visualization in GRASS GIS 7 appeared first on GFOSS Blog | GRASS GIS Courses.

OSGeo Code Sprint, Vienna

This is how OSGeo happens.  These are the folk who bring us a lot of that open-source geo-spatial goodness. You can follow the code sprint on Twitter using the hashtags #csprint and #viennacodesprint14


Two book recommendations

I recently finished reading two books which may be of interest to open-source GIS users – “PostGIS Cookbook” and “The PyQGIS Programmer’s Guide“, both of which I highly recommend:

PostGIS Cookbook

PostGIS CookbookI’ve been a fan of Stephen Mather’s blog for a while now, and have consistently found it to be a great source of trustworthy information and creative solutions to GIS problems. So when I first saw mention of his work on the PostGIS Cookbook I knew it would be a must-read for me. PostGIS is an essential part of my daily toolkit, and I’ll quickly devour any tutorial or guide which can lead me to better ways to put it to use. And that’s exactly what this book is! It’s full of tips and guides which has inspired me in a lot of techniques I’d never tried or even thought possible in PostGIS.

It’s important to point out that this book isn’t a training manual or beginner’s guide to PostGIS. It assumes readers are already familiar with using PostGIS and have a good understanding of GIS software in general. (If you’re looking for a book to start from scratch with PostGIS, PostGIS in Action is a better fit). I think that’s really what makes this book stand out though. There’s currently not a lot of books available covering PostGIS, and as far as I’m aware the PostGIS Cookbook is the only book available which is targeted to experienced PostGIS users.

Highlights for me are:

  • A great explanation and write up on optimised KNN filtering in PostGIS (something which often trips me up)
  • The detailed guide to topologically correct simplification of features
  • The exploration of PgRouting, which is a great introduction to PostGIS’ routing abilities
  • The “PostGIS and the web” chapter – I really wasn’t expecting this, but it’s quite eye opening (I’m going to have to do some digging into GeoDjango sometime)

The only criticism I have with this book is that it jumps around a lot between operating systems. While most of the code is provided for both Linux/OSX and Windows, there’s occasional examples which only have code for one specific operating system. It’s a little jarring and assumes the user is well versed in their particular operating system to workaround these omissions.

Overall, I strongly recommend the PostGIS Cookbook, and would consider it a must have for anyone serious about expanding their PostGIS abilities. (Also, looks like the publisher, Packt, have a two-for-one sale going at the moment, so it’s a good time to grab this title).

The PyQGIS Programmer’s Guide

The PyQGIS Programmer's GuideThe second book I’ve just finished reading is Gary Sherman’s “The PyQGIS Programmer’s Guide“. For those who are unaware, Gary was the original founder of QGIS back in 2002, so you can be confident that he knows exactly what he’s writing about. In The PyQGIS Programmer’s Guide  Gary has created an in-depth guide on how to get started with programming for QGIS using python. It takes readers all the way from simple scripts right through to developing QGIS plugins and standalone applications based on the QGIS API.

This book fills an important void in the literature available for QGIS. Previously, the PyQGIS Developer Cookbook was the only available guide for QGIS python scripting, and unfortunately it’s a little out-of-date now. PyQGIS scripting can be a steep learning curve and that’s why this book is so appreciated.

It would be valuable to have some python knowledge and experience prior to reading this book. While the “Python Basics” chapter quickly runs through an introduction to the language, the book makes no claims to be a comprehensive python tutorial. But if you’ve dabbled in the language before and have familiarity with the python way of doing things you’ll easily be able to follow along.

Highlights are:

  • The “Tips and Techniques” chapter, which is a great mini-reference for performing a range of common tasks in PyQGIS (including loading layers, changing symbol styles, editing feature attributes, etc).
  • A complete tutorial for creating a QGIS plugin
  • A guide to debugging PyQGIS code and plugins

I’d definitely recommend that anyone who wants to get started with PyQGIS start with Gary’s work – you’ll find it the perfect place to begin.

OSGeo-Live 7.9 Released

OSGeo today announced that the OSGeo-Live GIS software collection version 7.9 has been released, featuring more than fifty open source, standards compliant geospatial desktop applications, web applications and frameworks.

Release Highlights:
This release is a modernization update to last year’s 7.0 release including new versions of the software but preserving much of the core build and operating system. In addition we’ve added a number of small fixes and updated document translations.

OSGeo-Live Lightning Presentation:
The OSGeo-Live Lightning Presentation which explains the breadth of OSGeo software is now bundled with OSGeo-Live. It is often presented by conference organisors, or keynote speakers. The presentation may be given as is, or modified to align with time constraints, presenter’s interest, or conference focus. http://live.osgeo.org/livedvd/docs/en/presentation/

Applications:
Twenty two geospatial programs have been updated to newer versions. The core geospatial stack has also been upgraded from UbuntuGIS, and the base operating system has been updated to Xubuntu 12.04.4 LTS, including all the latest security and bug fixes, and web browser updates.

About OSGeo-Live:
OSGeo-Live is a self-contained bootable DVD, USB flash drive and Virtual Machine based upon Ubuntu Linux. OSGeo-Live is pre-configured with a wide variety of robust open source geospatial software. All applications can be trialled without installing anything on your computer, simply by booting the computer from a DVD or USB drive, or running in a Virtual Machine environment. Each featured package is accompanied by both a publication quality one page descriptive summary and a short tutorial on how to get started using it. http://live.osgeo.org

OSGeo-Live includes:

  • Over sixty quality geospatial Open Source applications installed and pre-configured
  • Free world maps and geodata
  • One page overview and quick start guide for every application
  • Overviews of key OGC standards
  • Translations to multiple languages

Credits
Over 180 people have directly helped with OSGeo-Live packaging, documenting and translating, and thousands have been involved in building the packaged software. Developers, packagers, documenters and translators include:
Activity Workshop, Agustín Dí­ez, Aikaterini Kapsampeli, Alan Beccati, Alan Boudreault, Alessandro Furieri, Alexander Bruy, Alexander Kleshnin, Alexander Muriy, Alexandre Dube, Alexey Ardyakov, Alex Mandel, Amy Gao, Andrea Antonello, Andrea Yanza, Andrey Syrokomskiy, Andry Rustanto, Angelos Tzotsos, Anna Muñoz, Antonio Falciano, Anton Novichikhin, Anton Patrushev, Argyros Argyridis, Ariel Núñez, Assumpció Termens, Astrid Emde, Barry Rowlingson, Benjamin Pross, Brian Hamlin, Bruno Binet, Bu Kun, Cameron Shorter, Christophe Tufféry, Christos Iossifidis, Cristhian Pin, Damian Wojsław, Dane Springmeyer, Daniel Kastl, Daria Svidzinska, David Mateos, Denis Rykov, Diego González, Diego Migliavacca, Dimitar Misev, Dmitry Baryshnikov, Dominik Helle, Edgar Soldin, Eike Hinderk Jürrens, Elena Mezzini, Eric Lemoine, Erika Pillu, Estela Llorente, Etienne Delay, Etienne Dube, Evgeny Nikulin, Fran Boon, François Prunayre, Frank Gasdorf, Frank Warmerdam, Friedjoff Trautwein, Gavin Treadgold, Giuseppe Calamita, Grald Fenoy, Grigory Rozhentsov, Guy Griffiths, Hamish Bowman, Haruyuki Seki, Henry Addo, Hernan Olivera, Howard Butler, Hyeyeong Choe, Ian Edwards, Ian Turton, Ilya Filippov, Jackie Ng, Jan Drewnak, Jane Lewis, Javier Rodrigo, Javier Sánchez, Jesús Gómez, Jim Klassen, Jing Wang, Jinsongdi Yu, Jody Garnett, Johan Van de Wauw, John Bryant, Jorge Arévalo, Jorge Sanz, José Antonio Canalejo, José Vicente Higón, Judit Mays, Klokan Petr Pridal, Kristof Lange, kuzkok, Lance McKee, Lars Lingner, Luca Delucchi, Lucía Sanjaime, Mage Whopper, Manuel Grizonnet, Marc-André Barbeau, Marco Curreli, Marco Puppin, Marc Torres, Margherita Di Leo, Maria Vakalopoulou, Mario Andino, Mark Leslie, Massimo Di Stefano, Matthias Streulens, Mauricio Miranda, Mauricio Pazos, Maxim Dubinin, Michaël Michaud, Michael Owonibi, Micha Silver, Mike Adair, Milena Nowotarska, M Iqnaul Haq Siregar, Nacho Varela, Nadiia Gorash, Nathaniel V. Kelso, Ned Horning, Nobusuke Iwasaki, Oliver Tonnhofer, Òscar Fonts, Otto Dassau, Pasquale Di Donato, Patric Hafner, Paul Meems, Pavel, Pedro-Juan Ferrer, Pirmin Kalberer, Raf Roset, Regina Obe, Ricardo Pinho, Roald de Wit, Roberta Fagandini, Roberto Antolin, Roberto Antolí­n, Roger Veciana, Ruth Schoenbuchner, Samuel Mesa, Scott Penrose, Sergey Grachev, Sergio Baños, Simon Cropper, Simon Pigot, Stefan A. Tzeggai, Stefan Hansen, Stefan Steiniger, Stephan Meissl, Steve Lime, Takayuki Nuimura, Thierry Badard, Thomas Baschetti, Thomas Gratier, Tom Kralidis, Toshikazu Seto, Trevor Wekel, Valenty González, Vera, Xianfeng Song, Yoichi Kayama, Zhengfan Lin

Sponsoring organisations

  • The Open Source Geospatial Foundation OSGeo provides the primary development and hosting infrastructure and personnel for the OSGeo-Live project, and infrastructure for many of the software projects themselves. http://osgeo.org
  • LISAsoft provides sustaining resources and staff toward the management and packaging of software onto the Live DVD. http://www.lisasoft.com
  • Information Center for the Environment (ICE) at the University of California, Davis provides hardware resources and development support to the OSGeo Live project. http://ice.ucdavis.edu
  • Remote Sensing Laboratory at the National Technical University of Athens, provides hardware resources and development support to the OSGeo-Live project. http://www.ntua.gr
  • The DebianGIS and UbuntuGIS teams provide and quality-assure many of the core packages. http://wiki.debian.org/DebianGis and https://wiki.ubuntu.com/UbuntuGIS

The post OSGeo-Live 7.9 Released appeared first on GFOSS Blog | GRASS GIS Courses.

Atlas previews in QGIS 2.2
QGIS 2.2 includes some great additions to the map composer’s “Atlas” feature. If you’re not familiar with atlas prints they are QGIS’ equivalent of ArcGIS’s “data driven pages”, or something like a map based version of Microsoft Word’s “mail merge”. In an atlas composition you can select one of your map layers to use as a “coverage layer“, and QGIS will automatically generate multiple pages from the composition with each page highlighting a different feature from this coverage layer.

Atlas Previews

Thanks to funding from SIGE, I’ve added some useful new features to QGIS’ atlas abilities for 2.2. The first of these is the ability to preview atlas compositions before printing them. In QGIS 2.0, atlas generation took a bit of guess work. You’d set up the parameters for the atlas, then export the whole atlas in one shot and just hope you’d got the settings right. If not, you’d have to tweak the settings and export the whole lot again to see the result. But not any more! Now, in QGIS 2.2, you can switch on a live atlas preview mode by clicking “Preview Atlas” in the new atlas preview toolbar:

The new atlas preview toolbar

The new atlas preview toolbar

The composer window will switch to showing you a preview of exactly how the atlas will look when exported. You can tweak the appearance of any layout item, adjust the atlas and map parameters, or experiment with the new options for atlas feature styling to see instantly what the final export will look like.

The composer window in atlas preview mode

The composer window in atlas preview mode (complete with gratuitous use of label rotation and rounded rectangles…) 

When this Atlas Preview mode is enabled, you navigate through all the features in the coverage layer by clicking any of the navigation buttons in the atlas preview toolbar:

Navigating the atlas preview

Navigating the atlas preview

While previewing you can export individual pages from the atlas. So, if just one or two pages in your atlas need to be individually tweaked you can do that as you step through the features. A neat thing with this is that you can make temporary tweaks to the extent and scale of the map items as you go, without affecting how the rest of the atlas maps look.

(Oh, by the way, I should mention that as an added bonus QGIS 2.2 lets you control more than one map with an atlas print!)

Selecting the current atlas feature

The second part of the work funded by SIGE was creation of shortcut actions for selecting the current atlas feature. If your atlas coverage layer has many records it may not be practical to step through the atlas previews one at a time until you find a specific feature. That’s where these new shortcut actions come in handy!

There’s a few ways of jumping directly to a specific atlas feature. The first is to open a browser window for your coverage layer, then right click a row and choose “Set as atlas feature for …“:

Setting the atlas feature from the browser window

Setting the atlas feature from the browser window

Selecting this menu item will cause the composer to immediately jump to the matching atlas row. Another way of selecting the current atlas feature is to use the “Set as atlas feature” map action. You activate this by first selecting your coverage layer in the layers panel, then clicking the “Run Feature Action” tool button and selecting “Set as atlas feature…“:

The set atlas feature map action

The set atlas feature map action

The mouse cursor will change to a cross-hair, and clicking any matching feature in the map window will cause the composer atlas preview to jump straight to that feature. Lastly, you can also activate the “Set as atlas feature” action directly from the identify results window.

That’s just a small taste of some of the new atlas creation features which will be available in QGIS 2.2, coming your way by the end of February 2014!

(One last note – as mentioned, this work was kindly sponsored by SIGE. If there’s a specific composer based feature or bug you’d like me to work on, I’m available for further sponsored work. Just contact me directly for details.)

QGIS – Two neat features in 2.2

Here’s a quick run-down on two nice new styling options which I’ve recently added to QGIS 2.2.

Map styling for compositions

This little feature was suggested by Mathieu Pellerin, who is always pushing the boundaries of QGIS’ cartographic tools and coming up with great ideas for new styling features (you can check out some of his work via Flickr). Mathieu’s idea was for a new ‘$map‘ variable for the expression builder. This variable holds the id of the map item which is drawing the map, and allows for some nice tweaking of maps in the composer.

The $map variable is most useful when you have more than one map in your composition. The example below shows $map being used to change the styling of a single layer from the main map to the smaller inset map:

Using $map to style two maps with different colours

Using $map to style a single layer in two maps with different colours

In this example the composition has two maps, the larger has an id of “main_map” and the smaller has “inset_map“. The boundary layer has been styled using the rule based renderer, with one rule for $map=’main_map’ and one for $map=’inset_map’, as shown below:

Rule based rendering using the $map variable

Rule based rendering using the $map variable

The end result is that the layer will be rendered using the two different styles depending on which composer map item it is being drawn into. This trick can also be used to tweak labelling rules between the maps. In the example above I’ve restricted the labelling to only show in the main map. This is achieved by setting an expression for the data defined “Show label” property. I’ve used the expression “$map=’main_map’” so that labels are only shown in the main map and not the smaller inset map.

Tweaking label settings using the $map variable

Tweaking label settings using the $map variable

This small addition to QGIS 2.2 allows for some rather powerful improvements to multi-map compositions!

Drawing polygon borders only inside the polygon

The second new feature I wanted to highlight is a new option for polygon outlines which causes the outline to be drawn only on the inside of a polygon feature. The usual behaviour is for outlines to be drawn directly over the centre of the feature boundary, so that half of the outline is drawn inside the feature and half on the outside.

Simple Line Fill before

This means that the outline in a simple line symbol layer overlaps into the neighbouring polygons, and the result is that outlines from these features blend together:

Shaded borders pre QGIS 2.2

Shaded borders pre QGIS 2.2 – see how the colours bleed into the neighbouring features and overlap

This looks like a big muddy mess. A feature I’ve wanted for a long time is the ability to restrict these outlines so that they are only drawn inside the feature. This effect is commonly seen in world atlases and National Geographic maps, where each neighbouring country is shaded with it’s own unique outline colour. Now it’s possible to do this in QGIS just by ticking a single box!

The new "Draw line only inside polygon" option

The new “Draw line only inside polygon” option

As you can see in the above image, the simple line outline style has a new checkbox, “Draw line only inside polygon“. Ticking this box will clip the outline so that only the portion of it which falls inside the feature is rendered. Here’s the result:

Shaded borders with "Draw line only inside polygon" checked

Shaded borders with “Draw line only inside polygon” checked

So much nicer then the earlier output – now none of the borders overlap into their neighbouring regions! Ok, so it is possible to achieve a similar result by creating a specially crafted layer consisting of negatively buffered polygons subtracted from the original polygons, but this takes a lot of fiddling around. It also has the major disadvantage in that the result is scale dependant, and zooming in or out of the map will alter the size of the polygon outlines. But using this wonderful new checkbox in QGIS, we get proper scale-independent borders, and zooming in or out of the map keeps a consistent border width!

Zooming in keeps a consistent border width...

Zooming in keeps a consistent border width…

So there we go – two small new features added in QGIS 2.2 which have huge potential for your cartographic outputs! As per usual, if you come up with some fancy way of utilising these, don’t forget to add your maps to the QGIS Showcase on Flickr.

Waiting for QGIS 2.2 – Composer Improvements (part 3)

Following on from parts 1 and 2, here’s some more composer changes which are coming in QGIS 2.2

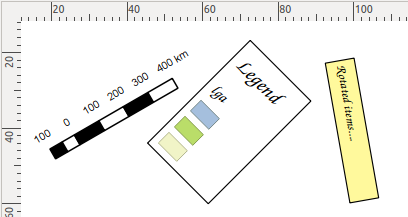
  • Rotation support for all composer item types. Now anything you draw in a composer can be rotated, including scale bars, legends, attribute tables and html frames! Rotation of text labels has also been improved by making the border and background of labels respect the rotation of the label.
Every composer item can now be rotated...

Every composer item can now be rotated…

  • Resizing of rotated items has been improved. Now it’s possible to easily resize rotated items while keeping their correct shape. (There’s still one missing ingredient for complete support here – shear/perspective transforms. Unfortunately this will probably have to wait till 2.4).
Better resizing of rotated items

Better resizing of rotated items

  • Rulers can be shown or hidden in compositions
  • The ruler appearance has been tweaked, adding smaller divisions and better text placement
The ruler appearance has been tweaked

New tweaked appearance for rulers

  • A zoom to actual size button and short cut (Ctrl + 1) have been added
Zoom to 100%

New Zom to 100% button

  • Lastly, the status bar has a new zoom combo box, which shows the current zoom level and allows for quick zoom to several predefined levels. You can also enter an exact zoom level in the box for precise control.
New zoom levels combo box in the status bar

New zoom levels combo box in the status bar

As you can see, the print composer in QGIS 2.2 just keeps getting better! There’s a few other really exciting new additions which have landed recently too, but they deserve their own blog posts. Stay tuned…

Waiting for QGIS 2.2 – Gradient Fills

One of the big features I worked on for QGIS 2.2 is gradient fill symbols for polygons. In my view QGIS’ symbol support is one of its biggest strengths — the versatility of its symbol layers coupled with the powerful data defined properties support allows for so many effects which just aren’t possible in other GIS packages. Gradient fill support is a nice addition to these features and should help make QGIS even more attractive to cartographers. In this post I’m going to give a quick run through of how gradient fills work in QGIS, and some of the options available for tweaking them.

Gradient fills are enabled through the Style tab in the properties for a vector layer. The default fill for a polygon in QGIS is “Simple fill”, so to switch a layer to a gradient fill you first need to select the “Simple fill” layer, then change the “Symbol layer type” dropdown  to “Gradient fill”:

Gradient Fill type

As you can see, there’s a lot of options in QGIS which can be tweaked for gradient fills. I’ll run through each of them now and explain a little bit about how each one can be used.

Colour modes

QGIS supports two different types of colour modes for gradient fills. The first is a simple “Two color” gradient, where the colour smoothly blends from the first colour to the second. The second mode, “Color ramp” allows you to use any of the standard or user-defined QGIS colour ramps, which can consist of multiple colour stops:

Colour options in gradient fills

Colour options in gradient fills

So, when would you use these options? Well, any time you need more than two colours or need to tweak the position of any of the colours in the gradient you’ll have to use a colour ramp.  If instead you’re just wanting a quick-and-easy gradient then the two colour option might be more suitable.

One last important distinction is that the colours in a two colour gradient can be set using a data defined expression:

Data defined gradient colours

Data defined gradient colours. Please try to use them more tastefully then this!

Gradient types

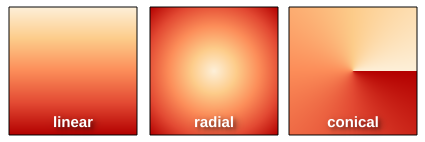
The next option for gradient fills is rather self-explanatory: gradient types. QGIS supports linear, radial and conical gradients:

Gradient types

Coordinate modes

The coordinate mode option is a little trickier to explain. The default setting, “Object“, will cause the gradient to be drawn entirely within each separate feature. You can see in the example below that every lake feature is coloured with a gradient which starts with light blue in the top left and darkens to a deeper blue in the bottom right. This gradient fill is repeated for all the lake features:

Gradient object coordinate mode

The “Object” coordinate mode for gradient fills

In contrast, the “Viewport” coordinate mode causes the gradient to be drawn across the entire current view of the map. So only the lakes in the top left of the map are drawn with the light blue colour, and the lakes in the bottom right with the deeper blue:

Gradient "viewport" coordinate mode

The “Viewport” coordinate mode for gradient fills

The choice of coordinate mode will depend entirely on your cartographic desires for your map!

Reference points

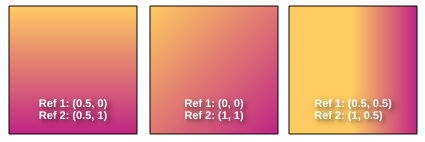
QGIS gradient fills allow the setting of two “reference points“. These points control where the gradient fill begins and ends. It’s easiest to visualise how these work by imagining a square defined by the points (0, 0) in the top left and (1, 1) in the bottom right. The two reference points fall somewhere within this square. So, the default reference points of (0.5, 0) and (0.5, 1.0) represent points mid way along the top edge and and the bottom edge, respectively.

Now imagine that this square forms the bounding box for the feature being drawn (or the current map window, if in “viewport” coordinate mode). The default reference points mean that the gradient will be drawn from the middle of the top edge to middle of the bottom edge of the feature. Reference points of (0, 0) and (1, 1) would mean the gradient is drawn from the top-left to the bottom-right. Similarly, reference points of (0.5, 0.5) to (1.0, 1.0) would draw a gradient from the middle of the feature to the bottom right (good for radial gradients).

Example gradient reference points

There’s also the option to set either of the reference points as the feature centroid, which again can come in handy for radial or conical gradient types.

Gradient spread

If you’ve got your head around the reference points concept, then the next setting for gradient fills affects how the gradients spread. This takes effect whenever a gradient starts or ends before the bounds of the feature. The default setting of “pad” means that the gradient will simple “pad” out any extra space with the start or end gradient colour:

Gradient "pad" spread

“Pad” spread – notice how the darker blue is stretched across the right side of each feature

Repeat” mode will tile the gradient across the feature:

Gradient "repeat" spread

“Repeat” spread

Finally, “reflect” mode will draw a reflected version of the gradient to fill up any extra space:

"Reflect" spread

“Reflect” spread

Angle

Last of all, there’s a simple “angle” parameter, which allows you to rotate the entire gradient fill. This option is included mostly for use with data defined symbols, since a similar effect can be achieved by changing the gradient reference points. Amongst other effects, this is useful for achieving a “sun glint” on water, where each gradient is drawn in a random direction (more on this in a later blog post):

Data defined gradient angles

Random data defined gradient angles

This leads me into my final note… all of these properties can be data defined! So you could have a column in your data controlling whether each feature is drawn with a radial or linear gradient, or whether the gradient in a given feature should be drawn at a specific angle, or that the gradient in a feature should start at the centroid and end at the top right of the feature!

I’m excited to see what the QGIS user community is able to create using this new gradient fill feature when 2.2 is released. If you’ve already had a chance to play with the dev version of 2.2 and have something to show off, make sure you submit your map to the Flickr QGIS Map Showcase!

Video: GRASS GIS development visualization from 1999 to 2013

Watch how the community based GRASS GIS 6.4 software development evolved! You can see how the individual contributors modify and expand the source code:

  • Dec 29, 1999: GRASS GIS 5.0 is being stored in an online source code repository in December 1999…
  • Dec 02, 2000: The developers work on all parts of the code…
  • Jan 15, 2002: Working on the future GRASS GIS 5.1 release
  • Nov 25, 2002: Starting GRASS 5.1 development with code restructuring
  • Jun 14, 2004: GRASS GIS 5.7 released in June 2004
  • Nov 09, 2004: Source code restructuring to get a better directory layout (all other developers waiting…)
  • Nov 09, 2004: … thousands of files are modified in this operation …
  • Nov 10, 2004: All developers resume their activities after the restructuring
  • Jan 10, 2005: Preparing the GRASS GIS 6.0.0 release…
  • Apr 09, 2005: GRASS GIS 6.0.0 published, release branch being split off from trunk for easier maintenance
  • Feb 22, 2006: Release of GRASS GIS 6.0.2 and new source code refactoring startedApr 05, 2006: Heavy development activity in trunk (development branch) …
  • Oct 25, 2006: GRASS GIS 6.2.0 released in October 2006
  • Apr 10, 2007: Preparing the GRASS GIS 6.2.2 release…
  • Jun 16, 2007: GRASS GIS 6.2.2 released in June 2007
  • Nov 01, 2007: Raster and vector modules being actively maintained…
  • Apr 02, 2007: New graphical user interface development speeding up (wxGUI)
  • Feb 20, 2008: Copyright statements prettified in many files
  • May 31, 2008: New GRASS 6 development branch being split off from trunk (which becomes GRASS 7)
  • Jun 10, 2008: Developers moving over to new branch
  • Feb 23, 2009: GRASS 6.4 release branch split off from GRASS 6 development branch
  • Apr 03, 2009: GRASS GIS 6.4 preparations starting…
  • Feb 24, 2010: Intense maintenance in GRASS 6.4 release branch
  • Sep 15, 2010: GRASS GIS 6.4.0 released in September 2010
  • Apr 12, 2011: GRASS GIS 6.4.1 released in April 2011
  • Jun 27, 2011: GRASS GIS 6.4.svn matures for the upcoming 6.4.2 release
  • Aug 16, 2011: Intense maintenance in GRASS 6.4 release branch (GRASS GIS 7 development not shown here)…
  • Feb 19, 2012: GRASS GIS 6.4.2 released in February 2012
  • Nov 13, 2012: Backporting graphical user interface bugfixes from GRASS GIS 7 to GRASS GIS 6.4
  • Apr 17, 2013: Further maintenance in GRASS 6.4 release branch
  • Jul 10, 2013: Fixing odds ‘n ends for the new stable release
  • Jul 27, 2013: GRASS GIS 6.4.3 released in July 2013

The corresponding timeline is also available at
http://grass.osgeo.org/home/history/releases/

THANKS TO ALL CONTRIBUTORS!
http://grass.osgeo.org/development/

Rendering: Markus Neteler
Audio track editing: Duccio Rocchini & Antonio Galea

Music:
Le bruit peut rendre sourd – Track 6/18 Album “Sensation electronique” by Saelynh (CC-BY-NC-ND) http://www.jamendo.com/en/track/1236/le-bruit-peut-rendre-sourd

Software used:
Gource software: http://code.google.com/p/gource/ (GPL)
OpenShot video editor: http://www.openshotvideo.com/ (GPL

The post Video: GRASS GIS development visualization from 1999 to 2013 appeared first on GFOSS Blog | GRASS GIS Courses.

Waiting for QGIS 2.2 – Composer Improvements (part 2)

Following on from Part 1, here’s some more recent usability improvements which have been made to QGIS’ map composer:

  • Multiple items can now be selected by drawing a box around them. Holding Shift while drawing a box adds to the current selection, holding Ctrl will subtract from the current selection. In addition, holding Alt while drawing the selection box changes from an “intersects” style selection mode to a “within” selection mode. This was my major frustration with the composer in earlier versions of QGIS, and combined with the earlier fixes for multi-item drag and resize it substantially improves the design workflow.
Selecting multiple items with a mouse drag

Selecting multiple items with a mouse drag

  • Grid lines are always drawn on top of compositions
  • There’s new menu options for showing the grid and snapping to grid, and for showing/snapping/smart guides. All these have convenient keyboard shortcuts so you can quickly switch on or off display of the guides and grid or temporarily switch on or off snapping while you work. There’s also a new menu item for clearing all guides from a composition.
Grid and guide controls in the view menu

Grid and guide controls in the view menu

  • The composer window now has a status bar which shows the exact cursor position and details about resizing/moving items
The new composer status bar

The new composer status bar

  • A new mouse-based zoom tool has been added to the composer, which allows you to click and drag to specify an area to zoom to. You can also switch to this new tool at any time by holding Ctrl and space. Holding Shift while using the zoom tool switches to zooming out.

That’s it for now, but there’s loads more to come for 2.2!

50th ICA-OSGeo Lab established at Fondazione Edmund Mach (FEM)

We are pleased to announce that the 50th ICA-OSGeo Lab has been established at the GIS and Remote Sensing Unit (Piattaforma GIS & Remote Sensing, PGIS), Research and Innovation Centre (CRI), Fondazione Edmund Mach (FEM), Italy. CRI is a multifaceted research organization established in 2008 under the umbrella of FEM, a private research foundation funded by the government of Autonomous Province of Trento. CRI focuses on studies and innovations in the fields of agriculture, nutrition, and environment, with the aim to generate new sharing knowledge and to contribute to economic growth, social development and the overall improvement of quality of life.

The mission of the PGIS unit is to develop and provide multi-scale approaches for the description of 2-, 3- and 4-dimensional biological systems and processes. Core activities of the unit include acquisition, processing and validation of geo-physical, ecological and spatial datasets collected within various research projects and monitoring activities, along with advanced scientific analysis and data management. These studies involve multi-decadal change analysis of various ecological and physical parameters from continental to landscape level using satellite imagery and other climatic layers. The lab focuses on the geostatistical analysis of such information layers, the creation and processing of indicators, and the production of ecological, landscape genetics, eco-epidemiological and physiological models. The team pursues actively the development of innovative methods and their implementation in a GIS framework including the time series analysis of proximal and remote sensing data.

The GIS and Remote Sensing Unit (PGIS) members strongly support the peer reviewed approach of Free and Open Source software development which is perfectly in line with academic research. PGIS contributes extensively to the open source software development in geospatial (main contributors to GRASS GIS), often collaborating with various other developers and researchers around the globe. In the new ICA-OSGeo lab at FEM international PhD students, university students and trainees are present.

PGIS is focused on knowledge dissemination of open source tools through a series of courses designed for specific user requirement (schools, universities, research institutes), blogs, workshops and conferences. Their recent publication in Trends in Ecology and Evolution underlines the need on using Free and Open Source Software (FOSS) for completely open science. Dr. Markus Neteler, who is leading the group since its formation, has two decades of experience in developing and promoting open source GIS software. Being founding member of the Open Source Geospatial Foundation (OSGeo.org, USA), he served on its board of directors from 2006-2011. Luca Delucchi, focal point and responsible person for the new ICA-OSGeo Lab is member of the board of directors of the Associazione Italiana per l’Informazione Geografica Libera (GFOSS.it, the Italian Local Chapter of OSGeo). He contributes to several Free and Open Source software and open data projects as developer and trainer.

Details about the GIS and Remote Sensing Unit at http://gis.cri.fmach.it/

Open Source Geospatial Foundation (OSGeo) is a not-for-profit organisation founded in 2006 whose mission is to support and promote the collaborative development of open source geospatial technologies and data.

International Cartographic Association (ICA) is the world authoritative body for cartography and GIScience. See also the new ICA-OSGeo Labs website.

Waiting for QGIS 2.2 – Composer Improvements (part 1)

In the spirit of depesz’s “Waiting for Postgresql 9.#” series (and BostonGIS’ follow up Waiting for PostGIS 2.#), here’s the first in a new series of “Waiting for QGIS 2.2″ posts…

As I mentioned in my last post, one of my major goals for QGIS 2.2 is to make the print composer behave more like a professional DTP package. A big part of this is making sure QGIS respects all the expected standard behaviour for graphic design programs. While the print composer made huge advances toward this goal in version 2.0, there’s still further we can go.

So, let’s start with a list of all the new usability features the print composer has already gained for QGIS 2.2:

  • Selections of multiple items can all be moved and resized together (previously only one item in the selection would be altered)
  • Mouse handles are always drawn on the top of the composition – in earlier versions mouse handles could be hidden by items sitting higher in the composition
  • Holding shift while resizing items locks their aspect ratio
  • Holding control while resizing items causes them to resize from their centre
  • Holding shift while moving items locks the movement to the horizontal or vertical
  • Holding control while moving items temporarily disables any grid or guide-based snapping
  • Items can be removed from a selection by shift-clicking them
  • Control-clicking an item causes the next item below it to be selected – this allows you to select items which are hidden behind other items
  • Holding shift while moving items using the cursor keys results in a large item movement
  • There’s a new “Edit” menu in the composer, with options like
    • Select All/Select None and Invert Selection
    • Select Next Item Above and Select Next Item Below
    • Lock Selected Items and Unlock All
The new composer "Edit" menu

The new composer “Edit” menu

Additionally, there’s a bunch of pull requests which haven’t yet been merged to master, but are ready to go, including:

  • Adding a dedicated “pan” tool for dragging around compositions
  • Compositions can be panned at any time by holding the space key or middle mouse button
  • Compositions can be zoomed by using the mouse wheel
Composer pan tool

Composer pan tool

Some of these are simple little changes which don’t sound like much, but it’s not until you’re forced to work without something like shift-resizing to lock the aspect ratio that you realise how often you use it and rely on it!

Call for Papers FOSSGIS 2014 in Berlin

(reposting from here, Note to English speakers below)FOSSGIS Konferenz 2014 Berlin 19. - 21. März 2014

Sie forschen, Sie entwickeln, Sie beschäftigen sich mit Open-Source-Geo-Software oder freien Geodaten? Sie haben neue Ideen in diesem Themenbereich oder sind bereits dabei, freie Software und freie Geodaten zu nutzen oder zu entwickeln? Dann sind Sie auf unserer Konferenz – der FOSSGIS-Konferenz 2014 - genau richtig.

WIR BIETEN: Eine Plattform für Ihre Idee, Ihr Projekt, Ihren Erfahrungsbericht auf der größten deutschsprachigen Anwenderkonferenz für freie Geoinformationssysteme und freie Geodaten. Im Jahr 2014 findet die FOSSGIS vom 19. bis 21. März auf dem Gelände der Beuth Hochschule für Technik in Berlin statt. Wir rechnen mit über 400 Teilnehmern. An der Konferenz 2013 in Rapperswil (Schweiz) nahmen über ca. 350 Besucher teil.

WIR SUCHEN: Ihre Idee. Ihr Projekt. Ihren Erfahrungsbericht. Ihr Thema. Genauer gesagt, suchen wir Vorträge für Einsteiger und Fortgeschrittene, um spannende Themen zu behandeln, Diskussionen zu entwickeln, praxisorientierte Workshops* runden unser Programm ab. Vorträge zum Thema freie Geodaten, zum Beispiel OpenStreetMap, Open Data sind ebenso möglich wie Beiträge zu beispielsweise Softwarelösungen aus dem Bereich WebGIS, Desktop GIS, Geodatenbanken oder Location-Based-Services. Bewerben Sie sich jetzt mit einem Vortrag, Lightning Talk oder Workshop* beim Call for Papers.

ABSTRACT: Die Einreichung eines Abstracts für die FOSSGIS 2014 ist ab sofort bis zum 15. November 2013 über unsere Konferenzsoftware Pentabarf möglich. Beitrags-Einreichungen ohne Abstract müssen leider abgelehnt werden, da sich das Programm-Komitee anhand des Abstracts ein Bild von Inhalt und Relevanz des Beitrags macht. Der Abstract sollte ca. 1500 Zeichen umfassen. Ob die Einreichung angenommen wurde, wird im Dezember 2013 bekanntgegeben. Es besteht die Möglichkeit einen Lightning Talk einzureichen. Ein Lightning Talk ist eine kurze, knackige Auseinandersetzung mit einem Thema, welches in 5 Minuten, gern humorvoll, Anregung zur Diskussion bietet. Weiterhin können Poster eingereicht werden.

*Workshops: Bitte berücksichtigen Sie bei der Planung, dass für die Workshops nur 90 Minuten vorgesehen sind und die Teilnehmer ein Mix aus Theorie und vor allem Praxis erwarten. Die Beschreibung des Workshops soll erreichbare Lernziele und die notwendigen Vorkenntnisse der Teilnehmer enthalten. Ein Workshop findet ab einer Teilnehmerzahl von 5 statt.

WER WIR SIND: Veranstaltet wird die Konferenz vom FOSSGIS e.V., von der OSGeo Foundation und der Beuth Hochschule für Technik Berlin.

Unsere Konferenz lebt von Ihren Beiträgen und Ihrem Besuch. Werden Sie Teil der Konferenz – wir freuen uns auf Sie!

Noch Fragen? Wir haben versucht, in unseren FAQs alle wichtigen Fragen zu beantworten. Falls weitere Fragen bestehen, zögern Sie nicht uns eine E-Mail zu schreiben.

Note to English speakers

The FOSSGIS-conference is the largest German-language conference for Free and Open Source Software for GIS and Free Geodata hosting about 400 participants.

Today, the Conference Committee announced the “Call for papers” for 2014. Because the conference-language is German, the CfP is either.

The program committee will, however, also consider applications for talks or workshops held in English if they are deeemed to add to the quality of the conference. So if you don’t speak German, but are a FOSS/Open Data celebrity, or have a story that only you can tell, please do submit your talk. We are unlikely to be able to provide interpreters, but we’ll make sure you don’t get lost in Berlin. Please be aware that you can submit paper until November, 15. 2013. You can submit your abstract using our Conference Software.

We are looking forward to see you in Berlin March 19-21, 2014!

OSGeo Receives 501(c)(4) Tax Exempt Status

The Open Source Geospatial Foundation (OSGeo) is pleased to announce that the U.S. Internal Open Source Geospatial FoundationRevenue Service (IRS) has accepted their application (PDF) for non-profit status under section 501(c)(4) of the tax code. Our 501(c)(4) status declares that OSGeo is a Social Welfare Organization. This determination affirms OSGeo’s role in serving the public through their mission, focused around Open Source Geospatial software.

This determination helps ensure that the organization will not have to pay US federal taxes on money accumulated toward the fulfilment of their mission. Unfortunately, unlike a 501(c)(3) (Charitable) status, this does not allow financial contributors to OSGeo to treat the contributions as a charitable contribution which can have a tax benefit for US tax payers. There should still be no problem with commercial organizations treating contributions to OSGeo as a business expense.

OSGeo owes a special debt to past Executive Director Tyler Mitchell, and current Treasurer Daniel Morissette who have carried this process to a successful conclusion after several years of work. Current OSGeo President, Jeff McKenna, says “Both Daniel and Tyler should be thanked by the entire community for their dedication to such a challenging task. Our future foundation events, and OSGeo in general, will benefit from their hard work for years to come.”

About the Open Source Geospatial Foundation

The Open Source Geospatial Foundation, or OSGeo, is a not-for-profit organization founded in 2006 whose mission is to support and promote the collaborative development of open geospatial technologies and data.  The Foundation provides financial, organizational and legal support to the broader open source geospatial community. It also serves as an independent legal entity to which community members can contribute code, funding and other resources, secure in the knowledge that their contributions will be maintained for public benefit.

Sneak Peak

While it’s really exciting that the release of QGIS 2.0 is just around the corner, I’m finding it just as exciting that work is already under way on version 2.1! Some great new features have already landed and I can’t wait to see what else is planned. Personally, I’ve got plans for a raft of improvements relating to print composers with the goal of making the print composer behave as much like a full-blown DTP package as possible. In the meantime, here’s a quick teaser of a feature I’ve been working on that will hopefully be landing in master soon:

A sneak peak...

  • <<
  • Page 7 of 9 ( 169 posts )
  • >>
  • osgeo

Back to Top

Sustaining Members