Related Plugins and Tags

QGIS Planet

OSGeo Board Election 2013 Results

On 7th Sep 2013 the final results from the 2013 elections for the open seats of the OSGeo Board of Directors have been published. There were four seats open and they have been filled by (in no particular order):

Thanks to all candidates for going through the elections and exposing themselves. All six candidates received excellent support with more then 60 votes each. Overall voting participation was 72% (129 out of 180) and there were no tie scores to arbitrate. Thanks to all Charter Members who voted!

The complete resulting OSGeo Board is:

With the election results published the new board of directors becomes immediately effective.

OSGeo wishes to thank the outgoing directors for their continued support of OSGeo and for helping to run a fantastic organizations with a great membership and lots of energy. We thank all candidates who stood in this election and all OSGeo Charter Members for their contribution and votes.

OSGeo-Live 7.0 Released

The OSGeo-Live geospatial software collection version 7.0 has been released, featuring more than sixty open source, standards compliant geospatial desktop applications, web applications and frameworks. A complete installation kit and high-quality sample data in multiple industry standard formats are included. The OSGeo Live will be officially launched at FOSS4G 2013 in Nottingham, UK, 17-21 September, 2013.

Release Highlights

Projects new to this release include:

  • GeoNode — a web-based application and platform for developing geospatial information systems (GIS) and for deploying spatial data infrastructures (SDI)
  • Leaflet — a modern, open source JavaScript library for mobile-friendly interactive maps
  • ncWMS — a Web Map Service (WMS) for geospatial data stored in CF-compliant NetCDF files
  • netCDF dataset — daily maximum temperature and rainfall, worldwide

All geospatial applications on the disc have been updated to their latest stable releases.

About OSGeo-Live

OSGeo-Live is a self-contained bootable DVD, USB flash drive and Virtual Machine based upon Ubuntu Linux (version 12.04 LTS). OSGeo-Live is pre-configured with a wide variety of robust open source geospatial software. All applications can be trialled without installing anything on your computer, simply by booting the computer from a DVD or USB drive, or running in a Virtual Machine environment. Each featured package is accompanied by both a publication quality one page descriptive summary and a short tutorial on how to get started using it.

http://live.osgeo.org

OSGeo-Live includes:

  • Over sixty quality geospatial Open Source applications installed and pre-configured
  • Free world maps and geodata
  • One page overview and quick start guide for every application
  • Overviews of key OGC standards
  • Translations to multiple languages

Credits

Over 160 people have directly helped with OSGeo-Live packaging, documenting and translating, and thousands have been involved in building the packaged software.

Packagers, documenters and translators include:

Activity Workshop, Agustín Dí­ez, Aikaterini Kapsampeli, Alan Beccati, Alan Boudreault, Alessandro Furieri, Alexander Bruy, Alexander Kleshnin, Alexander Muriy, Alexandre Dube, Alexey Ardyakov, Alex Mandel, Amy Gao, Andrea Antonello, Andrea Yanza, Andrey Syrokomskiy, Andry Rustanto, Angelos Tzotsos, Anna Muñoz, Antonio Falciano, Anton Novichikhin, Anton Patrushev, Argyros Argyridis, Ariel Núñez, Assumpció Termens, Astrid Emde, Barry Rowlingson, Benjamin Pross, Brian Hamlin, Bruno Binet, Cameron Shorter, Christophe Tufféry, Christos Iossifidis, Cristhian Pin, Damian Wojsław, Dane Springmeyer, Daniel Kastl, Daria Svidzinska, David Mateos, Denis Rykov, Diego González, Diego Migliavacca, Dimitar Misev, Dmitry Baryshnikov, Dominik Helle, Edgar Soldin, Eike Hinderk Jürrens, Elena Mezzini, Eric Lemoine, Estela Llorente, Etienne Delay, Etienne Dube, Evgeny Nikulin, Fran Boon, François Prunayre, Frank Gasdorf, Frank Warmerdam, Friedjoff Trautwein, Gavin Treadgold, Giuseppe Calamita, Gerald Fenoy, Grigory Rozhentsov, Guy Griffiths, Hamish Bowman, Haruyuki Seki, Henry Addo, Hernan Olivera, Howard Butler, Hyeyeong Choe, Ian Edwards, Ian Turton, Ilya Filippov, Jackie Ng, Jan Drewnak, Jane Lewis, Javier Rodrigo, Javier Sánchez, Jesús Gómez, Jim Klassen, Jing Wang, Jinsongdi Yu, Jody Garnett, Johan Van de Wauw, John Bryant, Jorge Arévalo, Jorge Sanz, José Antonio Canalejo, José Vicente Higón, Judit Mays, Klokan Petr Pridal, Kristof Lange, kuzkok, Lance McKee, Lars Lingner, Luca Delucchi, Lucía Sanjaime, Mage Whopper, Manuel Grizonnet, Marc-André Barbeau, Marco Curreli, Marco Puppin, Marc Torres, Margherita Di Leo, Maria Vakalopoulou, Mario Andino, Mark Leslie, Massimo Di Stefano, Mauricio Miranda, Mauricio Pazos, Maxim Dubinin, Michaël Michaud, Michael Owonibi, Micha Silver, Mike Adair, Milena Nowotarska, M Iqnaul Haq Siregar, Nacho Varela, Nadiia Gorash, Nathaniel V. Kelso, Ned Horning, Nobusuke Iwasaki, Oliver Tonnhofer, Òscar Fonts, Otto Dassau, Pasquale Di Donato, Patric Hafner, Paul Meems, Pavel, Pedro-Juan Ferrer, Pirmin Kalberer, Raf Roset, Ricardo Pinho, Roald de Wit, Roberta Fagandini, Roberto Antolin, Roberto Antolí­n, Roger Veciana, Ruth Schoenbuchner, Samuel Mesa, Scott Penrose, Sergey Grachev, Sergio Baños, Simon Cropper, Simon Pigot, Stefan A. Tzeggai, Stefan Hansen, Stefan Steiniger, Stephan Meissl, Steve Lime, Thierry Badard, Thomas Baschetti, Thomas Gratier, Tom Kralidis, Toshikazu Seto, Trevor Wekel, Valenty González, Vera, Xianfeng Song, Yoichi Kayama, Zhengfan Lin

Sponsoring organisations


4th GRASS GIS Community Sprint: Exciting achievements

The GRASS GIS community is delighted to present the outcome of the 4th Community Sprint that took place in a warm and sunny Prague, Czech Republic, from July 12 to July 18, 2013. The event happened after the Geoinformatics conference at the Czech Technical University in Prague. The Community Sprint was once more a creative gathering of both long-term and new developers, as well as users.
This meeting was held in the light of 30 YEARS OF GRASS GIS!

30 YEARS OF GRASS GIS!
We wish to cordially thank the Department of Mapping and Cartography, Faculty of Civil Engineering, Czech Technical University in Prague for hosting and technical support. In particular, we gratefully acknowledge our association sponsors OSGeo  and FOSSGIS e.V., and many individual donors: Peter Löwe, Andrea Borruso, Massimo Di Stefano, Alessandro Sarretta, Joshua Campbell, Andreas Neumann, Jon Eiriksson, Luca Casagrande, Karyn O Newcomb, Holger Naumann, Anne Ghisla, Helena Mitasova and Lubos Mitas, Dimitris Tamp, Mark Seibel, Markus Metz, and Tawny Gapinski. These financial contributions were used to cover costs such as meals and to help reducing travelling and accommodation expenses for participants with far arrival who came on own expenses.

Developers and users who joined the event came from various countries like Italy, Czech Republic, Slovak Republic, Poland, Sri Lanka/France, USA and Germany.
The Community Sprint focused on:

  • testing/bugfixing of the upcoming GRASS 7 version,
  • backporting new functionalities to the stable GRASS 6.4 series,
  • testing/bugfixing related to Mac OS X, MS-Windows and Linux,
  • presenting and developing the new Temporal GIS Algebra in GRASS 7,
  • connecting GRASS 7 with the planetary science software ISIS,
  • discussing integration with rasdaman.org software, a powerful multidimensional raster processor,
  • creating 3D vector test data for 3D interpolation,
  • discussing vector conflation,
  • discussing Bundle Block Adjustments,
  • presenting the state of image processing in GRASS 7, and discussing its future,
  • improving documentation, with focus on image processing and Temporal GIS Algebra,
  • developing/refactoring and bugfixing several wxGUI’s components,
  • further developing customizable wxGUI Toolboxes concept,
  • improving translation in Polish and Romanian languages,
  • fixing v.krige in GRASS7 and proposing merge with the recently developed v.kriging module,
  • meeting between Google Summer of Code 2013 mentor and students.

A lot of topic oriented discussions happened among small groups of participants: for more detailed information, please visit the Wiki pages at http://grasswiki.osgeo.org/wiki/GRASS_Community_Sprint_Prague_2013 and the related discussion page at http://grasswiki.osgeo.org/wiki/Talk:GRASS_Community_Sprint_Prague_2013

About GRASS GIS
The Geographic Resources Analysis Support System, commonly referred to as GRASS GIS, is an Open Source Geographic Information System providing powerful raster, vector and geospatial processing capabilities in a single integrated software suite. GRASS GIS includes tools for spatial modeling, visualization of raster and vector data, management and analysis of geospatial data, and the processing of satellite and aerial  imagery. It also provides the capability to produce sophisticated presentation graphics and hardcopy maps. GRASS GIS has been translated into about twenty languages and supports a huge array of data formats. It is distributed freely under the terms of the GNU General Public License (GPL). GRASS GIS is an official project of the Open Source Geospatial Foundation (OSGeo).

GRASS GIS Development Team, July 2013

GRASS GIS 6.4.3RC4 released

Fourth (and last) release candidate of GRASS GIS 6.4.3 with improvements and stability fixes
A fourth release candidate of GRASS GIS 6.4.3 is now available.

Source code download:

Binaries download:

To get the GRASS GIS 6.4.3RC4 source code directly from SVN:
 svn checkout http://svn.osgeo.org/grass/grass/tags/release_20130710_grass_6_4_3RC4

Key improvements of this release include some new functionality (assistance for topologically unclean vector data), fixes in the vector network modules, fixes for the wxPython based portable graphical interface (attribute table management, wxNVIZ, and Cartographic Composer), fixes in the location wizard for Datum transform selection and support for PROJ.4 version 4.8.0, improvements for selecting the Python version to be used, enhanced portability for MS-Windows (native support, fixes in case of missing system DLLs), and more translations (esp. Romanian).

See also our detailed announcement:
 http://trac.osgeo.org/grass/wiki/Release/6.4.3RC4-News

First time users should explore the first steps tutorial after installation.

Release candidate management at
http://trac.osgeo.org/grass/wiki/Grass6Planning

Please join us in testing this release candidate for the final release.

Consider to donate pizza or beer for the upcoming GRASS GIS Community Sprint in Prague:
Thanks to all contributors!

Support the upcoming GRASS GIS Community Sprint with a (micro)donation!

Have you been using GRASS GIS within your company or for your daily tasks? Would like to express your satisfaction and give something back to these terrific software developers to make them even happier during the July’s GRASS GIS Community Sprint in Prague?
Sure – so don’t think twice and support the developers with a (micro)donation!
Please contact Markus Neteler ([email protected] – GRASS GIS PSC Chair) for further details.
Wait – it is also possible to buy a round of beer for the developers with a quick click using the PayPal “Buy [pizza/beer/...] Now” button below: (… more pizza & beer for the developers)

About the Community Sprint

A “Community Sprint” is a get-together for members and supporters of GRASS GIS and related OSGeo projects to make decisions and tackle larger problems. Developers and contributors are donating their valuable time, so appreciate direct or in-kind funding made available for the sprint meeting to cover out-of-pocket expenses. All of the work that takes place at the community sprint will be directly contributed back into the GRASS GIS project to the benefit of everyone who uses it.
See the outstanding results from 2011, and 2012!

FOSS4G-CEE 2013: Program published!

Join us at FOSS4G Central and Eastern Europe (FOSS4G-CEE) 2013 from 16th – 20th June, National Library of Romania, Bucharest, Romania.

You will meet well known Keynote Speakers (random order): Jeff McKenna, Paul C. Smits, Jáchym Čepický, Schuyler Erle, Maria Antonia Brovelli, Dirk Frigne, Markus Neteler, Alyssa Wright, and Radu Puchiu.

Check the long list of Practical Workshops and Oral Presentations at: http://2013.foss4g-cee.org/program/schedule
Check out for the additional Code Sprint, the Open GeoData Hackathon, and the Open Data Side Event.

How to arrive? See http://2013.foss4g-cee.org/venue/map

Building QGIS on Ubuntu 13.04

It seems upgrading to Ubuntu 13.04 breaks a few things in the QGIS build process. Here’s some quick workarounds I’ve found to get it building again.

Firstly, Ubuntu defaults to Qt 5, causing the error:

CMake Error at /usr/share/cmake-2.8/Modules/FindQt4.cmake:1216 (message):

 Found unsuitable Qt version "5.0.1" from /usr/bin/qmake, this code requires
 Qt 4.x

This can be fixed by switching the system default back to Qt 4, so that  qmake refers to the Qt 4 version. The “qt4-default” package handles this switch for you, so just run:

sudo apt-get install qt4-default

Update: A better solution was found by Pierre and Pvanb and is described here. Basically it involves changing the QMAKE_EXECUTABLE option from /usr/bin/qmake to /usr/bin/qmake-qt4.

Next, I was getting the error:

make[2]: *** No rule to make target `/usr/lib/libpython2.7.so', needed by `output/lib/libqgispython.so.1.9.0'. Stop.

I’m not sure if this is the correct solution, but setting up some links and re-running ldconfig gets around this:

sudo ln -sf /usr/lib/x86_64-linux-gnu/libpython2.7.so.1 /usr/lib/libpython2.7.so.1
sudo ln -sf /usr/lib/x86_64-linux-gnu/libpython2.7.so /usr/lib/libpython2.7.so
sudo ldconfig

Update: a better solution is to change the PYTHON_LIBRARY option from /usr/lib/libpython2.7.so to /usr/lib/x86_64-linux-gnu/libpython2.7.so

These two changes were enough to get QGIS building again. If you’ve got a better solution for these errors, let me know…

A neat trick in QGIS 2.0 – images in atlas prints

Here’s a cool trick which you can do in QGIS 2.0. It builds on two new features introduced in version 2.0 – atlas prints and html labels.

Atlas prints (previously available as a plugin, now integrated into QGIS core) were developed by Oslandia, and allow you to create data driven map layouts from a specified coverage layer. You can read more about them here.

Another new feature in QGIS 2.0 is the ability to render composer labels as html (courtesy of Olivier Dalang). This allows all kinds of fantastic effects, such as formatting text in the middle of a label (using <b>, <i>, and <font> tags) or creating labels which contain HTML tables. You can even use CSS stylesheets and rules to format the HTML! I’ve been told JavaScript also works inside the labels, but I’ve yet to try this out.

You can combine these two new features for some great tricks. Let’s say we’d like to create a set of maps of local councils, and we want each map to have a watermarked logo of the council on it. For this example I’ve created a basic basemap of Victorian councils, and I’ve downloaded all the council logos (in a variety of formats) to a local folder. Next, I’ll add an extra column to the council layer containing the name of the logo image:

adding_logo_column

Adding a logo column to the table

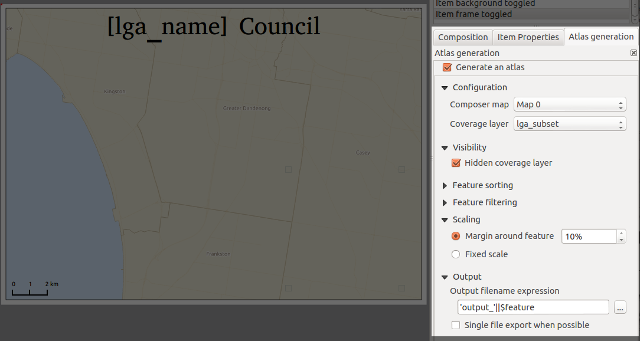
Then, we’ll throw together a simple composition containing the map and set it up as an atlas print:

setting_up_atlas

Generating an atlas

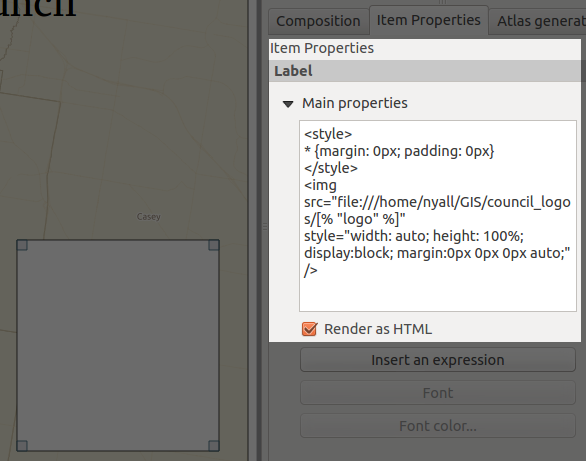
Now for the fun bit. I’ll add a label item to the composer, set it to “Render as HTML”, and insert some specially-crafted html:

The magic HTML label...

The magic HTML label…

For copy/paste purposes here’s the label contents again:

<style>
* {margin: 0px; padding: 0px}
</style>
<img src="file:///home/nyall/GIS/council_logos/[% "logo" %]"
style="width: auto; height: 100%; display: block; margin: 0px 0px 0px auto;" />

There’s a couple of things to note here. First, the magic happens in the image’s src attribute (“file:///home/nyall/GIS/council_logos/[% "logo" %]“). When the composer is exported, QGIS will replace the [% "logo" %] part with the contents of the logo field for each row in the councils table. This means the image source will then point to the local copy of the council’s logo, eg “file:///home/nyall/GIS/council_logos/glen_eira.jpg” for the first row.

Secondly, I’ve styled the image with the css:

width: auto; height: 100%; display: block;

This allows the image to resize to 100% of the height of the label while maintaining its correct aspect ratio. I’ve also added the rule

margin: 0px 0px 0px auto;

to force the image to right align within the html label. This ensures that all the watermarked logos will appear in a consistent size and position for each map.

Lastly, I’ll remove the label’s frame and background by unchecking these options, then set its transparency to 80% under the new “Rendering” section:

Yet another new feature in QGIS 2.0...

Yet another new feature in QGIS 2.0…

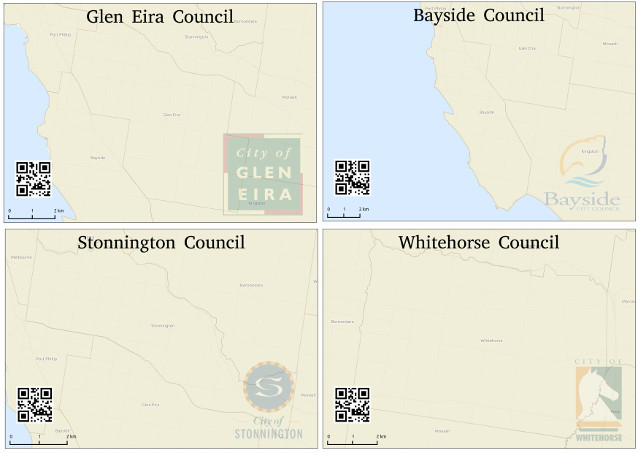
Ok, we’re all done. Now, when I select Composer -> “Export as Image”, we’ll get a lovely set of council maps complete with watermarked council logo!

A watermarked atlas!

A watermarked atlas!

There we go — all ready for print, with no manipulation in external programs required at all!

Bonus post-credits section

Here’s a kicker — the linked images don’t need to be local. That means you can even piggy-back off an existing web service to generate an image on the fly! Let’s say you were asked to add QR codes to your maps to link directly to the council website. All it takes is adding a new column to the table, then modifying the image src to read:

src="http://qrfree.kaywa.com/?l=1&s=8&d=[% "url" %]"

Now when we export the maps we’ll also get a QR image generated on the fly and inserted into the layout!

Complete with dynamically generated QR code!

Complete with dynamically generated QR code!

Combining HTML labels and atlas prints in this way is extremely powerful. This example is just touching the tip of the iceberg – I’m keen to see what the community can do with this when QGIS 2.0 is released!

QGIS gets Oracle support!

Seems this is a good day for QGIS Oracle users. According this commit made by Jürgen QGIS now has built-in Oracle support. Win!

Native Oracle support can now see QGIS being opened up to a wider user base yet again. A large user base normally means more people willing to sponsor awesome new features and bug fixes. Having seen the growth in the user base from having native MS SQL Server 2008+ support I can imagine what it will be like with Oracle.

The list of formats QGIS can open and edit is getting larger and larger with each release. Is there a future for vendor lock in? I can’t see it.

Standard disclaimer about latest dev build and new features :)


Filed under: Open Source, qgis Tagged: FOSSGIS, gis, Open Source, oracle, osgeo, qgis, qgis-editing, Quantum GIS

New QGIS PDF and HTML manuals

A quick update from the QGIS documentation team today on the mailing list. The QGIS 1.8 manual is now available in HTML and PDF form.

HTML manual can be found at:
http://docs.qgis.org/html/en/docs/user_manual/index.html

PDF manual at:
http://docs.qgis.org/pdf/QGIS-1.8-UserGuide-en.pdf

This has been part of an ongoing effort from the documentation team since before the 1.8 release to bring our all our documentation into reStructedText rather then LaTeX. Moving to reStructedText allows quicker updates and a larger range of final output formats.

I would like to thank everyone who has been involved in this process as I know what a grueling process updating documentation can be.

Community notice

Just remember you don’t have to be a programmer to contribute to an open source project. If you think you could contribute to the updating of the QGIS documentation please contact the team on the mailing list.


Filed under: Open Source, qgis Tagged: FOSSGIS, gis, Open Source, osgeo, qgis, Quantum GIS

Installing Python setuptools into OSGeo4W Python

The easiest way install Python libraries is to use easy_install and pip.  easy_install and pip are package managers for Python. From the easy_install page:

Easy Install is a python module (easy_install) bundled with setuptools that lets you automatically download, build, install, and manage Python packages.

and from the pip page:

pip is a tool for installing and managing Python packages, such as those found in the Python Package Index. It’s a replacement for easy_install.

To get easy_install you need to install Python setuptools and you are good to go. Sounds easy!  However the setuptools installer assumes that you have the normal standalone Python installed which writes it’s install location to the registry, and when you run the installer it will say that it can’t find Python on the system.  What the!?

If you have installed QGIS, or any other tool from the OSGeo4W install, you will see that OSGeo4W bundles its own version of Python in: C:\OSGeo4W\apps\python27. This is the Python that is used when calling python in the OSGeo4W shell.  It seems someone on the OSGeo wiki has made a bootstrapped installer for setuptools that will install setuptools and easy_install into the  C:\OSGeo4W\apps\python27 folder for you.

Steps to take

  • Download ez_setup.py
  • Run python ez_setup.py in your OSGeo4W shell
  • Done!

To install a package with easy_install just use:

easy_install {packagename}

I wanted to have bottle and flask installed:

easy_install bottle

which gives you something like:

Searching for bottle
Reading http://pypi.python.org/simple/bottle/
Reading http://bottle.paws.de/
Reading http://github.com/defnull/bottle
Reading http://bottlepy.org/
Best match: bottle 0.11.4
Downloading http://pypi.python.org/packages/source/b/bottle/bottle-0.11.4.tar.gz#md5=f767c340de0b7c9581917c48e609479b
Processing bottle-0.11.4.tar.gz
Running bottle-0.11.4\setup.py -q bdist_egg –dist-dir c:\users\woo\appdata\local\temp\easy_install-5b4qq6\bottle-0.11.4\egg-dist-tmp-q2yd68
zip_safe flag not set; analyzing archive contents…
bottle: module references __file__
bottle: module references __path__
Adding bottle 0.11.4 to easy-install.pth file
Installing bottle.py script to C:\OSGeo4W\apps\Python27\Scripts
Installed c:\osgeo4w\apps\python27\lib\site-packages\bottle-0.11.4-py2.7.egg
Processing dependencies for bottle
Finished processing dependencies for bottle

Install pip

Note

Most of the time any Python packages that are needed by your OSGeo4W tools are bundled in the installer and can be downloaded using the OSGeo4W installer, however there have been cases when I wanted to install a non OSGeo4W package into my setup by using easy_install or pip. Like bottle and flask in the example above.


Filed under: Open Source Tagged: FOSSGIS, osgeo, python, qgis, Quantum GIS

Five new awesomely awesome QGIS features – Round 2

As QGIS is such a fast moving project I have decided to make this a regular blog post in order to highlight some new features added to QGIS. If you haven’t already, don’t forget to check out round one.

Remember that some of these features may still only be new which might change between now and the next official released version. With that out of the way lets get listing.

Atlas integration

If you are a regular user of QGIS Python plugins, and who isn’t, then you would have used the awesome Atlas plugin developed by Vincent Picavet. This great tool can be used to generate mapbooks, or an atlas as some people like to say, using a coverage layer and a print composer. What makes this even more awesome is that it is now built into the print composer.

Atlas composer intergration

The builtin atlas function also gives you the ability to use an expression to do runtime text replacement, including access to all the fields on the coverage layer.  The coverage layer doesn’t even have to be a region layer, it can be a simple point layer, or even a line layer.   You can see the result of me running the atlas generation from the above example here

Big thanks to Oslandia for integrating this great feature, and the companies sponsoring the work.

New Python console

This new addition comes from the great work that Salvatore Larosa has been doing to add a better Python console to QGIS.

The new Python console includes attribute auto complete, syntax highlighting, better copy and paste, uploading to codepad, the ability to run code from a file, etc.  You don’t realise how much difference there is until you go back to using the old one in version 1.8.

New Python console

Tabbed and groups in builtin forms

One of the things I really loved about QGIS, coming from MapInfo, was the builtin forms.  Just having the ability to enter data using controls like combo boxes, calendar widgets, etc makes you one step closer to having better data.   This feature is the exact reason I setup a 67 year old for kerb data collection.

As good as they are the builtin forms have an issue of ending up with as a big scrolling list with lots of fields; also the lack of  the ability to group or put fields on tabs in the UI meant you had to create a custom form.  Well not any more.

There is now a combo box on the Fields tab that allows you to build a generated form but also add tabs and group boxes.  You can even have the same field shown more then once on the form, handy for something like an ID field that you would like to show on each tab.

With this new ability the builtin forms can get me 95% of the way for data entry jobs, the other 5% I just make a custom form – but that is very rare.

Sextante

Sextante is a great and powerful analytical framework that has been added to the core of QGIS thanks to Victor Olaya.  This is not a feature that I use a lot but this is only due to most of my work being in development and not analysis, however that doesn’t mean that it’s not a really cool feature.

One of the greatest things about the Sextante toolbox is that it allows you to integrate other great open source tools like GRASS, SAGA, R, OTB, etc, right into your QGIS workflow and view the results in the canvas. It even includes a modeller so that you can build a connected diagram of all the bits of your process, even if it crosses between programs.

The toolbox

For me what is even better is that you can use Sextante in your plugins or custom Python code.  Sextante has a Python interface – well the whole thing is written in Python – that you can use to run a Sextante supported algorithm.

import sextante
outputs_0=sextante.runalg("grass:v.crossbones", /file, 0, ,, 1, 2, 3, 4, 1=3.0,2=8.0,5=6.0,8=6.0,11=6.0,14=6.0, None)
outputs_1=sextante.runalg("grass:v.delaunay", outputs_0['output'], True, True, None)
outputs_2=sextante.runalg("grass:v.dissolve", outputs_0['output'], , None)

Victor has created a blog to cover some Sextante recipes at QGIS-SEXTANTE cookbook/. There are also some really cool example of Sextante in use at:

Massive amount of composer additions

This last feature, or rather feature set,  comes from the sponsorship and support of the World BankAustralia-Indonesia Facility for Disaster Reduction, Geoscience Australia and the GFDRR.  Most of this work was done to aid in the development of a new QGIS plugin called inaSAFE, which has also received some great praise

“(InaSAFE) is very beneficial for all of us. It’s a good example of our partnership.”
Dr Susilo Bambang Yudhoyono – President of Indonesia

Some of the improvements include:

  • A new loadFromTemplate method, in the API, that can do text replacement in the QGIS composer template.
  • Better support for EPSG:4326 scale bars
  • Multipage in one composer
  • Automatic overview frame in map frame
  • HTML frame
  • Zebra style grid frame border
  • More control of grid labels. Inside, outside, disabled
  • etc, etc

These are great additions to the QGIS composer and I have already used the overview frame feature along with the new atlas integration  to make some quick nice looking map books. \

A huge thanks to the World BankAustralia-Indonesia Facility for Disaster ReductionGeoscience Australia and the GFDRR, and all the developers included.

You can see some of the output that InaSAFE generates using some of these new features at http://quake.linfiniti.com/

P.S The World Bank also sponsored the new raster Save As.. ability just like we have for vector layers.


Filed under: Open Source, qgis Tagged: FOSSGIS, gis, Open Source, osgeo, qgis, Quantum GIS

FOSS4G-AU in summary

Last Thursday and Friday was our first local Australian FOSS4G event which was hosted at the CSRIO building in Brisbane.  Very big thanks to CSRIO for hosting the event.  The venue was setup perfectly for  hosting an event like this, including dual projectors for presenting, video calls over to Perth, etc.

The first day was done using a un-conference style of event. This is the first time I’ve been to a un-conference and I liked the format a lot.   Once everyone was there on the first morning we collected ideas from people and everyone voted on which ones they would like to see.  After we had picked enough topics Shaun and I made a program for the day and we started.

Topics included:

Me presenting QMap

The second day was a code sprint.  I worked on converting a MapBasic scripts from one of the guys to QGIS, and Jody enlisted the others to help check the headers of the GeoServer project so that it can finally pass OSGeo incubation.

Overall I think it was a very successful event.  I would like to make these a yearly event if we can, provided that we have people to talk, or projects to work on.

More information about up coming OSGeo events in Australia and New Zealand can be found at http://www.meetup.com/osgeo-aust-nz/


Filed under: Open Source, qgis Tagged: FOSSGIS, gis, Open Source, open source gis, osgeo, qgis, Quantum GIS

FOSS4G-AU un-conference

Another quick announcement for today. The local FOSS4G-AU chapter is holding un-conference and code sprint in Brisbane on the 15 and 16th of November 2012.

Ben Caradoc-Davies made the announcement on the mailing list the other day:

The Free and Open Source Software for Geospatial Australia (FOSS4G-AU)
2012 Unconference and Code Sprint will be held at CSIRO’s Queensland
Centre for Advanced Technologies (QCAT), Pullenvale QLD.
15 November: Unconference
16 November: Code Sprint
This is a participant-organised event: please add your unconference and code sprint topic suggestions to the wiki. Organisers are welcome; please speak up.

See here for details: http://wiki.osgeo.org/wiki/FOSS4G-AU_2012

RSVP essential for building access. Please sign up here:
http://www.meetup.com/osgeo-aust-nz/events/83965312/

Email: [email protected] (sign up here http://lists.osgeo.org/mailman/listinfo/aust-na)

Kind regards,
Ben Caradoc-Davies
Software Engineer
CSIRO Earth Science and Resource Engineering
Australian Resources Research Centre

Being part of osgeo-aust-nz and the local Australian open source GIS movement it’s great to see events like this being organized.

I’ll be there, most likely pimping some QGIS stuff.

Hope to see you there.

Just remember that RSVP is essential to get into the building.


Filed under: Open Source Tagged: foss4g, FOSSGIS, osgeo, qgis

QGIS Training in Brisbane (and other places in Australia)

Just a quick post to let everyone know that DMS will be running QGIS training on the 20 Nov 2012 to the 21 Nov 2012 in Brisbane, QLD. More information can be found at http://mapsolutions.com.au/training/quantum-gis/introduction-to-qgis.aspx

Other dates include:

23 Oct 2012 – 24 Oct 2012 – Perth
13 Nov 2012 – 14 Nov 2012 – Perth
20 Nov 2012 – 21 Nov 2012 – Brisbane
22 Nov 2012 – 23 Nov 2012 – Melbourne


Filed under: Open Source, qgis Tagged: osgeo, qgis, Quantum GIS

Australian QGIS User Group

I’m very please to announce the Australian QGIS User Group. Chris Scott (DMS) and I created this group because the interest in QGIS here is growing fast and it would be nice to have a place where us Aussies can hang out and chat about QGIS stuff, discuss local issues, organize local events, put shrimps on the barbie.

My ultimate goal would be to turn this into a full user group much like the Swiss QGIS User Group but for now we will keep it light.

Everyone is free to view the content of the home page and the Google group, however you have to request to join the Google Group to post.  This is only so that we can keep it local and not reduce the official QGIS mailing lists.

So in saying all that. If you live in Australia. Use QGIS, or are interested in QGIS. Feel free to join the group.


Filed under: Open Source, qgis Tagged: FOSSGIS, gis, Open Source, osgeo, qgis, Quantum GIS

Generating chainage (distance) nodes in QGIS

Something that I need to do now and then is generate points along a line at supplied distance.  I had never really looked into doing it in QGIS until this question poped up on gis.stackexchange.com.  This is a quick blog post because I thought it was a pretty handy little thing to do.

In the development version there is a new method on QgsGeometry called interpolate. This method takes a distance and returns a point along a line at that distance. Perfect! We can then just wrap this in a loop and generate a point increasing the distance as we move along

from qgis.core import (QgsFeature, QgsGeometry,
                       QgsVectorLayer, QgsMapLayerRegistry,
                       QgsField)
from PyQt4.QtCore import QVariant
from qgis.utils import iface

def createPointsAt(distance, geom):
    length = geom.length()
    currentdistance = distance
    feats = []

    while currentdistance < length:
        # Get a point along the line at the current distance
        point = geom.interpolate(currentdistance)
        # Create a new QgsFeature and assign it the new geometry
        fet = QgsFeature()
        fet.setAttributeMap( { 0 : currentdistance } )
        fet.setGeometry(point)
        feats.append(fet)
        # Increase the distance
        currentdistance = currentdistance + distance

    return feats

def pointsAlongLine(distance):
    # Create a new memory layer and add a distance attribute
    vl = QgsVectorLayer("Point", "distance nodes", "memory")
    pr = vl.dataProvider()
    pr.addAttributes( [ QgsField("distance", QVariant.Int) ] )
    layer = iface.mapCanvas().currentLayer()
    # Loop though all the selected features
    for feature in layer.selectedFeatures():
        geom = feature.geometry()
        features = createPointsAt(distance, geom)
        pr.addFeatures(features)
        vl.updateExtents()

    QgsMapLayerRegistry.instance().addMapLayer(vl)

The above code might look a bit scary at first if you have never done any Python/pyqgis but hopefully the comments will ease the pain a little. The main bit is the createPointsAt function.

Cool! If we want to use this we can just stick it in a file in the .qgis/python folder (lets call it pointtools.py) and then run import pointtools in the python console.

So lets have a go. First select some objects then run the following in the Python Console

import pointtools
pointtools.pointsAlongLine(40)

That will generate a point every 40 meters along then selected lines

Distance nodes along line in qgis-dev

To generate nodes along different lines, select the new features, then call pointtools.pointsAlongLine(40) in the Python console.

Simple as that!

(Who knows, someone (maybe me) might even add this as a core object function in QGIS in the future)


Filed under: Open Source, qgis Tagged: language python, Open Source, osgeo, pyqgis, python, qgis, qgis-tips, Quantum GIS, tips

Like the super handy Atlas QGIS plugin? Want to see it as a core part of QGIS?

Atlas is a super handy little QGIS plugin that lets you generate a map series from a composer and a coverage (grid) layer.

The authors of the plugin are now looking for some funding to make it a core part of QGIS.  Making it part of QGIS would mean integration into the composer and maybe APIs for developers to add extensions.

The authors are looking at raising 7000€ in order top get the work done, but the more money raised the more features that are added.

More information can be found at http://www.oslandia.com/?p=1243


Filed under: Open Source, qgis Tagged: FOSSGIS, Open Source, osgeo, qgis, Quantum GIS

Better date and time support in QGIS expressions and styles

Version note: This will only work in the latest dev build of QGIS – not in 1.8

The lack of uni for the next couple of weeks has left me some time at night to work on some features that I really wish QGIS had.  One of these features was better date and time support in the expression engine.  Date and time is an important concept when working on inspection data and not being able to style my features in QGIS using date operations was bugging me.  So in good open source fashion I added some.

Here are the current functions (more to come in the future):

  • $nowreturns the current date and time
  • age({datetime},{datetime}) - returns the difference between the two dates
  • todate({string}) - converts a string to date type
  • totime({string}) – converts a string to time type
  • tointerval({string}) – converts a string to a interval type (details below)
  • day({datetime} or {interval}) – returns the day from a datetime type or the number of days in a interval.
  • hour(…) – Same as above but for hours
  • minute(…)  - Same as above but for minutes
  • second(…)  - Same as above but for seconds
  • day(..)  - Same as above but for days
  • week(..)  - Same as above but for weeks
  • month(…)  - Same as above but for months
  • year(…) - Same as above but for years
  • {datetime} – {interval} = {new datetime} – returns a new datetime subtracting the interval 
  • {datetime} + {interval} = {new datetime} – returns a new datetime adding the interval


The interval type

Functions like age(..), tointerval(), {datetime} -/+ {interval}, day(..), hour(..), etc, use, or return, Intervals.  An Interval is a measure of time that we can use for different things.  An example of an Interval is ’1 Year 2 Months’ this is then converted to a number of seconds and used for any calculations.

For example one can take away 10 days from the current date by doing the following ( -> marks the output ):

todate($now - '10 Days')
-> 2012-06-20

as

todate($now)
-> 2012-06-30

We can also do something like:

todate($now + '2 Years 1 Month 10 Days')
-> 2014-08-10

The age() function will return an interval which we can use extract what information we need.

The number of days between two dates:

day(age('2012-06-30', '2012-06-10'))
-> 20
-- Think of it as '2012-06-30' - '2012-06-10'
-- Note: day(), month(), etc, functions return doubles so you can get
-- 21.135234 days if you are using date & time type rather than just date type
-- wrap the result in toint() to get a more sane output.

Day() will also work on a plain date:

day('2012-06-30')
-> 30

We can even get the number of seconds between two dates:

second(age('2012-06-30', '2012-06-10'))
-> 1728000

Currently the only date format supported is {year}-{month}-{day} as seen in the examples above. Shouldn’t be too hard to add support to the todate(), todatetime(), totime() functions for giving it a pattern to use when converting the string e.g. dd-mm-YYYY, or something like that.

More on this fancy new stuff

When I wrote the new expression builder dialog a while ago I made it dynamic so that any new functions added to the expression engine will show up automatically.  So here they are:

List of new date and time functions.

We can also use these functions in the rule based rending, which is where the power really comes in.  Lets see something like that in action:

Styled using days and years

Should be pretty straight forward to understand. We are using the age() and day() functions to style the events that are older than 30 days, within 30 days, for today, or in the future.  We also check the year of the event using year() and year($now) to make sure we only see this years events, or style them differently depending on if they are last years events or in the future.

This is the result of the above rules:

Result of using date functions in rule based renderer

I’m also using the date functions in the expression based labelling to label the features using the following expression:

CASE
WHEN year( "dateadded") < year($now) THEN
	'Last Year'
WHEN day(age("dateadded", $now)) < 0 THEN
	day(age("dateadded", todate($now))) || ' Days old'
ELSE
	day(age("dateadded", todate($now))) || ' Days to go'
END

Well that’s it. Hope you find it handy in your day-to-day mapping. I know I will be using it a lot.
Thanks to Martin and Jürgen for the code reviews during the process; venturing in an unknown part of the code base always makes me nervous but that is all part of learning, and sometimes you can make some pretty cool stuff.
Some other random notes: The general idea has been modelled of how Postgres handles dates and times, it’s not an exact copy but follows the same kind of ideas. The interval class also uses the same number of seconds for one year that postgres does so that we can be consistent with the output.


Filed under: Open Source, qgis Tagged: FOSSGIS, gis, map-rendering, Open Source, osgeo, qgis, Quantum GIS, styling

Styling temporal (time) data in QGIS

So this years first uni semester is done and dusted, now I have some free time.  Blog all the things!

This is a follow up post for discussion that was started on LinkedIn about showing features older, or newer, then a certain date different colours   The main post was about using free, or low cost, solutions in order to aid in mapping water networks. I recommend that everyone watch it. A very good presentation.

I recommended that you could use the rule based rendering engine but the expression engine in QGIS doesn’t have any date functions yet.  All good we can add them if we need and once I get my head around the expression engine I plan on doing exactly that. But for now we can do it a different way.

We are going to use Spatialite, but any database will do (syntax and process will vary).

Lets have a look an inspection layer we have in our Spatialite database viewed in QGIS:

Pretty boring and hard to see what has been done in the last 30 days.  Now with the lack of support for dates in the expression engine we have to use another methods.  For this example we will use the really handy DBManger plugin that now ships with QGIS from 1.8.  Load it, connect to your database, and run the following query:

SELECT id,
              CASE WHEN DATE("date_checked") > DATE('now', '-30 days') THEN
                         'Within 30 Days'
              ELSE
                         'older'
              END as age, date_checked, geom
FROM  "inspections"

As you can see anything that is within the 30 days now has the “Within 30 Days” string in the age column, or else it has “older”.  CASE statements can be very powerful things in SQL sometimes.

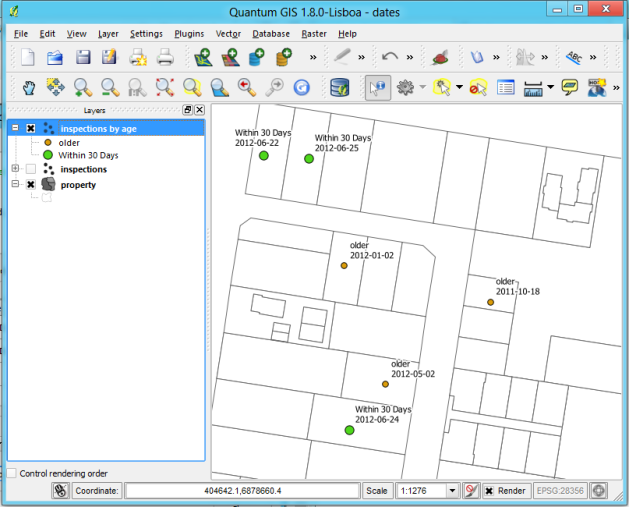
Now load it into QGIS, style, and label it using the new age column

and Bob’s your uncle

You now have a layer that is style based on age but is also dynamic.  Adding a new inspection point will now will be styled according to those rules. (Although you will have to edit the normal inspection layer with it turned off as views/queries are not editable – without some setup anyway)

It might be a simple thing to some but sometimes it’s hard to find the right words to describe what you want when you are looking for this kind of thing. So hopefully this has helped a few people get started with visualizing their time/date based data in QGIS.

Happy mapping!


Filed under: Open Source, qgis Tagged: FOSSGIS, gis, Open Source, osgeo, qgis, Quantum GIS, styling

  • <<
  • Page 8 of 9 ( 169 posts )
  • >>
  • osgeo

Back to Top

Sustaining Members