Related Plugins and Tags

QGIS Planet

QGIS Server Python Plugins Ubuntu Setup

Prerequisites

I assume that you are working on a fresh install with Apache and FCGI module installed with:

$ sudo apt-get install apache2 libapache2-mod-fcgid
$ # Enable FCGI daemon apache module
$ sudo a2enmod fcgid

Package installation

First step is to add debian gis repository, add the following repository:

$ cat /etc/apt/sources.list.d/debian-gis.list
deb http://qgis.org/debian trusty main
deb-src http://qgis.org/debian trusty main

$ # Add keys
$ sudo gpg --recv-key DD45F6C3
$ sudo gpg --export --armor DD45F6C3 | sudo apt-key add -

$ # Update package list
$ sudo apt-get update && sudo apt-get upgrade

Now install qgis server:

$ sudo apt-get install qgis-server python-qgis

Install the HelloWorld example plugin

This is an example plugin and should not be used in production!
Create a directory to hold server plugins, you can choose whatever path you want, it will be specified in the virtual host configuration and passed on to the server through an environment variable:

$ sudo mkdir -p /opt/qgis-server/plugins
$ cd /opt/qgis-server/plugins
$ sudo wget https://github.com/elpaso/qgis-helloserver/archive/master.zip
$ # In case unzip was not installed before:
$ sudo apt-get install unzip
$ sudo unzip master.zip 
$ sudo mv qgis-helloserver-master HelloServer

Apache virtual host configuration

We are installing the server in a separate virtual host listening on port 81.
Rewrite module can be optionally enabled to pass HTTP BASIC auth headers (only needed by the HelloServer example plugin).

$ sudo a2enmod rewrite

Let Apache listen to port 81:

$ cat /etc/apache2/conf-available/qgis-server-port.conf
Listen 81
$ sudo a2enconf qgis-server-port

The virtual host configuration, stored in /etc/apache2/sites-available/001-qgis-server.conf:

<VirtualHost *:81>
    ServerAdmin webmaster@localhost
    DocumentRoot /var/www/html

    ErrorLog ${APACHE_LOG_DIR}/qgis-server-error.log
    CustomLog ${APACHE_LOG_DIR}/qgis-server-access.log combined

    # Longer timeout for WPS... default = 40
    FcgidIOTimeout 120 
    FcgidInitialEnv LC_ALL "en_US.UTF-8"
    FcgidInitialEnv PYTHONIOENCODING UTF-8
    FcgidInitialEnv LANG "en_US.UTF-8"
    FcgidInitialEnv QGIS_DEBUG 1
    FcgidInitialEnv QGIS_SERVER_LOG_FILE /tmp/qgis-000.log
    FcgidInitialEnv QGIS_SERVER_LOG_LEVEL 0
    FcgidInitialEnv QGIS_PLUGINPATH "/opt/qgis-server/plugins"

    # ABP: needed for QGIS HelloServer plugin HTTP BASIC auth
    <IfModule mod_fcgid.c>
        RewriteEngine on
        RewriteCond %{HTTP:Authorization} .
        RewriteRule .* - [E=HTTP_AUTHORIZATION:%{HTTP:Authorization}]
    </IfModule>

    ScriptAlias /cgi-bin/ /usr/lib/cgi-bin/
    <Directory "/usr/lib/cgi-bin">
        AllowOverride All
        Options +ExecCGI -MultiViews +FollowSymLinks
        Require all granted
        #Allow from all
  </Directory>
</VirtualHost>

Enable the virtual host and restart Apache:

$ sudo a2ensite 001-qgis-server
$ sudo service apache2 restart

Test:

$ wget -q -O - "http://localhost:81/cgi-bin/qgis_mapserv.fcgi?SERVICE=HELLO"
HelloServer!

See all QGIS Server related posts

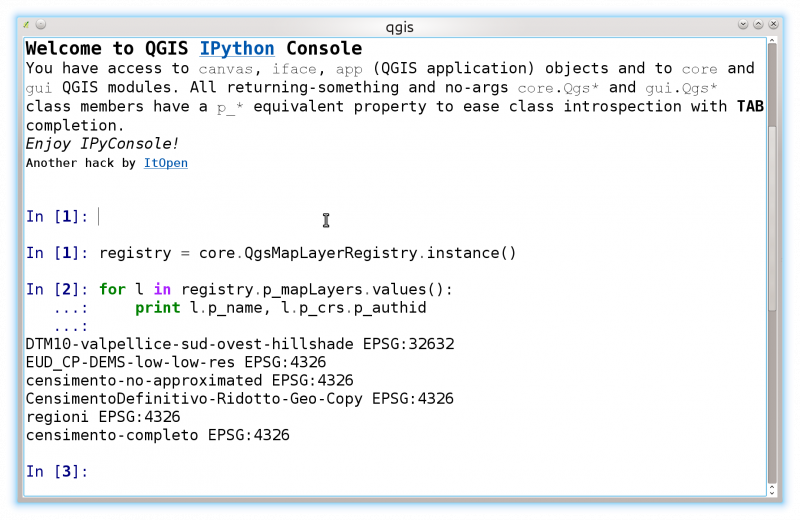
QGIS and IPython: the definitive interactive console

Whatever is your level of Python knowledge, when you’ll discover the advantages and super-powers of IPython you will never run the default python console again, really: never!

If you’ve never heard about IPython, discover it on IPython official website, don’t get confused by its notebook, graphics and parallel computing capabilities, it also worth if only used as a substitute for the standard Python shell.

I discovered IPython more than 5 years ago and it literally changed my life: I use it also for debugging instead ofpdb, you can embed an IPython console in your code with:

from IPython import embed; embed()

TAB completion with full introspection

What I like the most in IPython is its TAB completion features, it’s not just like normal text matching while you type but it has full realtime introspection, you only see what you have access to, being it a method of an instance or a class or a property, a module, a submodule or whatever you might think of: it even works when you’re importing something or you are typing a path like in open('/home/.....

Its TAB completion is so powerful that you can even use shell commands from within the IPython interpreter!

Full documentation is just a question mark away

Just type “?” after a method of function to print its docstring or its signature in case of SIP bindings.

Lot of special functions

IPython special functions are available for history, paste, run, include and many more topics, they are prefixed with “%” and self-documented in the shell.

All that sounds great! But what has to do with QGIS?

I personally find the QGIS python console lacks some important features, expecially with the autocompletion (autosuggest). What’s the purpose of having autocompletion when most of the times you just get a traceback because the method the autocompleter proposed you is that of another class? My brain is too small and too old to keep the whole API docs in my mind, autocompletion is useful when it’s intelligent enough to tell between methods and properties of the instance/class on which you’re operating.

Another problem is that the API is very far from being “pythonic” (this isn’t anyone’s fault, it’s just how SIP works), here’s an example (suppose we want the SRID of the first layer):

core.QgsMapLayerRegistry.instance().mapLayers().value()[0].crs().authid()
# TAB completion stops working here^

TAB completion stop working at the first parenthesis :(

What if all those getter would be properties?

registry = core.QgsMapLayerRegistry.instance()
# With a couple of TABs without having to remember any method or function name!
registry.p_mapLayers.values()
[<qgis._core.QgsRasterLayer at 0x7f07dff8e2b0>,
 <qgis._core.QgsRasterLayer at 0x7f07dff8ef28>,
 <qgis._core.QgsVectorLayer at 0x7f07dff48c30>,
 <qgis._core.QgsVectorLayer at 0x7f07dff8e478>,
 <qgis._core.QgsVectorLayer at 0x7f07dff489d0>,
 <qgis._core.QgsVectorLayer at 0x7f07dff48770>]

layer = registry.p_mapLayers.values()[0]

layer.p_c ---> TAB!
layer.p_cacheImage            layer.p_children       layer.p_connect       
layer.p_capabilitiesString    layer.p_commitChanges  layer.p_crs           
layer.p_changeAttributeValue  layer.p_commitErrors   layer.p_customProperty

layer.p_crs.p_ ---> TAB!
layer.p_crs.p_authid               layer.p_crs.p_postgisSrid      
layer.p_crs.p_axisInverted         layer.p_crs.p_projectionAcronym
layer.p_crs.p_description          layer.p_crs.p_recentProjections
layer.p_crs.p_ellipsoidAcronym     layer.p_crs.p_srsid            
layer.p_crs.p_findMatchingProj     layer.p_crs.p_syncDb           
layer.p_crs.p_geographicCRSAuthId  layer.p_crs.p_toProj4          
layer.p_crs.p_geographicFlag       layer.p_crs.p_toWkt            
layer.p_crs.p_isValid              layer.p_crs.p_validationHint   
layer.p_crs.p_mapUnits    

layer.p_crs.p_authid
Out[]: u'EPSG:4326'

This works with a quick and dirty hack: propertize that adds a p_... property to all methods in a module or in a class that

  1. do return something
  2. do not take any argument (except self)

this leaves the original methods untouched (in case they were overloaded!) still allowing full introspection and TAB completion with a pythonic interface.

A few methods are still not working with propertize, so far singleton methods like instance() are not passing unit tests.

IPyConsole: a QGIS IPython plugin

If you’ve been reading up to this point you probably can’t wait to start using IPython inside your beloved QGIS (if that’s not the case, please keep reading the previous paragraphs carefully until your appetite is grown!).

An experimental plugin that brings the magic of IPython to QGIS is now available:
Download IPyConsole


Please start exploring QGIS objects and classes and give me some feedback!


IPyConsole QGIS plugin

Installation notes

You basically need only a working IPython installation, IPython is available for all major platforms and distributions, please refer to the official documentation.


QGIS Server: GetFeatureInfo with STYLE

There have been some requests in the past about custom CSS for html GetFeatureInfo responses from QGIS Server.

Currently, the HTML response template is hardcoded and there is no way to customize it, the Python plugin support introduced with the latest version of QGIS Server provides an easy way to add some custom CSS rules or even provide custom templates.

To get you started, I’ve added a new filter to my example  HelloServer plugin:

import os

from qgis.server import *
from qgis.core import *
from PyQt4.QtCore import *
from PyQt4.QtGui import *


class GetFeatureInfoCSSFilter(QgsServerFilter):

    def __init__(self, serverIface):
        super(GetFeatureInfoCSSFilter, self).__init__(serverIface)

    def requestReady(self):
        """Nothing to do here, but it would be the ideal point
        to alter request **before** it gets processed, for example
        you could set INFO_FORMAT to text/xml to get XML instead of
        HTML in responseComplete"""
        pass

    def responseComplete(self):
        request = self.serverInterface().requestHandler()
        params = request.parameterMap( )
        if (params.get('SERVICE').upper() == 'WMS' \
                and params.get('REQUEST', '').upper() == 'GETFEATUREINFO' \
                and params.get('INFO_FORMAT', '').upper() == 'TEXT/HTML' \
                and not request.exceptionRaised() ):
            body = request.body()
            body.replace('<BODY>', """<BODY><STYLE type="text/css">* {font-family: arial, sans-serif; color: blue;}</STYLE>""")
            # Set the body
            request.clearBody()
            request.appendBody(body)

This filter is pretty simple, if the request is a WMS GetFeatureInfo with HTML format, it injects a STYLE tag into the HTML HEAD.

Here is the output with blue color and arial fonts applied:

getfeatureinfo styled response

As an exercise left to the reader, you can also intercept the call in requestReady(self), change the INFO_FORMAT to text/xml and then do some real templating, for example by using XSLT or by parsing the XML and injecting the values into a custom template.

How to read a raster cell with Python QGIS and GDAL

QGIS and GDAL both have Python bindings, you can use both libraries to read a value from a raster cell, since QGIS uses GDAL libraries under the hood, we can expect to read the exact same value with both systems.


Here is a short example about how to do it with the two different approaches, we assume that you are working inside the QGIS python console and the project has a raster file loaded, but with just a few modifications, the example can also be run from a standard python console.

The example raster layer is a DTM with 1000 cells width and 2000 cells height, we want to read the value at the cell with coordinates x = 500 and y = 1000.

# First layer in QGIS project is a DTM 2 bands raster
from osgeo import gdal
# You need this to convert raw values readings from GDAL
import struct

# Read the cell with this raster coordinates
x = 500
y = 1000

# Get the map layer registry
reg = QgsMapLayerRegistry.instance()

# Get the first layer (the DTM raster)
qgis_layer = reg.mapLayers().values()[0]

# Open the raster with GDAL
gdal_layer = gdal.Open(rlayer.source())

"""
Fetches the coefficients for transforming between pixel/line (P,L) raster space, 
and projection coordinates (Xp,Yp) space.
    Xp = padfTransform[0] + P*padfTransform[1] + L*padfTransform[2];
    Yp = padfTransform[3] + P*padfTransform[4] + L*padfTransform[5];
In a north up image, padfTransform[1] is the pixel width, and padfTransform[5] 
is the pixel height. The upper left corner of the upper left pixel is 
at position (padfTransform[0],padfTransform[3]).
"""
gt = gldal_layer.GetGeoTransform()

# o:origin, r:rotation, s:size
xo, xs, xr, yo, yr, ys = gt

# Read band 1 at the middle of the raster ( x = 500, y = 1000)
band = gdal_layer.GetRasterBand(1)
gdal_value = struct.unpack('f', band.ReadRaster(x, y, 1, 1, buf_type=band.DataType))[0]

xcoo = xo + xs * x + xr * y
ycoo = yo + yr * x + ys * y

# Read the value with QGIS, we must pass the map coordinates
# and the exact extent = 1 cell size
qgis_value = qgis_layer.dataProvider().identify(QgsPoint(xcoo, ycoo), \
    QgsRaster.IdentifyFormatValue, \
    theExtent=QgsRectangle( xcoo , ycoo, xcoo + xs, ycoo + ys) )\
    .results()[1]

assert(gdal_value == qgis_value)

QGIS Web Client GetFeatureInfo formatters

The transformation of a value to an URL address is done automatically in a few cases (this feature is currently undocumented): for example when the column value starts with http or https or a string contained in mediaurl parameter defined in Globaloptions.js.
But if you want more, then you need a real formatting function that given the value (and maybe some more information bits about where the values comes from) returns a properly formatted hyperlink or whatever else you need.

This new feature is currently available in my customformatters branch, and an example formatter is provided in Globaloptions.js and implemented for the helloworld.qgs sample project.

Here is how it works:

// Custom WMS GetFeatureInfo results formatters: you can define custom
// filter functions to apply custom formatting to values coming from
// GetFeatureInfo requests when the user use the "identify" tool.
// The same formatting functions can be normally also used as "renderer"
// function passed to column configuration in the "gridColumns" property
// of the grid configuration of the WMS GetFeatureInfo search panels.

// Example formatter, takes the value, the column name and the layer name,
// normally only the first parameter is used.
function customURLFormatter(attValue, attName, layerName){
    return '<a href="http://www.google.com/search?q=' + encodeURI(attValue) + '" target="_blank">' + attValue + '</a>';
}

// Formatters configuration
var getFeatureInfoCustomFormatters = {
    'Country': { // Layer name
        'name': customURLFormatter // Can be an array if you need multiple formatters
    }
};

If you also want to apply the same formatting to result grids coming from the search panels, you can use the very same functions passing the function in the renderer attribute of the datagrid, as shown around line 18 in the following snippet:

var simpleWmsSearch = {
  title: "Search continent",
  query: 'simpleWmsSearch',
  useWmsRequest: true,
  queryLayer: "Country",
  formItems: [
    {
      xtype: 'textfield',
      name: 'name',
      fieldLabel: "Name",
      allowBlank: false,
      blankText: "Please enter a name (e.g. 'africa')",
      filterOp: "="
    }
  ],
  gridColumns: [
    // Apply the formatter as the "renderer"
    {header: 'Name', dataIndex: 'name', menuDisabled: 'true', renderer: customURLFormatter}
  ],
//  highlightFeature: true,
//  highlightLabel: 'name',
  selectionLayer: 'Country',
  selectionZoom: 0,
  doZoomToExtent: true
};

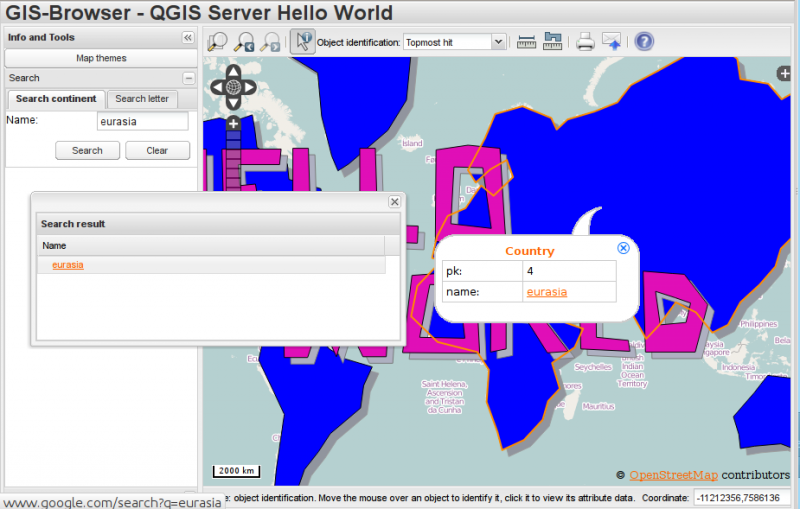
The result of the formatter applied to both views is in the following picture:

Qgis Web Client Formatters

QGIS server python plugins tutorial

This is the second article about python plugins for QGIS server, see also the introductory article posted a few days ago.

In this post I will introduce the helloServer example plugin that shows some common implementation patterns exploiting the new QGIS Server Python Bindings API.

Server plugins and desktop interfaces

Server plugins can optionally have a desktop interface exactly like all standard QGIS plugins.

A typical use case for a server plugin that also has a desktop interface is to allow the users to configure the server-side of the plugin from QGIS desktop, this is the same principle of configuring WMS/WFS services of QGIS server from the project properties.

The only important difference it that while the WMS/WFS services configuration is stored in the project file itself, the plugins can store and access project data but not to the user’s settings (because the server process normally runs with a different user). For this reason, if you want to share configuration settings between the server and the desktop, provided that you normally run the server with a different user, paths and permissions have to be carefully configured to grant both users access to the shared data.


Server configuration

This is an example configuration for Apache, it covers both FCGI and CGI:

  ServerAdmin webmaster@localhost
  # Add an entry to your /etc/hosts file for xxx localhost e.g.
  # 127.0.0.1 xxx
  ServerName xxx
    # Longer timeout for WPS... default = 40
    FcgidIOTimeout 120 
    FcgidInitialEnv LC_ALL "en_US.UTF-8"
    FcgidInitialEnv PYTHONIOENCODING UTF-8
    FcgidInitialEnv LANG "en_US.UTF-8"
    FcgidInitialEnv QGIS_DEBUG 1
    FcgidInitialEnv QGIS_CUSTOM_CONFIG_PATH "/home/xxx/.qgis2/"
    FcgidInitialEnv QGIS_SERVER_LOG_FILE /tmp/qgis.log
    FcgidInitialEnv QGIS_SERVER_LOG_LEVEL 0
    FcgidInitialEnv QGIS_OPTIONS_PATH "/home/xxx/public_html/cgi-bin/"
    FcgidInitialEnv QGIS_PLUGINPATH "/home/xxx/.qgis2/python/plugins"
    FcgidInitialEnv LD_LIBRARY_PATH "/home/xxx/apps/lib"

    # For simple CGI: ignored by fcgid
    SetEnv QGIS_DEBUG 1
    SetEnv QGIS_CUSTOM_CONFIG_PATH "/home/xxx/.qgis2/"
    SetEnv QGIS_SERVER_LOG_FILE /tmp/qgis.log 
    SetEnv QGIS_SERVER_LOG_LEVEL 0
    SetEnv QGIS_OPTIONS_PATH "/home/xxx/public_html/cgi-bin/"
    SetEnv QGIS_PLUGINPATH "/home/xxx/.qgis2/python/plugins"
    SetEnv LD_LIBRARY_PATH "/home/xxx/apps/lib"

    RewriteEngine On
    
        RewriteCond %{HTTP:Authorization} .
        RewriteRule .* - [E=HTTP_AUTHORIZATION:%{HTTP:Authorization}]
    

  ScriptAlias /cgi-bin/ /home/xxx/apps/bin/
  <Directory "/home/xxx/apps/bin/">
    AllowOverride All
    Options +ExecCGI -MultiViews +FollowSymLinks
    Require all granted  

  ErrorLog ${APACHE_LOG_DIR}/xxx-error.log
  CustomLog ${APACHE_LOG_DIR}/xxx-access.log combined


In this particular example, I’m using a QGIS server built from sources and installed in /home/xxx/apps/bin the libraries are in /home/xxx/apps/lib and LD_LIBRARY_PATH poins to this location.
QGIS_CUSTOM_CONFIG_PATH tells the server where to search for QGIS configuration (for example qgis.db).
QGIS_PLUGINPATH is searched for plugins as start, your server plugins must sit in this directory, while developing you can choose to use the same directory of your QGIS desktop installation.
QGIS_DEBUG set to 1 to enable debug and logging.

Anatomy of a server plugin

For a plugin to be seen as a server plugin, it must provide correct metadata informations and a factory method:

Plugin metadata

A server enabled plugins must advertise itself as a server plugin by adding the line

server=True

in its metadata.txt file.

The serverClassFactory method

A server enabled plugins is basically just a standard QGIS Python plugins that provides a serverClassFactory(serverIface) function in its __init__.py. This function is invoked once when the server starts to generate the plugin instance (it’s called on each request if running in CGI mode: not recommended) and returns a plugin instance:

def serverClassFactory(serverIface):
    from HelloServer import HelloServerServer
    return HelloServerServer(serverIface)

You’ll notice that this is the same pattern we have in “traditional” QGIS plugins.

Server Filters

A server plugin typically consists in one or more callbacks packed into objects called QgsServerFilter.

Each QgsServerFilter implements one or all of the following callbacks:

The following example implements a minimal filter which prints HelloServer! in case the SERVICE parameter equals to “HELLO”.

from qgis.server import *
from qgis.core import *

class HelloFilter(QgsServerFilter):

    def __init__(self, serverIface):
        super(HelloFilter, self).__init__(serverIface)    

    def responseComplete(self):        
        request = self.serverInterface().requestHandler()
        params = request.parameterMap()
        if params.get('SERVICE', '').upper() == 'HELLO':
            request.clearHeaders()
            request.setHeader('Content-type', 'text/plain')
            request.clearBody()
            request.appendBody('HelloServer!')

The filters must be registered into the serverIface as in the following example:

class HelloServerServer:
    def __init__(self, serverIface):
        # Save reference to the QGIS server interface
        self.serverIface = serverIface
        serverIface.registerFilter( HelloFilter, 100 )          

The second parameter of registerFilter allows to set a priority which defines the order for the callbacks with the same name (the lower priority is invoked first).

Full control over the flow

By using the three callbacks, plugins can manipulate the input and/or the output of the server in many different ways. In every moment, the plugin instance has access to the QgsRequestHandler through the QgsServerInterface, the QgsRequestHandler has plenty of methods that can be used to alter the input parameters before entering the core processing of the server (by using requestReady) or after the request has been processed by the core services (by using sendResponse).

The following examples cover some common use cases:

Modifying the input

The example plugin contains a test example that changes input parameters coming from the query string, in this example a new parameter is injected into the (already parsed) parameterMap, this parameter is then visible by core services (WMS etc.), at the end of core services processing we check that the parameter is still there.

from qgis.server import *
from qgis.core import *

class ParamsFilter(QgsServerFilter):

    def __init__(self, serverIface):
        super(ParamsFilter, self).__init__(serverIface)

    def requestReady(self):
        request = self.serverInterface().requestHandler()
        params = request.parameterMap( )
        request.setParameter('TEST_NEW_PARAM', 'ParamsFilter')

    def responseComplete(self):
        request = self.serverInterface().requestHandler()
        params = request.parameterMap( )
        if params.get('TEST_NEW_PARAM') == 'ParamsFilter':
            QgsMessageLog.logMessage("SUCCESS - ParamsFilter.responseComplete", 'plugin', QgsMessageLog.INFO)
        else:
            QgsMessageLog.logMessage("FAIL    - ParamsFilter.responseComplete", 'plugin', QgsMessageLog.CRITICAL)

This is an extract of what you see in the log file:

src/core/qgsmessagelog.cpp: 45: (logMessage) [0ms] 2014-12-12T12:39:29 plugin[0] HelloServerServer - loading filter ParamsFilter
src/core/qgsmessagelog.cpp: 45: (logMessage) [1ms] 2014-12-12T12:39:29 Server[0] Server plugin HelloServer loaded!
src/core/qgsmessagelog.cpp: 45: (logMessage) [0ms] 2014-12-12T12:39:29 Server[0] Server python plugins loaded
src/mapserver/qgsgetrequesthandler.cpp: 35: (parseInput) [0ms] query string is: SERVICE=HELLO&request=GetOutput
src/mapserver/qgshttprequesthandler.cpp: 547: (requestStringToParameterMap) [1ms] inserting pair SERVICE // HELLO into the parameter map
src/mapserver/qgshttprequesthandler.cpp: 547: (requestStringToParameterMap) [0ms] inserting pair REQUEST // GetOutput into the parameter map
src/mapserver/qgsserverfilter.cpp: 42: (requestReady) [0ms] QgsServerFilter plugin default requestReady called
src/core/qgsmessagelog.cpp: 45: (logMessage) [0ms] 2014-12-12T12:39:29 plugin[0] HelloFilter.requestReady
src/mapserver/qgis_map_serv.cpp: 235: (configPath) [0ms] Using default configuration file path: /home/xxx/apps/bin/admin.sld
src/mapserver/qgshttprequesthandler.cpp: 49: (setHttpResponse) [0ms] Checking byte array is ok to set...
src/mapserver/qgshttprequesthandler.cpp: 59: (setHttpResponse) [0ms] Byte array looks good, setting response...
src/core/qgsmessagelog.cpp: 45: (logMessage) [0ms] 2014-12-12T12:39:29 plugin[0] HelloFilter.responseComplete
src/core/qgsmessagelog.cpp: 45: (logMessage) [0ms] 2014-12-12T12:39:29 plugin[0] SUCCESS - ParamsFilter.responseComplete
src/core/qgsmessagelog.cpp: 45: (logMessage) [0ms] 2014-12-12T12:39:29 plugin[0] RemoteConsoleFilter.responseComplete
src/mapserver/qgshttprequesthandler.cpp: 158: (sendResponse) [0ms] Sending HTTP response
src/core/qgsmessagelog.cpp: 45: (logMessage) [0ms] 2014-12-12T12:39:29 plugin[0] HelloFilter.sendResponse

On line 13 the “SUCCESS” string indicates that the plugin passed the test.

The same technique can be exploited to use a custom service instead of a core one: you could for example skip a WFS SERVICE request or any other core request just by changing the SERVICE parameter to something different and the core service will be skipped, then you can inject your custom results into the output and send them to the client (this is explained here below).

Changing or replacing the output

The watermark filter example shows how to replace the WMS output with a new image obtained by adding a watermark image on the top of the WMS image generated by the WMS core service:

import os

from qgis.server import *
from qgis.core import *
from PyQt4.QtCore import *
from PyQt4.QtGui import *


class WatermarkFilter(QgsServerFilter):

    def __init__(self, serverIface):
        super(WatermarkFilter, self).__init__(serverIface)

    def responseComplete(self):
        request = self.serverInterface().requestHandler()
        params = request.parameterMap( )
        # Do some checks
        if (request.parameter('SERVICE').upper() == 'WMS' \
                and request.parameter('REQUEST').upper() == 'GETMAP' \
                and not request.exceptionRaised() ):
            QgsMessageLog.logMessage("WatermarkFilter.responseComplete: image ready %s" % request.infoFormat(), 'plugin', QgsMessageLog.INFO)
            # Get the image
            img = QImage()
            img.loadFromData(request.body())
            # Adds the watermark
            watermark = QImage(os.path.join(os.path.dirname(__file__), 'media/watermark.png'))
            p = QPainter(img)
            p.drawImage(QRect( 20, 20, 40, 40), watermark)
            p.end()
            ba = QByteArray()
            buffer = QBuffer(ba)
            buffer.open(QIODevice.WriteOnly)
            img.save(buffer, "PNG")
            # Set the body
            request.clearBody()
            request.appendBody(ba)

In this example the SERVICE parameter value is checked and if the incoming request is a WMS GETMAP and no exceptions have been set by a previously executed plugin or by the core service (WMS in this case), the WMS generated image is retrieved from the output buffer and the watermark image is added. The final step is to clear the output buffer and replace it with the newly generated image. Please note that in a real-world situation we should also check for the requested image type instead of returning PNG in any case.

The power of python

The examples above are just meant to explain how to interact with QGIS server python bindings but server plugins have full access to all QGIS python bindings and to thousands of python libraries, what you can do with python server plugins is just limited by your imagination!


See all QGIS Server related posts

QGIS server python plugins


Today it’s a great day for QGIS Server: Python plugins, the project that took me busy during the past two months, has been merged to master and will be available starting with the next QGIS release.

The project has been discussed and approved in Essen during the last QGIS HF (see my presentation about server plugins), thanks to the input and suggestions coming from Marco Hugentobler and Martin Dobias it is now implemented in the more complete and flexible way.

In this article I will introduce the core concepts and the main features of python plugins for QGIS server.

QGIS server plugins architecture

QGIS server provides some core services: WFS, WMS, WCS. What we wanted to achieve was a system to easily add new services and modify existing services through python plugins.

Mi first experiments were limited to a 404 handler that intercepts unhandled requests and hooks into python plugins capturing every stdout output, this was indeed not enough flexible for a full fledged plugins implementation.

The main loop

QGIS server is not different from most web services implementations: it listens for incoming requests, parses the URL query string parameters and returns its output accordingly to the incoming request.

The standard loop before introducing python plugins looked like the following:

  • Get the request
    • create GET/POST/SOAP request handler
    • if SERVICE is WMS/WFS/WCS
      • create WMS/WFS/WCS server passing in request handler
        • call server’s executeRequest()
          • call request handler output method
    • else Exception

Plugins come into play

Server python plugins are loaded once when the FCGI application starts and they should register one or more QgsServerFilter (from this point, you might find useful a quick look to the server plugins API docs). Each filter should implement at least one of three callbacks (aka: hooks):

    1. requestReady
    2. sendResponse
    3. responseComplete

All filters have access to the request/response object (QgsRequestHandler) and can manipulate all its properties (input/output) and can raise exceptions (while in a quite particular way as we’ll see below).

Here is a pseudo code showing how and when the filter’s callbacks are called:

  • Get the request
    • create GET/POST/SOAP request handler
    • pass request to serverIface
    • call plugins requestReady filters
    • if there is not a response
      • if SERVICE is WMS/WFS/WCS
        • create WMS/WFS/WCS server
          • call server’s executeRequest and possibily call sendResponse plugin filters when streaming output or store the byte stream output and content type in the request handler
      • call plugins responseComplete filters
    • call plugins sendResponse filters

    • request handler output the response

requestReady

This is called when the request is ready: incoming URL and data have been parsed and before entering the core services (WMS, WFS etc.) switch, this is the point where you can manipulate the input and perform actions like:

  • authentication/authorization
  • redirects
  • add/remove certain parameters (typenames for example)
  • raise exceptions

You could even substitute a core service completely by changing SERVICE parameter and hence bypassing the core service completely (not that this make much sense though).

Implementation details of server plugins will be discussed in depth in a future article, by now please refer to  QGIS HelloServer plugin for a complete implementation of the examples and methods cited in this article.


sendResponse

This is called whenever output is sent to FCGI stdout (and from there, to the client), this is normally done after core services have finished their process and after responseComplete hook was called, but in a few cases XML can become so huge that a streaming XML implementation was needed (WFS GetFeature is one of them), in this case, sendResponse is called multiple times before the response is complete (and before responseComplete is called). The obvious consequence is that sendResponse is normally called once but might be exceptionally called multiple times and in that case (and only in that case) it is also called before responseComplete.

SendResponse is the best place for direct manipulation of core service’s output and while responseComplete is typically also an option, sendResponse is the only viable option  in case of streaming services.

responseComplete

This is called once when core services (if hit) finish their process and the request is ready to be sent to the client. As discussed above, this is  normally called before sendResponse except for streaming services (or other plugin filters) that might have called sendResponse earlier.

responseComplete is the ideal place to provide new services implementation (WPS or custom services) and to perform direct manipulation of the output coming from core services (for example to add a watermark upon a WMS image).

Raising exception from a plugin

Some work has still to be done on this topic: the current implementation can distinguish between handled and unhandled exceptions by setting a QgsRequestHandler property to an instance of QgsMapServiceException, this way the main C++ code can catch handled python exceptions and ignore unhandled exceptions (or better: log them).

This approach basically works but it does not satisfy my pythonic way of handle exceptions: I would rather prefer to raise exceptions from python code to see them bubbling up into C++ loop for being handled there.

Conclusions

The new plugin system is very flexible and allows for basic input/output (i.e. request/response) manipulation and for new services implementation while it remains unobtrusive and has negligible impact on performances, in the next article I will discuss server plugin implementation in depth.


See also the second part of this article.

See all QGIS Server related posts

QGIS and QT: getting ready for HiDPI screens


A few months ago I changed my laptop for a Dell M3800 with an amazing 3840×2160 15,6″ display, that means a crazy 282 dpi resolution. I won’t discuss the problems I had to face and resolve to make this thing usable with Kubuntu 14.04 because they are yet some useful resource on the net: https://wiki.archlinux.org/index.php/HiDPI. The executive summary is that KDE and QT/GTK applications work pretty well and without serious usability problems: Firefox, Chrome, Thunderbird have no problems at all if we exclude some really minor glitches like pixelated or too big icons in a few occasions (see the example below).

Small problem with a big icon in Firefox

Small problem with a big icon in Firefox @ 282 dpi


QGIS on HiDPI

Unfortunately, QGIS has some serious usability problems on such an high resolution screen and I spent a few hours try to understand how is it possible to fix them and what should be done to avoid them in the first place.

The reason behind is that HiDPI screens usage is increasing and we can expect they’ll gain more and more market share expecially among professional users and GIS users are mostly professional users!

To give you a quick taste of the kind of problems that have to be addressed, take a look at the pictures below.

QGIS statusbar: unreadable on HiDPI

QGIS statusbar: unreadable on HiDPI

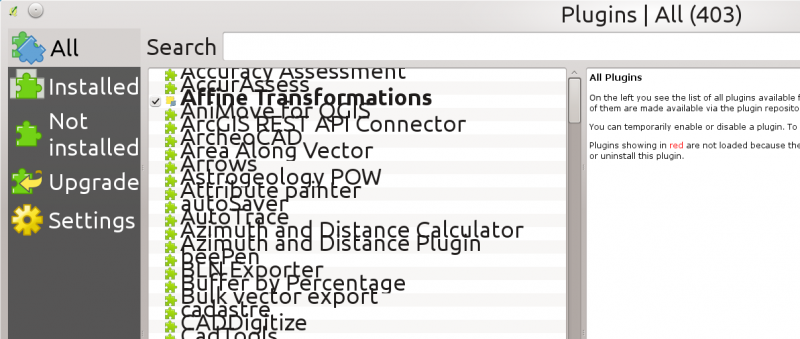
qgis-hidpi-pluginmanager

Plugin manager rows are too low and left tab column has a 200 px max width

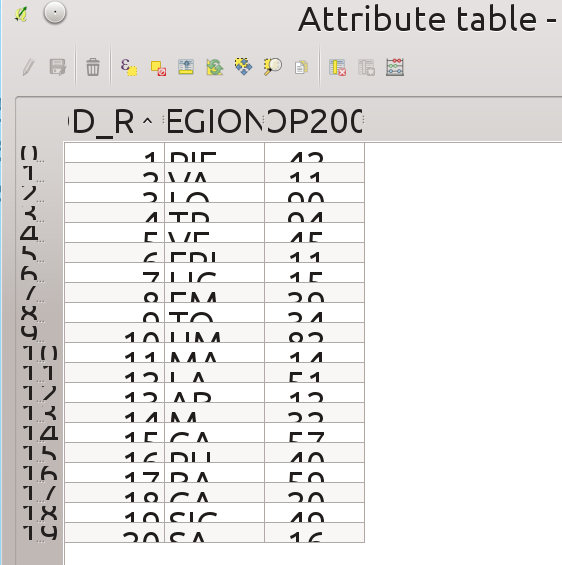
qgis-hidpi-attributetable-issue

Attribute table rows are too low and icons are too small


I tried to fix some of the issues shown above and this is the resulting commit: https://github.com/qgis/QGIS/pull/2014/commits, QGIS run on different platforms and I wasn’t able to test it on all of them, I hope the fixes will not cause problems on platforms and screen sizes other than I could test myself.

But the purpose of this notes it to list some humble tips that could be useful to avoid or fix these kind of problem.

Tip #1: Avoid hardcoded pixel values!

Web developers started the fight with HiDPI screens a few years ago, (buzz)words like responsive design and the move towards mobile platforms forced the developers to consider what a pixel really is in a web context, and the obvious conclusion was that a pixel is not a pixel! Please see the following resources if you’re curious and not familiar with these concepts:

The most obvious and efficient solution for the web browser was to change the concept of pixel from a physical to a logical unit.

Unfortunately, at least in QT the pixel is still a physical pixel, this means the we must avoid to specify the size of GUI elements in pixel units.


Qt documentation has a page about Developing Scalable UIs.

This blog page also has some useful tips: HighDPI in KDE Applications.


A collection of useful tips for QT developers can be found in the HiDPI KDE wiki page:

  • Do not use QFont setPixelSize but use setPointSize, and better, avoid setting a custom size at all.
  • Try to stick with the possibilities from KGlobalSettings (KGlobalSettings::generalFont(), KGlobalSettings::largeFont() etc.)
  • Do not use a fixed QSize with images (QPixmap, QIcon…)
  • Do not use KIconLoader::StdSizes. Even though it would sound like a good idea to use it, it suffers from the same issue: Hardcoded pixel sizes.
  • To get a user’s configured icon size, include and use the IconSize function (note: this is not a member function): IconSize(KIconLoader::Small). However, be aware that the user might be able to mess up your apps look by setting some insane values here.
  • If you use svg images for icons (for example in plasma) get the standard sizes from some theme elements (e.g. buttons, fonts) and scale your images accordingly. (Don’t do this when using pixel based images)

Some of the tips above are clearly related to KDE, but I’ve found them still useful to get the overall picture.

Coming to QGIS specific problems, there are still many that have to be resolved, but the overall application is somewhat already useable. The issues I have addressed were easy picks and most of the times it was enough to remove the hardcoded values and rely to QT default sizing mechanisms to get a good result, such as in this case (from src/app/qgisapp.cpp):

//mCoordsLabel->setMaximumHeight( 20 );

Things were harder with plugin manager, the MVC delegate that draws the plugins rows contained a lot of hardcoded metrics for icon and text placement, the solution was to change the values to be relative to the configured font height, see all details in my PR to solve plugin manager HiDPI issues


This is generally a good idea: we must not make any assumption about the size of the fonts the user will be using.

Tip #2: force resize of dialogs

This is something that you should be aware of if you are using an HiDPI screen to build your GUI.

I first encountered this problem when developing my IPyConsole QGIS python plugin: I designed the GUI with designer-qt4 on my HiDPI screen and forget about testing it on “normal” screens, the result is that the window size of the settings dialog (a relatively small dialog) was set by designer at a crazy value of 1115×710. It was impossible from QT Designer to set a small size by dragging the window corner with the mouse: the application automatically reset the dialog size to the calculated minimum size (which on an HiDPI screen was that huge  1115×710).

The solution in that case was to manually alter the Ui_SettingsDialog.ui file to set a small size (say 300×200) and call adjustSize()

self.settingsDlg.show()
# This will adjust the size according to font/dpi:
self.settingsDlg.adjustSize()
result = self.settingsDlg.exec_()

Tip #3: Icons

I haven’t yet come to a solution for the right size for icons (suggestions welcome!). Of course the first point is to move all icons to SVG, the process has already started but many icons have still to be converted.

But having scalable icons is not enough: we must make sure that the icon size is not hardcoded in the GUI, there are some settings for icon size in QGIS options dialog and that might be the right point to start but we probably need more than one size:

  • size of toolbar icons
  • size of plugin icons
  • size for smaller toolbars (attribute table, python console vertical sidebar to cite a few)

Maybe a 3-sizes approach would be fine (big, medium, small), for an easy configuration, some pre-defined values for HiDPI / 96dpi and HD screens would be useful.

To get an idea of what the attribute table looks like right now on an HiDPI screen, look at the picture below, scaled to 96dpi:


qgis-hidpi-attributetable-small-icons-issue96dpi

Icons are too small on an HiDPI screen


Conclusions

There is still much work to do in order to have an usable interface on HiDPI screens, some issues can be easily solved by avoiding hardcoded sizes and leaving to QT the heavy job of calculating GUI widget sizes.

It’s important that developers (not only core developers but plugin developers too) are aware of this kind of issues and how to avoid them in the first place.

HiDPI screens are just around the corner and it’s better to be prepared.


A final note about QT5, it’s not clear to me if and when the move to QT5 will be done and moreover if that move will automatically solve HiDPI issues due to a better HiDPI support, but I’m afraid it won’t.


Python SIP C++ bindings tutorial

Since QGIS uses QT libraries, SIP is the natural choice for creating the bindings.

Here are some random notes about this journey into SIP and Python bindings, I hope you’ll find them useful!
We will create a sample C++ library, a simple C++ program to test it and finally, the SIP configuration file and the python module plus a short program to test it.

Create the example library

FIrst we need a C++ library, following  the tutorial on the official SIP website  I created a simple library named hellosip:


$ mkdir hellosip
$ cd hellosip
$ touch hellosip.h hellosip.cpp Makefile.lib

This is the content of the header file hellosip.h:

#include <string>

using namespace std;

class HelloSip {
    const string the_word;
public:
    // ctor
    HelloSip(const string w);
    string reverse() const;
};

This is the implementation in file hellosip.cpp , the library just reverse a string, nothing really useful.

#include "hellosip.h"
#include <string>

HelloSip::HelloSip(const string w): the_word(w)
{
}

string HelloSip::reverse() const
{
    string tmp;
    for (string::const_reverse_iterator rit=the_word.rbegin(); rit!=the_word.rend(); ++rit)
        tmp += *rit;
    return tmp;
}


Compiling and linking the shared library

Now, its time to compile the library, g++ must be invoked with -fPIC option in order to generate Position Independent Code, -g tells the compiler to generate debug symbols and it is not strictly necessary if you don’t need to debug the library:

g++ -c -g -fPIC hellosip.cpp -o hellosip.o

The linker needs a few options to create a dynamically linked Shared Object (.so) library, first -shared which tells gcc to create a shared library, then the -soname which is the library version name, last -export_dynamic that is also not strictly necessary but can be useful for debugging in case the library is dynamically opened (with dlopen) :

g++ -shared -Wl,-soname,libhellosip.so.1  -g -export-dynamic -o libhellosip.so.1  hellosip.o

At the end of this process, we should have a brand new libhellosip.so.1 sitting in the current directory.

For more informations on shared libraries under linux you can read TLDP chapter on this topic.


Using the library with C++

Before starting the binding creation with SIP, we want to test the new library with a simple C++ program stored in a new cpp file: hellosiptest.cpp:

#include "hellosip.h"
#include <string>
using namespace std;
// Prints True if the string is correctly reversed
int main(int argc, char* argv[]) {
  HelloSip hs("ciao");
  cout << ("oaic" == hs.reverse() ? "True" : "False") << endl;
  return 0;
}

To compile the program we use the simple command:

g++ hellosiptest.cpp -g -L.  -lhellosip -o hellosiptest

which fails with the following error:

/usr/bin/ld: cannot find -lhellosip
collect2: error: ld returned 1 exit status

For this tutorial, we are skipping the installation part, that would have created proper links from the base soname, we are doing it now with:

ln -s libhellosip.so.1 libhellosip.so

The compiler should now be happy and produce an hellosiptest executable, that can be tested with:

$ ./hellosiptest
True

If we launch the program we might see a new error:

./hellosiptest: error while loading shared libraries: libhellosip.so.1: cannot open shared object file: No such file or directory

This is due to the fact that we have not installed our test library system-wide and the operating system is not able to locate and dynamically load the library, we can fix it in the current shell by adding the current path to the LD_LIBRARY_PATH environment variable which tells the operating system which directories have to be searched for shared libraries. The following commands will do just that:

export LD_LIBRARY_PATH=`pwd`

Note that this environment variable setting is “temporary” and will be lost when you exit the current shell.


SIP bindings

Now that we know that the library works we can start with the bindings, SIP needs an interface header file with the instructions to create the bindings, its syntax resembles that of a standard C header file with the addition of a few directives, it contains (among other bits) the name of the module and the classes and methods to export.

The SIP header file hellosip.sip contains two blocks of instructions: the class definition that ends around line 15 and an additional %MappedType block that specifies how the std::string type can be translated from/to Python objects, this block is not normally necessary until you stick standard C types. You will notice that the class definition part is quite similar to the C++ header file hellosip.h:

// Define the SIP wrapper to the hellosip library.

%Module hellosip

class HelloSip {

%TypeHeaderCode
#include <hellosip.h>
%End

public:
    HelloSip(const std::string w);
    std::string reverse() const;
};

// Creates the mapping for std::string
// From: http://www.riverbankcomputing.com/pipermail/pyqt/2009-July/023533.html

%MappedType std::string
{
%TypeHeaderCode
#include 
%End

%ConvertFromTypeCode
    // convert an std::string to a Python (unicode) string
    PyObject* newstring;
    newstring = PyUnicode_DecodeUTF8(sipCpp->c_str(), sipCpp->length(), NULL);
    if(newstring == NULL) {
        PyErr_Clear();
        newstring = PyString_FromString(sipCpp->c_str());
    }
    return newstring;
%End

%ConvertToTypeCode
    // Allow a Python string (or a unicode string) whenever a string is
    // expected.
    // If argument is a Unicode string, just decode it to UTF-8
    // If argument is a Python string, assume it's UTF-8
    if (sipIsErr == NULL)
        return (PyString_Check(sipPy) || PyUnicode_Check(sipPy));
    if (sipPy == Py_None) {
        *sipCppPtr = new std::string;
        return 1;
    }
    if (PyUnicode_Check(sipPy)) {
        PyObject* s = PyUnicode_AsEncodedString(sipPy, "UTF-8", "");
        *sipCppPtr = new std::string(PyString_AS_STRING(s));
        Py_DECREF(s);
        return 1;
    }
    if (PyString_Check(sipPy)) {
        *sipCppPtr = new std::string(PyString_AS_STRING(sipPy));
        return 1;
    }
    return 0;
%End
};

At this point we could have run the sip command by hand but the documentation suggests to use the python module sipconfig that, given a few of configuration variables, automatically creates the Makefile for us, the file is by convention named configure.py:

import os
import sipconfig

basename = "hellosip"

# The name of the SIP build file generated by SIP and used by the build
# system.
build_file = basename + ".sbf"

# Get the SIP configuration information.
config = sipconfig.Configuration()

# Run SIP to generate the code.
os.system(" ".join([config.sip_bin, "-c", ".", "-b", build_file, basename + ".sip"]))

# Create the Makefile.
makefile = sipconfig.SIPModuleMakefile(config, build_file)

# Add the library we are wrapping.  The name doesn't include any platform
# specific prefixes or extensions (e.g. the "lib" prefix on UNIX, or the
# ".dll" extension on Windows).
makefile.extra_libs = [basename]

# Search libraries in current directory
makefile.extra_lflags= ['-L.']

# Generate the Makefile itself.
makefile.generate()

We now have a Makefile ready to build the bindings, just run make to build the library. If everything goes right you will find a new hellosip.so library which is the python module. To test it, we can use the following simple program (always make sure that LD_LIBRARY_PATH contains the directory where libhellosip.so is found).

import hellosip
print hellosip.HelloSip('ciao').reverse() == 'oaic'

Download

The full source code of this tutorial can be downloaded from this link.

QGIS development

We started our GIS development activities back in 2001, focusing on free open-source software, we developed and deployed several WebGis websites using GRASS and UNM MapServer plus PHP MapScript.

After a while, we stared our Python migration by using the GeoDjango Framework and a choice of Javascript mapping libraries for the client, in particular, we developed WebGIS front-ends with OpenLayers and GeoEXT.

QGIS python plugins development

For internal usage we developed two popular QGIS plugins:

both plugins are released with GPL license and are available on the official QGIS Python Plugins repository, source code is available on my GitHub account.

Official QGIS Python Plugins Repository

Back in 2010 we started contributing to the QGIS community by starting the implementation of the new official QGIS Python Plugins repository.

The new repository was developed in Python using the Django framework

We are still maintaining the plugins repository and we actively participate at all QGIS HackFests to share ideas and coordinate the development with the rest of the QGIS team.

QGIS Server and QGIS Web Client

For a medium sized public administration we recently developed a complete WebGIS system for cadastrial and planning data. We choose the amazing QGIS Server as mapping engine and QGIS Web Client for the client side.

During the development of the system we contributed to the code of both components by providing patches and bug fixes and by developing a full stack of PHP support services that are now integrated in the core of QGIS Web Client


How to create illuminated contours, Tanaka-style

In the category “last night on Twitter”, a challenge I couldn’t resist: creating illuminated contours (aka Tanaka contours) in QGIS. Daniel P. Huffman started the thread by posting this great example:

CFnWnA5UkAAuFm9

This was quickly picked up by Hannes Kröger who blogged about his first attempt at reproducing the effect using QGIS and GIMP. Obviously, that left the challenge of finding a QGIS-only solution.

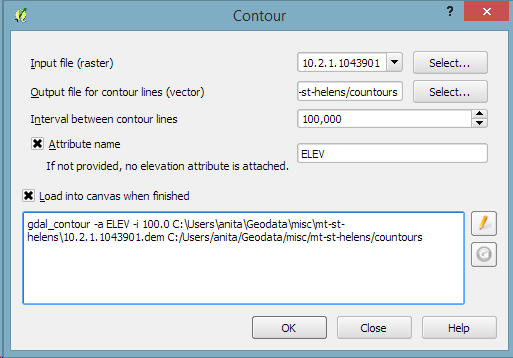
Everything that’s needed to create this effect is a DEM. As Hannes describes in his post, the DEM can then be used to compute the contour lines, e.g. with Raster | Extraction | Contour:

gdal_contour -a ELEV -i 100.0 C:\Users\anita\Geodata\misc\mt-st-helens\10.2.1.1043901.dem C:/Users/anita/Geodata/misc/mt-st-helens/countours

Screenshot 2015-05-24 11.17.49

contours

In order to be able to compute the brightness of the illuminated contours, we need to compute the orientation of every subsection of the contours. Therefore, we need to split the contour lines at each node. One way to do this is using v.split from the Processing toolbox:

Screenshot 2015-05-24 11.23.11

When we split the contours and visualize the result using arrows, we can see that they all wrap around the mountain in clockwise direction (light DEM cells equal higher elevation):

split_contours

After the split, we can compute the orientation of the contour subsections using, for example, a user-defined function:

Screenshot 2015-05-24 19.09.12

This function can then be used in a Field calculator expression:

Screenshot 2015-05-24 19.11.53

Based on the orientation, we can then write an expression to control the contour line color. For example, if we want the sun to appear in the north west (-45°) we can use:

color_hsl( 0,0, 
  scale_linear( abs(
    ( CASE WHEN "azimuth"-45 < 0
      THEN "azimuth"-45+360 
      ELSE "azimuth"-45
    END )
  -180), 0, 180, 0, 100)
  )

This will color the lines which are directly exposed to the sun white hsl(0,0,100) while the ones in the shadows will be black hsl(0,0,0).

Screenshot 2015-05-24 11.55.50

Use the Overlay layer blending mode to blend contours and DEM color:

illuminated_contours

The final step, to get as close to the original design as possible, is to create the effect of discrete elevation classes instead of a smooth color gradient. This can easily be achieved by changing the color interpolation mode of the DEM from Linear to Discrete:

Screenshot 2015-05-24 12.11.01

This leaves us with the following gorgeous effect:

tanaka_contours

As Hannes pointed out, another important aspect of Tanaka’s method is to also alter the contour line width. Lines in the sun or shadow should be wider (1 in this example) than those in orthogonal direction (0.2 in this example):

scale_linear( 
abs( abs(
  ( CASE WHEN "azimuth"-45 < 0
    THEN  "azimuth"-45+360
    ELSE  "azimuth"-45
  END )
-180) -90),
0, 90, 0.2, 1)

datadefined_line_width

Enjoy!


Time Manager workshop at #QGIS2015

Today was the final day of #QGIS2015 the first joint QGIS conference and developer meeting. I had the pleasure to meet Time Manager co-developer Karolina Alexiou aka carolinux in person and give a talk including a hands-on workshop on Time Manager together. Time Manager makes it possible to explore spatio-temporal data by creating animations directly in QGIS.

The talk presents QGIS visualization tools with a focus on efficient use of layer styling to both explore and present spatial data. Examples include the recently added heatmap style as well as sophisticated rule-based and data-defined styles. The focus of this presentation is exploring and presenting spatio-temporal data using the Time Manager plugin. A special treat are time-dependent styles using expression-based styling which access the current Time Manager timestamp.

To download the example data and QGIS projects download Time_Manager_Examples.zip.


Accessing composer item properties via custom expressions in QGIS

So here is a neat trick. Lets say you wanted to access the scale of a composer map to make it part of a label. The scale bar can already be set to numeric to show the number value but what if it needs to be part of an existing label with other text. Not to fear, expression functions are here.

  • Create a new composer. Add the map frame and a label.
  • Set the item ID of the map frame to something you can remember, lets just use themap
  • Select the label and add some text
  • Click Insert Expression

Now for the cool part

  • Select Function Editor
  • Click New File. Give the file a new name and hit save. I called it composer functions.

In the code editor paste this code:

from qgis.utils import iface
from qgis.core import *
from qgis.gui import *

@qgsfunction(args="auto", group='Composer')
def composeritemattr(composername, mapname, attrname, feature, parent):
    composers = iface.activeComposers()
    # Find the composer with the given name
    comp = [composer.composition() for composer in composers 
                if composer.composerWindow().windowTitle() == composername][0]
    # Find the item
    item = comp.getComposerItemById(mapname)
    # Get the attr by name and call 
    return getattr(item, attrname)()
  • Click Run Script

run

Now in your label use this text:

Scale: [% composeritemattr('Composer 1', 'themap', 'scale')%]

Update the Composer 1 to match your composer name, and the themap to match your item ID.

and like magic here is the scale from the map item in a label:

2015-05-21 22_00_09-Composer 1

Check the expression error section if the label doesn’t render

error


Filed under: Open Source, qgis Tagged: composer, python, qgis

QGIS goodies

Just a short post in case you missed it. Since some time QGIS is coorporating with spreadshirt.com, so we can open ‘virtual shops’ all over the world to sell QGIS t-shirst, caps and mugs. So: check your size, and go via this page to the nearest QGIS-shop and make your friends jealous with our great … Continue reading QGIS goodies

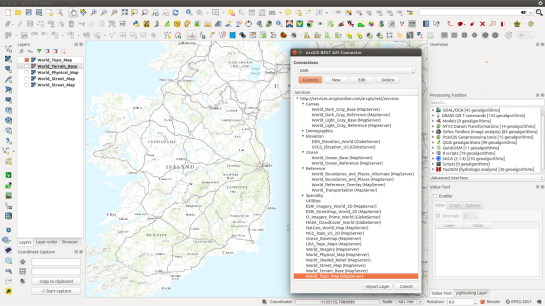
ArcGIS REST API Connector Plugin for QGIS

ArcGIS REST Connector Plugin

Last year we described a command line method that adds ESRI REST layers in QGIS. Well, a team at the Geometa Lab in the University of Applied Sciences Rapperswil (HSR) Switzerland, have released a plugin for QGIS that adds ESRI REST layers via a GUI (Github page). The plugin is experimental so you will need to tick the box “Show also experimental plugins” in the settings panel of the “Plugins – Manage and Install Plugins” dialogue in order to add the plugin to QGIS. The following URLs lists numerous REST layers in the plugin’s GUI:

http://services.arcgisonline.com/arcgis/rest/services

http://basemap.nationalmap.gov/arcgis/rest/services

http://services.nationalmap.gov/arcgis/rest/services

Reference:

REST API Connector Plug-in Wiki Page

Trajectory animations with fadeout effect

Today’s post is a short tutorial for creating trajectory animations with a fadeout effect using QGIS Time Manager. This is the result we are aiming for:

The animation shows the current movement in pink which fades out and leaves behind green traces of the trajectories.

About the data

GeoLife GPS Trajectories were collected within the (Microsoft Research Asia) Geolife project by 182 users in a period of over three years (from April 2007 to August 2012). [1,2,3] The GeoLife GPS Trajectories download contains many text files organized in multiple directories. The data files are basically CSVs with 6 lines of header information. They contain the following fields:

Field 1: Latitude in decimal degrees.
Field 2: Longitude in decimal degrees.
Field 3: All set to 0 for this dataset.
Field 4: Altitude in feet (-777 if not valid).
Field 5: Date – number of days (with fractional part) that have passed since 12/30/1899.
Field 6: Date as a string.
Field 7: Time as a string.

Data prep: PostGIS

Since any kind of GIS operation on text files will be quite inefficient, I decided to load the data into a PostGIS database. This table of millions of GPS points can then be sliced into appropriate chunks for exploration, for example, a day in Beijing:

CREATE MATERIALIZED VIEW geolife.beijing 
AS SELECT trajectories.id,
    trajectories.t_datetime,
    trajectories.t_datetime + interval '1 day' as t_to_datetime,
    trajectories.geom,
    trajectories.oid
   FROM geolife.trajectories
   WHERE st_dwithin(trajectories.geom,
           st_setsrid(
             st_makepoint(116.3974589, 
                           39.9388838), 
             4326), 
           0.1) 
   AND trajectories.t_datetime >= '2008-11-11 00:00:00'
   AND trajectories.t_datetime < '2008-11-12 00:00:00'
WITH DATA

Trajectory viz: a fadeout effect for point markers

The idea behind this visualization is to show both the current movement as well as the history of the trajectories. This can be achieved with a fadeout effect which leaves behind traces of past movement while the most recent positions are highlighted to stand out.

Map tiles by Stamen Design, under CC BY 3.0. Data by OpenStreetMap, under ODbL.

Map tiles by Stamen Design, under CC BY 3.0. Data by OpenStreetMap, under ODbL.

This effect can be created using a Single Symbol renderer with a marker symbol with two symbol layers: one layer serves as the highlights layer (pink) while the second layer represents the traces (green) which linger after the highlights disappear. Feature blending is used to achieve the desired effect for overlapping markers.

Screenshot 2015-05-06 23.52.40

The highlights layer has two expression-based properties: color and size. The color fades to white and the point size shrinks as the point ages. The age can be computed by comparing the point’s t_datetime timestamp to the Time Manager animation time $animation_datetime.

This expression creates the color fading effect:

color_hsv(  
  311,
  scale_exp( 
    minute(age($animation_datetime,"t_datetime")),
    0,60,
    100,0,
    0.2
  ),
  90
)

and this expression makes the point size shrink:

scale_exp( 
  minute(age($animation_datetime,"t_datetime")),
  0,60,
  24,0,
  0.2
)

Outlook

I’m currently preparing this and a couple of other examples for my Time Manager workshop at the upcoming 1st QGIS conference in Nødebo. The workshop materials will be made available online afterwards.

Literature

[1] Yu Zheng, Lizhu Zhang, Xing Xie, Wei-Ying Ma. Mining interesting locations and travel sequences from GPS trajectories. In Proceedings of International conference on World Wild Web (WWW 2009), Madrid Spain. ACM Press: 791-800.
[2] Yu Zheng, Quannan Li, Yukun Chen, Xing Xie, Wei-Ying Ma. Understanding Mobility Based on GPS Data. In Proceedings of ACM conference on Ubiquitous Computing (UbiComp 2008), Seoul, Korea. ACM Press: 312-321.
[3] Yu Zheng, Xing Xie, Wei-Ying Ma, GeoLife: A Collaborative Social Networking Service among User, location and trajectory. Invited paper, in IEEE Data Engineering Bulletin. 33, 2, 2010, pp. 32-40.


Ti piace avere QGIS ben tradotto in italiano? Ora puoi contribuire

Avere tutto QGIS, incluso il programma, i manuali e il sito web, tradotti in italiano è una bella comodità; questo richiede uno sforzo notevole, per cui il tuo aiuto è essenziale. Fai una donazione tramite: http://qgis.it/#translation

PSA: Please use new style Qt signals and slots not the old style

Don’t do this:

self.connect(self.widget, 
             SIGNAL("valueChanged(int)"), 
             self.valuechanged)

It’s the old way, the crappy way. It’s prone to error and typing mistakes. And who really wants to be typing strings as functions and arg names in it. Gross.

Do this:

self.widget.valueChanged.connect(self.valuechanged)
self.widget.valueChanged[str].connect(self.valuechanged)

Much nicer. Cleaner. Looks and feels like Python not some mash up between C++ and Python. The int argument is the default so it will use that. If you to pick the signal type you can use [type].

Don’t do this:

self.emit(SIGNAL("changed()", value1, value2))

Do this

class MyType(QObject):
   changed = pyqtSignal(str, int)

   def stuff(self):
       self.changed.emit(value1, value2)

pyqtSignal is a type you can use to define you signal. It will come with type checking, if you don’t want type checking just do pyqtSignal(object).

Please think of the poor kittens before using the old style in your code.


Filed under: pyqt, python, qgis Tagged: pyqt, qgis, qt

Review: Building Mapping Applications with QGIS

It seems like over the last year the amount of literature published regarding QGIS has really exploded. In the past few months alone there’s been at least three titles I can think of (Building Mapping Applications with QGISMastering QGIS, and the QGIS Python Programming Cookbook). I think this is a great sign of a healthy project. Judging by this there’s certainly a lot of demand for quality guides and documentation for QGIS.

I recently finished reading one of these titles – Building Mapping Applications with QGIS. (Erik Westra, Packt Publishing 2015) In short, I’m a huge fan of this work and think it may be my favourite QGIS book to date! I’ve read Erik’s previous work, Python Geospatial Development, and thought it was an entertaining and really well written book. He’s clearly got an in-depth knowledge about what he’s writing about and this confidence comes through in his writing. So when I first saw this title announced I knew it would be a must-read for me.

In Building Mapping Applications with QGIS, Erik has created a comprehensive guide through all the steps required to create QGIS plugins and standalone Python applications which utilise the QGIS libraries. It’s not a beginner’s guide to Python or to PyQGIS, but that’s what helps it stand out. There’s no introductory chapters on programming with Python or how to use QGIS and instead Erik dives straight into the meat of this topic. I found this approach really refreshing, as I’m often frustrated when the first few chapters of an advanced work just cover the basics. Instead, Building Mapping Applications with QGIS is packed with lessons about, well, actually building mapping applications!

So, why do I like this book so much? Personally, I think it fills a a really crucial void in the existing QGIS literature. There’s a lot of works covering using QGIS, and a few covering PyQGIS development (eg, the PyQGIS Programmer’s Guide, which I reviewed here). But to date, there hasn’t been any literature that covers developing QGIS based applications in such great depth. It’s just icing on the cake that Erik’s writing is also so interesting and easy to read.

Is there any criticisms I have with this book? Well, there’s one small omission which I would have liked to see addressed. While the chapter Learning the QGIS Python API goes into some detail about how QGIS is built using the Qt libraries and a great deal of depth about interpreting the QGIS c++ APIs, I think it could really benefit from some discussion about both the PyQt and Qt APIs themselves. Since a lot of the QGIS classes are either directly derived from Qt classes or heavily utilise them it’s really important that PyQGIS developers are also directed to the PyQt and Qt APIs. For instance, the Qt QColor class is used heavily throughout PyQGIS, but you won’t find any API documentation on QColor in QGIS’ API. Instead, you need to first consult the PyQt API docs and also the detailed Qt c++ docs. It’s often that you may think the PyQGIS API is missing a crucial method, but consulting the Qt docs reveals that the method is instead implemented in the base classes. It’s an important point to note for mastering PyQGIS development. To be fair, I’m yet to read a PyQGIS book which has nailed the interaction between the QGIS, PyQt and Qt APIs.

Honestly, that’s a really minor quibble with an otherwise outstanding work. I’m so glad Erik’s written this work and strongly recommend it to anyone wanting to take their PyQGIS development skills to the next level.

Routing in polygon layers? Yes we can!

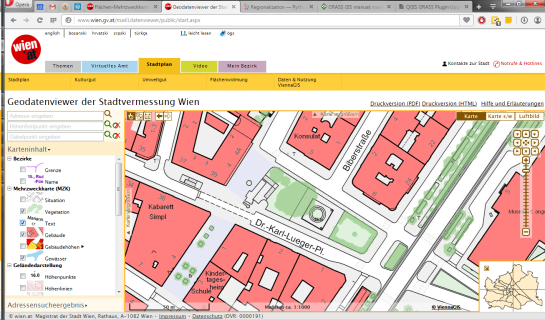
A few weeks ago, the city of Vienna released a great dataset: the so-called “Flächen-Mehrzweckkarte” (FMZK) is a polygon vector layer with an amazing level of detail which contains roads, buildings, sidewalk, parking lots and much more detail:

preview of the Flächen-Mehrzweckkarte

preview of the Flächen-Mehrzweckkarte

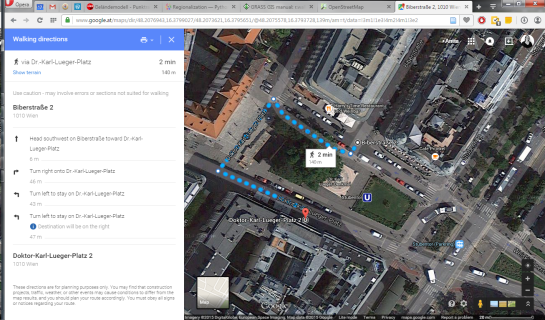
Now, of course we can use this dataset to create gorgeous maps but wouldn’t it be great to use it for analysis? One thing that has been bugging me for a while is routing for pedestrians and how it’s still pretty bad in many situations. For example, if I’d be looking for a route from the northern to the southern side of the square in the previous screenshot, the suggestions would look something like this:

Pedestrian routing in Google Maps

Pedestrian routing in Google Maps

… Great! Google wants me to walk around it …

Pedestrian routing on openstreetmap.org

Pedestrian routing on openstreetmap.org

… Openstreetmap too – but on the other side :P

Wouldn’t it be nice if we could just cross the square? There’s no reason not to. The routing graphs of OSM and Google just don’t contain a connection. Polygon datasets like the FMZK could be a solution to the issue of routing pedestrians over squares. Here’s my first attempt using GRASS r.walk:

Routing with GRASS r.walk

Routing with GRASS r.walk (Green areas are walk-friendly, yellow/orange areas are harder to cross, and red buildings are basically impassable.)

… The route crosses the square – like any sane pedestrian would.

The key steps are:

  1. Assigning pedestrian costs to different polygon classes
  2. Rasterizing the polygons
  3. Computing a cost raster for moving using r.walk
  4. Computing the route using r.drain

I’ve been using GRASS 7 for this example. GRASS 7 is not yet compatible with QGIS but it would certainly be great to have access to this functionality from within QGIS. You can help make this happen by supporting the crowdfunding initiative for the GRASS plugin update.


  • <<
  • Page 67 of 141 ( 2820 posts )
  • >>

Back to Top

Sustaining Members