Related Plugins and Tags

QGIS Planet

Recent labelling improvements in QGIS master

If you’re not like me and don’t keep a constant eye over at QGIS development change log (be careful – it’s addictive!), then you’re probably not aware of a bunch of labelling improvements which recently landed in QGIS master version. I’ve been working recently on a large project which involves a lot (>300) of atlas map outputs, and due to the size of this project it’s not feasible to manually tweak placements of labels. So, I’ve been totally at the mercy of QGIS’ labelling engine for automatic label placements. Generally it’s quite good but there were a few things missing which would help this project. Fortunately, due to the open-source nature of QGIS, I’ve been able to dig in and enhance the label engine to handle these requirements (insert rhetoric about beauty of open source here!). Let’s take a look at them one-by-one:

Data defined quadrant in “Around Point” placement mode

First up, it’s now possible to specify a data defined quadrant when a point label is set to the Around Point placement mode. In the past, you had a choice of either Around Point mode, in which QGIS automatically places labels around point features in order to maximise the number of labels shown, or the Offset from Point mode, in which all labels are placed at a specified position relative to the points (eg top-left). In Offset from Point mode you could use data defined properties to force labels for a feature to be placed at a specific relative position by binding the quadrant to a field in your data. This allowed you to manually tweak the placement for individual labels, but at the cost of every other label being forced to the same relative position. Now, you’ve also got the option to data define the relative position when in Around Point mode, so that the rest of the labels will fall back to being automatically placed. Here’s a quick example – I’ll start with a layer with labels in Around Point mode:

Around Point placement mode

Around Point placement mode

You can see that some labels are sitting to the top right of the points, others to the bottom right, and some in the top middle, in order to fit all the labels for these points. With this new option, I can setup a data defined quadrant for the labels, and then force the ‘Tottenham’ label (top left of the map) to display below and to the left of the point:

Setting a data-defined quadrant

Setting a data-defined quadrant

Here’s what the result looks like:

Manually setting the quadrant for the Tottenham label

Manually setting the quadrant for the Tottenham label

The majority of the labels are still auto-placed, but Tottenham is now force to the lower left corner.

Data defined label priority

Another often-requested feature which landed recently is the ability to set the priority for individual labels. QGIS has long had the ability to set the priority for an entire labelling layer, but you couldn’t control the priority of features within a layer. That would lead to situations like that shown below, where the most important central station (the green point) hasn’t been labelled:

What... no label for the largest station in Melbourne?

What… no label for the largest station in Melbourne?

By setting a data defined priority for labels, I can set the priority either via values manually entered in a field or by taking advantage of an existing “number of passengers” field present in my data. End result is that this central station is now prioritised over any others:

Much better! (in case you're wondering... I've manually forced some other non-optimal placement settings for illustrative purposes!)

Much better! (in case you’re wondering… I’ve manually forced some other non-optimal placement settings for illustrative purposes!)

Obstacle only layers

The third new labelling feature is the option for “Obstacle only” layers. What this option does is allow a non-labelled layer to act as an obstacle for the labels in other layers, so they will be discouraged from drawing labels over the features in the obstacle layer. Again, it’s best demonstrated with an example. Here’s my stations layer with labels placed automatically – you can see that some labels are placed right over the features in the rail lines layer:

Labels over rail lines...

Labels over rail lines…

Now, let’s set the rail lines layer to act as an obstacle for other labels:

... setting the layer as an obstacle...

… setting the layer as an obstacle…

The result is that labels will be placed so that they don’t cover the rail lines anymore! (Unless there’s no other choice). Much nicer.

No more clashing labels!

No more clashing labels!

Control over how polygons act as obstacles for labels

This change is something I’m really pleased about. It’s only applicable for certain situations, but when it works the improvements are dramatic.

Let’s start with my labelled stations map, this time with an administrative boundary layer in the background:

Stations with administrative boundaries

Stations with administrative boundaries

Notice anything wrong with this map? If you’re like me, you won’t be able to look past those labels which cross over the admin borders. Yuck. What’s happening here is that although my administrative regions layer is set to discourage labels being placed over features, there’s actually nowhere that labels can possibly be placed which will avoid this. The admin layer covers the entire map, so regardless of where the labels are placed they will always cover an administrative polygon feature. This is where the new option to control how polygon layers act as obstacles comes to the rescue:

...change a quick setting...

…change a quick setting…

Now, I can set the administrative layer to only avoid placing labels over feature’s boundaries! I don’t care that they’ll still be placed inside the features (since we have no choice!), but I don’t want them sitting on top of these boundaries. The result is a big improvement:

Much better!

Much better!

Now, QGIS has avoided placing labels over the boundaries between regions. Better auto-placement of labels like this means much less time required manually tweaking their positioning, and that’s always a good thing!

Draw only labels which fit inside a polygon

The last change is fairly self explanatory, so no nice screenshots here. QGIS now has the ability to prevent drawing labels which are too large to fit inside their corresponding polygon features. Again, in certain circumstances this can make a huge cartographic improvement to your map.

So there you go. Lots of new labelling goodies to look forward to when QGIS 2.12 rolls around.


A Processing model for Tanaka contours

If you follow my blog, you’ve most certainly seen the post How to create illuminated contours, Tanaka-style from earlier this year. As Victor Olaya noted correctly in the comments, the workflow to create this effect lends itself perfectly to being automated with a Processing model.

The model needs only two inputs: the digital elevation model raster and the interval at which we want the contours to be created:

Screenshot 2015-07-05 18.59.34

The model steps are straightforward: the contours are generated and split into short segments before the segment orientation is computed using the following code in the Advanced Python Field Calculator:

p1 = $geom.asPolyline()[0]
p2 = $geom.asPolyline()[-1]
a = p1.azimuth(p2)
if a < 0:
   a += 360
value = a

Screenshot 2015-07-05 18.53.26

You can find the finished model on Github. Happy QGISing!


AGIT & GI_Forum 2015 wrap-up

It’s my pleasure to report back from this year’s AGIT and GI_Forum conference (German and English speaking respectively). It was great to meet the gathered GIS crowd! If you missed it, don’t despair: I’ve compiled a personal summary on Storify, and papers (German, English) and posters are available online. Here’s a pick of my favorite posters:

I also had the pleasure to be involved in multiple presentations this year:

QGIS at the OSGeo Day

As part of the OSGeo Day, I had the chance to present the latest and greatest QGIS features for map design in front of a full house:

Routing with OSM

On a slightly different note, my colleague Markus Straub and I presented an introduction to routing with OpenStreetMap covering which kind of routing-related information is available in OSM as well as a selection of different tools to perform routing on OSM.

Solving the “unnamed link” problem

In this talk, I presented approaches to solving issues with route descriptions that contain unnamed pedestrian or cycle paths.

Here you can find the full open access paper: Graser, A., & Straub, M. (2015). Improving Navigation: Automated Name Extraction for Separately Mapped Pedestrian and Cycle Links. GI_Forum ‒ Journal for Geographic Information Science, 1-2015, 546-556, doi:10.1553/giscience2015s546.

Inferring road popularity from GPS trajectories

In this talk, my colleague Markus Straub presented our new approach to computing how popular a certain road is. The resulting popularity value can be used for planning as well as routing.

Here you can find the full open access paper: Straub, M., & Graser, A. (2015). Learning from Experts: Inferring Road Popularity from GPS Trajectories. GI_Forum ‒ Journal for Geographic Information Science, 1-2015, 41-50, doi:10.1553/giscience2015s41.


QGIS Server powers the new City of Asti WebGIS

A few days ago the new WebGIS of the City of Asti, a 76000 inhabitants city in Piedmont, was launched.  The new WebGIS uses QGIS Server and QGIS Web Client to serve maps and provide street and cadastrial search and location services.

The new WebGIS was developed by ItOpen and is online at: http://sit.comune.asti.it/site/?map=PRGAsti

Want to sponsor some QGIS features? Here’s some ideas…

I’ve been working on QGIS for a number of years now and, contrary to what I thought when I started, my wishlist seems to grow longer with every feature I add to QGIS! Unfortunately, almost all of my QGIS development work is done on a volunteer basis and it’s sometimes hard to justify the time required to tackle items on this list. So here’s your chance to help me fix this!

Here’s a quick list of things which I’d love to add to QGIS (or improve), but would need someone to step up and help sponsor their development:

  • Raster marker symbol type: Currently QGIS supports a number of marker symbol types (simple markers, font markers, SVG markers) but there’s no option to just use a raster image file for a symbol. A few versions back I added support for a raster image fill type, and now I’d love to do the same for markers. Options could include overriding the image size, rotation and opacity. And of course, all of these properties would be data-definable.
  • Paint effects for diagrams: The successful Kickstarter campaign meant that QGIS 2.10 includes a powerful framework for applying live effects to layers, including drop shadows, outer glows, blurs, and colour effects (plus lots of others!). I’d like to take this framework and allow effects to be applied to diagrams on a layer. Drop shadows and outer glows would really help aid the readability of diagrams by allowing them to sit on a different visual layer to the rest of the map. The effects framework was designed to allow reuse across all of QGIS, and diagrams would be the next logical step in this.

    Layer effects for diagrams! (Well... a mockup of them...)

    Layer effects for diagrams! (Well… a mockup of them…)

  • Additional diagram types/options: While we’re on the topic of diagrams, there’s lots more that we could do with QGIS’ diagram support. We’ve currently got support for pie charts, text diagrams and histograms, but there’s a lot of really nice diagram styles which we don’t yet support. Everybody loves infographics with nicely designed diagrams… so I’d love the chance to extend what’s possible using QGIS diagram engine. Some ideas include icon arrays, circle packing.
  • Adding a geometry widget in the attribute table: This feature has been on my mind a lot lately. What I’d like to add is a new “geometry widget” as the last column in a layer’s attribute table. This widget would allow you to do all sorts of modifications to the geometry attached to a feature. Possible options include clearing the geometry (resetting it to null), copying the geometry as WKT or GeoJSON, or pasting geometry into the feature from a WKT string (making it super easy to copy the geometry between features). This could also be extended in future to start incorporating the editing capabilities current possible through the Plain Geometry Editor plugin.

    Poor quality mockup of a geometry widget...

    Poor quality mockup of a geometry widget…

  • Options for non square/straight line legend patches: QGIS’ legend currently has no options for customising the shape of legend patches. Polygon layers in the legend are rectangles, line layers are straight lines — that’s it. There’s lots of room for improvement here. I’d like to add options for shapes such as circles, rounded rectangles, jagged lines, and possibly even custom shapes (via a WKT string or something similar).

    Custom legend shapes anyone?

    Custom legend shapes anyone?

  • Improving the heatmap plugin: The current heatmap plugin needs some love. The code and UI could do with a big refresh. I’d love a chance to totally revamp this plugin and move it into QGIS core code, and allow it to be used from within processing models. I’d also like to add additional hotspot techniques, such as Getis Ord Gi* hotspotting, to the plugin.
  • Extending the raster calculator: QGIS’ raster calculator was given a bunch of needed fixes and improvements in 2.10, but there’s more we could do. The major limitation with the calculator is that it currently only supports functions with at most two parameters. This needs to be fixed so that we can add a bunch of much desired functions to the calculator – eg min, max, avg, coalesce, if, etc… Lack of support for multi-parameter functions is really holding back what’s possible in the calculator.

Of course, this list is just a start. I’m always keen to chat about any other features you’d like to see added to QGIS (or even tackle specific pet-hate bugs or frustrations!). Just drop me an email at [email protected] to discuss.

Oh, one last thing – I’m in the process of preparing for my next crowd funded feature for QGIS – and this one is big! More on that shortly.


QGIS on the rise with journalists

If you are following QGIS on Twitter you’ve probably noticed the increasing number of tweets by journalists using QGIS.

For example this map in the Financial Times by Hannah Dormido

or this one with overview maps and three different levels of details

or this map with semi-transparent label backgrounds and nice flag images

or even Time Manager animations by raoulranoa in the Los Angeles Times

I think this is a great development and a sign of how wide-spread QGIS usage is today.

If you know of any other examples or if you are a journalist using QGIS yourself, I’d love to see more!


Customising the TimeManager time stamp

TimeManager is a fantastic plugin for QGIS which allows you to create animated maps from your data. You can read all about it here and here, and there’s a really nice demonstration of it here.

I’ve been playing with TimeManager a fair bit over the last month, and thought I’d share a quick tip on improving the appearance of TimeManager’s time stamp. TimeManager includes some basic functionality for placing a time stamp in the corner of your outputs, but it’s fairly limited. There’s only some basic appearance options, and no way to control the date or time formats displayed.

Default TimeManager time stamp

Default TimeManager time stamp

But, there’s a trick we can use to get around this: use a temporary point layer for the time stamp label. Let me elaborate:

  1. Create a throwaway point layer. It doesn’t matter what fields or format this layer has.
  2. Add a single point feature to this layer at the place you’d like the improved time stamp to appear at.

    Add a single point feature

    …add a single point feature

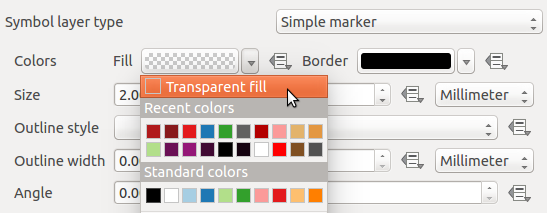
  3. We don’t want to see the marker, so hide the symbol for this layer by setting it to use a transparent fill and outline.

    Transparent fill and outline

    Transparent fill and outline

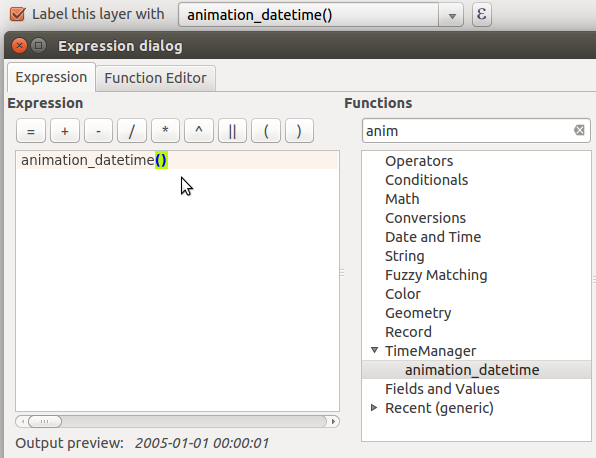
  4. Then, enable labels for this layer. Here’s the trick – set the label expression for the label to use “animation_datetime()” (or for QGIS 2.8, “$animation_datetime”). This is a custom function provided by the TimeManager plugin which evaluates to the current frame’s date and time.

    Setting the layer's label expression

    Setting the layer’s label expression

  5. Now, you can use all the built-in options within QGIS for styling this label. Buffers, drop shadows, background shapes… anything!

    ...tweaking the label appearance

    …tweaking the label appearance

  6. Apply and check. Much nicer!

    Formatted timestamp

    A nicely formatted time stamp

  7. To tweak the formatting of the time stamp’s date and time, you can modify the label expression using the built-in ‘format_date’, ‘year’, ‘month’, etc functions. Let’s try “format_date(animation_datetime(),’ddd dd MMM yyyy’)”:

    Tweaked expression

    Tweaked expression

Now, our final formatted time stamp looks like this:

Final, formatted time stamp

Final, formatted time stamp

…and there we go. Using this simple trick allows you to take advantage of all the possibilities which the QGIS labelling and expression engines allow!

*Bonus points for the first person to use this technique along with data defined controls for animating the label colour/size!

Video tutorial: animated heatmaps with QGIS

Do you like the QGIS heatmap functionality? Did you know that QGIS can also create animated heatmaps?

The following video tutorial shows all necessary steps. To reproduce it, you can get the sample data from my Time Manager workshop at #QGIS2015.


Second report

What do I have completed this week?

  • A new implementation was designed to take into account several algorithms running. (using bounded signals)

  • Deep analysis of the processing in order to fit this new design into the current implementation of the Processing toolbox

  • Thread/Signal debugging

  • Fix the problem that makes QGIS crash when starting the new thread


What am I going to achieve for the next week?

Continue working on the new design of the multithreading support.

Is there any blocking issue?

There is no blocking issue for now.


Third report

What do I have completed this week?

  • Using signals from the GeoAlgorithm to print the progress on QGIS python console
  • Code refactoring
  • Debugging
  • Multithread when running the algorithm through the AlgorithmDialog

What am I going to achieve for the next week?

  • Finish the multithread on the AlgorithmDialog
  • Connect the progress signal to the progress bar
  • Fix a bug that makes QGIS crash (sometimes) after the first time we run the algorithm
  • Fix a bug that makes the algorithm return “None”

Is there any blocking issue?

Last week I had less time to work on the project due to my university exams and projects. I still have some university projects to finish till the end of the semester that may affect GSoC in the next week.


Fourth report

What do I have completed this week?

  • The progress signal is successfully connected to both progress bar (when running from the console) and AlgorithmDialog (When using the processing toolbox).
  • Fixed the bug that makes the algorithm return “None”.
  • Fixed the bug that makes QGIS crash (sometimes) after the first time we run the algorithm.
  • The multithreading on the AlgorithmDialog seems to work fine.
  • More general implementation that allows to test the multithreading with any algorithm.

What am I going to achieve for the next week?

  • Solve the issue with the outputs.
  • Figure out why the processAlgorithm is not being called.
  • Test the algorithms on python console and AlgorithmDialog.
  • Bug fixes.

Is there any blocking issue?

  • Problem loading the outputs from the algorithm.
  • Have some university deadlines that may affect my work time on the project.


First report

What do I have completed this week?

  • New implementation of the AlgorithmExecutor subclassing QObject.
  • Mechanism to deal with crashing Algorithms: when there is an exception during the algorithm execution, a signal is emitted in order to allow the main thread to make the other thread quit.
  • Use signal to connect the algorithm progress signal to the setPercentage slot in the ProgressBar


In the runAlgorithm method of the Processing class I changed the code associated with the runalg in order to support multithreading. Each time that an algorithm is running through the QGIS python console, a new thread and a new instance of the algorithm executor are created. The signals of the AlgorithmExecutor are connected to the thread signal in order to quit the thread and run the algorithm when the thread starts. While the algorithm is running, the main thread waits for the algorithm to finish and then proceed to show the output (first approach)


What am I going to achieve for the next week?

Create a non-blocking version of the processing in order to the interface not wait for the algorithm to finish.

Is there any blocking issue?

QGIS seems to crash randomly when starting the new thread and, when it doesn’t crash, the output of the algorithm is None, which may indicate that the algorithm is crashing in the new thread.


The complete report about the crashing can be found here.


QGIS 2.10 symbology feature preview

With the release of 2.10 right around the corner, it’s time to have a look at the new features this version of QGIS will bring. One area which has received a lot of development attention is layer styling. In particular, I want to point out the following new features:

1. Graduated symbol size

The graduated renderer has been expanded. Formerly, only color-graduated symbols could be created automatically. Now, it is possible to choose between color and size-graduated styles:

Screenshot 2015-06-21 18.39.25

2. Symbol size assistant

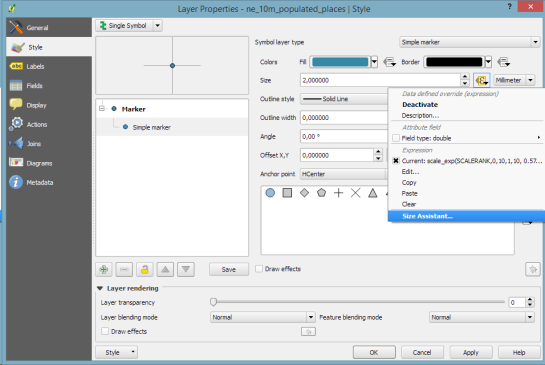
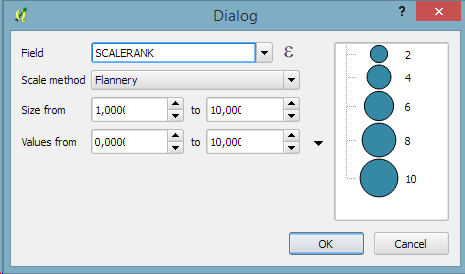
On a similar note, I’m sure you’ll enjoy the size assistant for data-defined size:

Screenshot 2015-06-21 23.16.10 Screenshot 2015-06-21 23.16.01

What’s particularly great about this feature is that it also creates a proper legend for the data-defined sizes:

Screenshot 2015-06-21 23.18.46

3. Interactive class exploration and definition

Another great addition to the graduated renderer dialog is the histogram tab which visualizes the distribution of values as well as the defined class borders. Additionally, the user can interactively change the classes by moving the class borders:

Screenshot 2015-06-21 18.43.09

4. Live layer effects

Since Nyall’s crowd funding initiative for live layer effects was a resounding success, it is now possible to create amazing effects for your vector styles such as shadows, glow, and blur effects:

Screenshot 2015-06-21 18.45.22

I’m very much looking forward to seeing all the new map designs this enables on the QGIS map Flickr group.

Thanks to everyone who was involved in developing and funding these new features!


Change predefined scales plus new PDOK services

New PDOK services This post is mostly interesting for dutch readers, as our national OWS service ‘PDOK’ added some new services. And we made them (5000 layers) available via the PDOK services plugin. Change predefined scales But I also want to show that you can change the predfined scales that you see in the Scale … Continue reading Change predefined scales plus new PDOK services

Crayfish 2.1: New features

New features keep being added to Crayfish. Now it is possible to export time variable grid as animation, add AnuGA results and visualise vectors on user-defined grids.

Export to animation

The ground works were done in Crayfish 2.0 for this feature. You can now generate animation from contours and vectors and export them as AVI. There are two methods of exporting to animation: basic and using QGIS print template (qpt).

With the basic option, you can define a title, a legend and a progress clock. Alternatively, for a smarter solution, you can set up a print composer with the benefit of all its rich features. The composer template (qpt) can be used as a frame layout for exporting your animation.

Below is an example of a multi-frame print composer template used to generate animation from a Crayfish layer.

AnuGA support

Crayfish 2.1 now supports SWW file format generated by AnuGA</li>.

SWW files generated by AnuGA in Crayfish (Click to enlarge)

Vector on user-defined grid

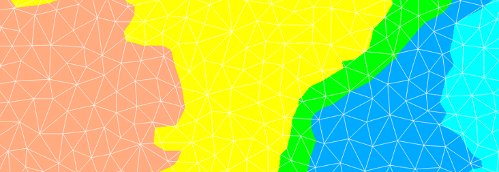
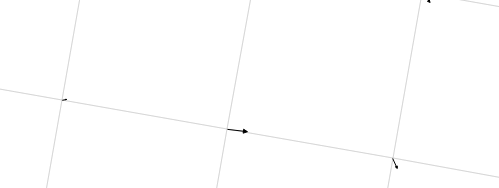
With this option, users can define a grid and Crayfish will interpolate values and displays results on the custom grid. Images below show vectors on the outputted mesh and user-defined grid.

Vectors on default mesh in Crayfish (Click to enlarge)

Vectors on default mesh in Crayfish (Click to enlarge)

Vectors on a user-defined mesh in Crayfish (Click to enlarge)

Crayfish manual

With the ever-growing features in Crayfish, we have decided to dedicate a page on how to use Crayfish in QGIS. From the manual page, users can download a sample data and try the Crayfish features in QGIS.

Sponsors

We’d like to thank Maroondah City Council for sponsoring some of the great features in this release.

You may also like...

Mergin Maps, a field data collection app based on QGIS. Mergin Maps makes field work easy with its simple interface and cloud-based sync. Available on Android, iOS and Windows. Screenshots of the Mergin Maps mobile app for Field Data Collection
Get it on Google Play Get it on Apple store

QGIS Quick WKT plugin iface edition

Some plugin core functions can now be called from a Python console:

g = QgsGeometry.fromWkt('POINT (9.9 43)')
iface.show_geometry(g)
iface.show_geometry(g.buffer(0.2, 2))
iface.show_wkt('POINT (9 45)')
iface.show_wkb(r'0103...') # cut

All functions accept a layer title as optional argument, if None is given, they are automatically added to a Quick WKT GeometryType (memory) layer, such as Quick WKT Polygon for polygons.

The man with the golden gun ( and some examples of installing and using QGIS on Windows)

I’m not Scaramanga (maybe a little bit of Nick Nack) but anyway, this article could be be a golden bullet for helping you to eliminate a lot of obstacles if you are using QGIS in some kind of class-room setup, networked environment and/or are struggling with the “new versions 3 times a year” policy of QGIS.

man-with-the-golden-gun-008

My interest for a hassle free and fast installation of QGIS stems from an experience last year: Some colleagues and I was giving a QGIS workshop for attendants from all over the world. We were told that QGIS was installed on all the computers in the “out-of-town” computer lab and indeed, the computers we checked had a working installation of QGIS. Next day, 15 minutes before the workshop should start, we discovered that the QGIS installations was either non-existent or badly mangled on a large portion of the rest of the computers. And no person with “local admin” rights within sight. It would be an understatement to say that the first hour of the workshop was an interesting time for us. Well, all’s well that ends well, and in the end the workshop was a success (Lucky us!)

A couple of months later I stumbled on this article “A QGIS class room setup on Windows ” – thanks to Richard Duivenvoorde – and tried the setup by copying the qgis program directory from the initial install to another “clean” computer. Alas, QGIS did work on some – but not on all of the computers, I tried it on. The QGIS installation had some dependencies to dll’s in the windows/system32 directory. If they already were present, the “copy” installation would work but otherwise it would fail. I discovered a somewhat complicated solution to the problem and publicized it in the article “How to make a ‘QGIS on a stick’ implementation

Then, some weeks ago at the “QGIS 2015 conference at Nødebo“, I had a chat with QGIS core developer Jürgen E. Fischer about my installation problems and viola! Two days after the chat, the OSGEO4W network installation contained the missing dll’s, Thanks Jürgen.

So now we have two bits of information:

  • By using the “–configpath” qualifier we can redirect where QGIS is looking for plugins, user selected values for options, values and files normally saved in the .qgis2 directory or in the registry.
  • The OSGeo4W network installation creates QGIS without any dependencies to external dll’s outside the installation directory. You could make an installation by simply copy an existing QGIS program directory to another computer.

This gives us some interesting possibilities:

  • Use case I : “QGIS on a stick”
    You can make a QGIS installation located on a memory stick and completely self contained; simply plug in the stick into a Windows computer and start QGIS by double clicking on the QGIS startup file.
  • Use case II: “Simple ‘xcopy’ installation of QGIS”
    Make an installation procedure for QGIS that consists of a simple copy of the QGIS program directory to a new computer. Like the answer to: “How the heck am I going to install QGIS on 24 computers in half an hour ?”
  • Use case III: “Network install of QGIS with floating profiles”
    Install QGIS on a network file share and put the QGIS setup information into the “Floating profile”. A large part of a user profile including will be cached on a central server in the windows domain. If the user logs on to another computer than the usual, his/her profile will automatically be copied to the new computer, giving the user his “normal” desktop and setups.
  • Use case IV: “QGIS on Citrix”
    Normally it ain’t my cup of tea to install any kind of program on a Citrix server where the program has a “canvas” area with fast changing images/pixels. For example: A GIS program like QGIS showing a map with an orthofoto background with millions of pixels – all with a slightly different hues of greens or browns.
    However, many IT departments swears by Citrix, so….
  • Use Case V: “Smart installation and update of a large amount of QGIS installations”
    If you have to install QGIS on dozens or hundreds of computers and keep the installation up-to-date, this is the use-case for you.

Step 1: Creating the common template..

First you have to create a common template for your future installation(s) whatever use case you implement afterwards. I use the 32-bit edition of the network installation as a basis for this although it’s perfectly possible to use the 64 bit version.

  1. Browse to http://qgis.org/en/site/forusers/download.html and click on OSGeo4W Network installer (32 bit) . This will download the installer.
  2. Start the installer and choose “Express Desktop Install”.
  3. Check “QGIS” and uncheck everything else.
  4. Check “I agree yadda yadda…” to every license message.This will install a default QGIS installation in directory C:\OSGeo4W and create a QGIS user directory in C:\Users\<my username>\.qgis2, i.e. the directory .qgis2 in your home directory. These 2 directories is the basis for the template. You can check the installation by starting QGIS from the “OSGeo4W” program group in “Start” –> “All Programs”. It should work without problems.
  5. Copy the C:\Users\<my username>\.qgis2 directory with contents to C:\OSGeo4W, so you’ll have a C:\OSGeo4W\.qgis2 directory.
  6. Copy the startup file for QGIS: C:\OSGeo4W\bin\QGIS.bat to C:\OSGeo4W\bin\QGIS.ref. This is insurance ! If you utterly mangle QGIS.bat in the next steps you have this file as a backup. Otherwise you are not going to use it for anything.
  7. Edit the file: C:\OSGeo4W\bin\QGIS.bat with a simple text editor like notepad.
    Insert 2 lines between line 2 and 3 in the bat file:

    call “%~dp0\o4w_env.bat”
    call “%OSGEO4W_ROOT%”\apps\grass\grass-6.4.4\etc\env.bat

    so it looks like this:

    call “%~dp0\o4w_env.bat”
    set QGIS_OAS=”%OSGEO4W_ROOT%”\.qgis2
    if exist “%OSGEO4W_ROOT%”\bin\QGIS_OAS.bat call “%OSGEO4W_ROOT%”\bin\QGIS_OAS.bat
    call “%OSGEO4W_ROOT%”\apps\grass\grass-6.4.4\etc\env.bat

    and replace the last line in the bat file:

    start “QGIS” /B “%OSGEO4W_ROOT%”\bin\qgis-bin.exe %*

    with this line:

    start “QGIS” /B “%OSGEO4W_ROOT%”\bin\qgis-bin.exe –configpath %QGIS_OAS% %*

    and save the result.

    What the edits mean:

    • Create an environment variable %QGIS_OAS% which works as a pointer to the location of the .qgis2 directory. Initially it points to the .qgis2 directory inside the OSGeo4W installation directory we created in (5).
    • Execute a command-file “QGIS_OAS.bat” if it exists. This command-file is the basis for all our different use-cases. There will be a different version for each use-case. Initially we don’t use this file.
    • Add the “–configpath %QGIS_OAS% qualifier to the actual start of QGIS. This means, that QGIS will look for all setup information, user-defined options, plugins and whatnot in the directory specified by the %QGIS_OAS% environment variable. And QGIS will not use any settings in the registry.
  8. Start QGIS by double clicking the revised C:\OSGeo4W\bin\QGIS.bat file and make all the changes to the initial setup of QGIS that should be included in your future QGIS installation(s). This could be change of language, default projection, extra plugins, snap options, yadda yadda yadda. Come on, make you dream QGIS setup !!

Thanks to the –configpath qualifier now on the start line for QGIS all these changes will be saved in the C:\OSGeo4W\.qgis2 directory. After this, you have a complete setup of QGIS – with your own changes – all located in the C:\OSGeo4W directory. This is the common template for all use cases.

Step 2: Do one of the use cases…

Use case I : “QGIS on a stick “

You have already done this use case. The template made in step 1 is a ready made “QGIS on a stick” installation:

  1. Copy the entire C:\OSGeo4W template directory from your computer to the root of your memory stick.
  2. Insert the memory stick into any Windows computer and start QGIS by double clicking on \OSGeo4W\bin\qgis.bat on the memory stick.
    QGIS will use \OSGeo4W\.qgis2 on the memory stick as the QGIS user directory.

Use case II : “Simple ‘xcopy’ installation of QGIS “

In this use case we will have to extend the template by creating the QGIS_OAS.bat file. This example will put the QGIS user directory “.qgis2” in the users home directory, just like the normal installation does – with one exception: This installation will not use the registry but save all user options in a ini-file placed in the QGIS user directory.

  1. Create the file C:\OSGeo4W\bin\QGIS_OAS.bat with the following content:
    set QGIS_OAS=”%USERPROFILE%”\.qgis2
    if exist %QGIS_OAS% exit /B
    xcopy “%OSGEO4W_ROOT%”\.qgis2 %QGIS_OAS% /e /i
    nircmd shortcut “””%OSGEO4W_ROOT%””\bin\qgis.bat” “~$folder.desktop$” “Start QGIS” “” “””%OSGEO4W_ROOT%””\bin\qgis-bin.exe” “0” “min” “””%OSGEO4W_ROOT%””\bin” “”

    (First the pointer to the QGIS user directory is changed to the “users home directory”\.qgis2. Secondly, The command file will check if the QGIS user directory exists in the users home directory. If it doesn’t exist, the command file will create a copy of the QGIS user directory template into the users home directory; create a shortcut to start QGIS and place this shortcut on the user’s desktop.)

  2. You can now install QGIS on a new PC by copying the entire C:\OSGeo4W directory to the new pc (using a memory-bird, network drive, zip-copy-unzip, whatever). The directory can be copied to any directory location on the new PC. Please note that some locations will require “local admin” rights for creating the new directory, for example if you copy it to “C:\Program Files”. I usually try the avoid this.

First time use on the new pc:

  • Start QGIS by double clicking on C:\OSGeo4W\bin\qgis.bat (or wherever you placed the OSGeo4W directory). When QGIS starts, the combined command files QGIS.BAT and QGIS_OAS.BAT will automatically create the QGIS user directory on the new pc; create a shortcut to QGIS on the user desktop and start QGIS.

After that you can start QGIS by double clicking on the shortcut placed on the desktop.


Use case III: “Network install of QGIS with floating profiles

This usage scenario will have the QGIS installation located in a directory on a common network file-share. A normal user need only to have read and execute rights to this directory. The QGIS user directory will be placed in the users “roaming profile” on the client PC, a special region which is cached to a central server.

The computers and users are members of a AD domain. If the user logs on to another pc in the domain, the “roaming profile”, including the desktop and the QGIS user directory, will automatically be copied the new computer and the user will see the usual desktop and applications.

With this setup, there is no dependencies to any particular client pc after the first start of QGIS by the user. If the user logs on any other client PC in the domain it will be possible for her to start QGIS simply by double clicking on the QGIS shortcut on desktop.

There is some requirements: The user has to have access to the common file share (!) and the network connection has to be stable and relatively fast.

In this use case we will do the following:

  1. Copy the QGIS directory C:\OSGeo4W to the common share: X:\QGIS\Current (The drive letter X: is arbitrary; it could be any drive letter). I will explain the naming scheme of the directory later.
  2. Create the file X:\QGIS\Current\bin\QGIS_OAS.bat with the following content
    set QGIS_OAS=”%APPDATA%”\.qgis2
    if exist %QGIS_OAS% exit /B
    xcopy “%OSGEO4W_ROOT%”\.qgis2 %QGIS_OAS% /e /i
    nircmd shortcut “””%OSGEO4W_ROOT%””\bin\qgis.bat” “~$folder.desktop$” “Start QGIS” “” “””%OSGEO4W_ROOT%””\bin\qgis-bin.exe” “0” “min” “””%OSGEO4W_ROOT%””\bin” “”

    (First, The QGIS_OAS environment variable points to the qgis user directory in the roaming profile. Secondly, the command file will check if the QGIS user directory exists. If it doesn’t, the command file will copy the QGIS user directory template to the users roaming profile; create a shortcut to start QGIS and place this shortcut on the user desktop.)

First time use on the new pc:

  • Start QGIS by double clicking on X:\QGIS\Current\bin\qgis.bat. When QGIS starts, the combined command files QGIS.BAT and QGIS_OAS.bat will automatically create the QGIS user directory on the new pc, create a shortcut on the user desktop and start QGIS.
  • After the first time you start QGIS by double clicking on the shortcut placed on the desktop.

Oh .. and why did I use this particular naming scheme for the directory ? It is used to make it easy to update QGIS:

When you have a new version of QGIS, do the following:

  1. Make a template of the new qgis version as described in step 1 and use case III, but in another directory: X:\QGIS\Testing and leave the X:\QGIS\Current unchanged.
  2. Test the new installation. You might even let some of your users test it!! You can start the “testing” version of QGIS by double clicking on X:\QGIS\Testing\bin\qgis.bat
  3. When you are satisfied with the new installation:
    • Rename the directory X:\QGIS\Current to X:\QGIS\Deprecated
    • Rename the directory X:\QGIS\Testing to X:\QGIS\Current 

After the last rename operation all the networked users will execute the new version using their existing shortcut. This method will probably work with all minor updates (2.8 -> 2.10), but probably not with a major update (2.10 -> 3.0)

Use case IV : “QGIS on Citrix “

If you have a Citrix environment you probably have a personal network-based share for each an every user on the domain. For this use case I call this directory M:\Personal. But the naming convention can be anything.

The idea is to place the QGIS user directory on the personal network share, so there won’t be anything saved or registered on the Citrix server that’s user related:

Do the following:

  1. Create a working installation of QGIS on the Citrix sever using the techniques described in Step 1.
  2. Create the file C:\OSGeo4W\bin\QGIS_OAS.bat on the Citrix server with the following content:
    set QGIS_OAS=M:\Personal\.qgis2
    if exist %QGIS_OAS% exit /B
    xcopy “%OSGEO4W_ROOT%”\.qgis2 %QGIS_OAS% /e /i

    (First, The QGIS_OAS environment variable points to the qgis user directory placed on the users personal network share. In this case “M:\Personal”. Secondly, the command file will check if the QGIS user directory exists. If it doesn’t, the command file will copy the QGIS user directory template to the users personal network share.)

  3. Create the usual application startup definition for Citrix pointing to C:\OSGeo4W\bin\QGIS.bat on the Citrix server.

Bingo ! That’s it. I’ll leave the last use case “Smart installation and update of a large amount of QGIS installations” to a separate article, because it is more complicated than any of the previous use cases. I’ll try to publish that article in a week or so, so stay tuned !!

This article has a zip file “QgisOnAStick.zip” attached. It contains the revised QGIS.BAT file plus all the different types of QGIS_OAS bat files described in the article. The suffix is renamed to “.usecase_1”, “.usecase_2” and so on. Download the zip file and rename the suffix to “.bat” on the files you’re going to use.

A final note: I’ve used QGIS 2.8.2 in my tests. So the use cases works for this version of QGIS and will probably work for other QGIS 2.x versions.

Regardsbo

Bo Victor Thomsen

[email protected]
AestasGIS
Denmark

How to use Function Editor in QGIS Field calculator

In QGIS 2.8, there is a new option for users to add their own python function in the Field calculator. This is an extremely useful feature enabling users to populate data within the attribute table using customised python function.

Nathan wrote a blog post about the feature and how to write a python with arguments. But in QGIS 2.8, the function editor does not correctly support functions without arguments.

In the example below, we are going to calculate proportion of area for each SAC (Special Areas of Conservation) in Great Britain to the total area of the layer.

Add GB_SAC_20130918_Dissolved.shp layer to QGIS, right-click on the layer and open attribute table. Make the layer editable and click on the Field calculator. We are now going to create a new column (propArea) and populate proportionate area of each SAC to the total area of the layer.

Under Function Editor tab, click on New file and type area for the name and save the file. For the content, copy and paste the following lines:

"""
A custom function to calculate total area of the GIS layer.
This function has no arguments.
"""

from qgis.core import *
from qgis.gui import *
from qgis.utils import iface

@qgsfunction(args='auto', group='Custom')
def total_area(x, feature, parent):
	return sum( f.geometry().area() for f in iface.activeLayer().getFeatures() )

Click on Run Script to add total_area function to your Custom function list.

Now, click on Expression tab and type:

$area / total_area(0)

As you can see, we have passed 0 as an argument. If you click OK, your QGIS will freeze! As there are many features in the layer, the expression, calculates total area for each row.

Lets make the script a bit more elegant. Firstly, we need to add caching, so that area will be calculated only once and cached for the rest of operation. Secondly, we can make the script a bit more generic, so that we can use it to get the area of other loaded layers in QGIS:

from qgis.core import *
from qgis.gui import *
from qgis.utils import iface

cache = {}
def _layer_area(layer):
	""" Internal method """
	if layer.name() not in cache:
		area = sum( f.geometry().area() for f in layer.getFeatures() )
		cache[layer.name()] = area
	return cache[layer.name()]

@qgsfunction(args='auto', group='Custom')
def total_area(layer_name, feature, parent):
	for layer in iface.mapCanvas().layers():
		if layer.name() == layer_name:
			return _layer_area(layer)
	return 0

Now, click on Expression tab and type:

$area / total_area('GB_SAC_20130918_Dissolved')

This time, it should be quicker!

You may also like...

Mergin Maps, a field data collection app based on QGIS. Mergin Maps makes field work easy with its simple interface and cloud-based sync. Available on Android, iOS and Windows. Screenshots of the Mergin Maps mobile app for Field Data Collection
Get it on Google Play Get it on Apple store

QGIS 3.0 future plans

If you follow the QGIS developer mailing list, you’ve probably seen threads about the next major release: 3.0. The topic has been one of the many points we talked about at the latest QGIS developer meeting and Tim Sutton sums up the discussed plan in a post published today:

One hot topic was ‘when will QGIS 3.0 be released’. The short answer to that question is that ‘we don’t know’ – Jürgen Fischer and Matthias Kuhn are still investigating our options and once they have had enough time to understand the implications of upgrading to Qt5, Python 3 etc. they will make some recommendations. I can tell you that we agreed to announce clearly and long in advance (e.g. 1 year) the roadmap to moving to QGIS 3.0 so that plugin builders and others who are using QGIS libraries for building third party apps will have enough time to be ready for the transition. At the moment it is still uncertain if there even is a pressing need to make the transition, so we are going to hang back and wait for Jürgen & Matthias’ feedback.

The take-away message here is that the QGIS team is aware of the current developments around Python and Qt and will keep the community updated about the further development path well before any move.

qgis_keep_calm


QGIS developer meeting in Nødebo

During the hackfest I’ve been working on the refactoring of the server component, aimed to wrap the server into a class and create python bindings for the new classes. This work is now in the PR queue and brings a first working python test for the server itself.

The server can now be invoked directly from python, like in the example below:


#!/usr/bin/env python
"""
Super simple QgsServer.
"""

from qgis.server import *
from BaseHTTPServer import *

class handler (BaseHTTPRequestHandler):

    server = QgsServer()

    def _doHeaders(self, response):
        l = response.pop(0)
        while l:
            h = l.split(':')
            self.send_header(h[0], ':'.join(h[1:]))
            self.log_message( "send_header %s - %s" % (h[0], ':'.join(h[1:])))
            l = response.pop(0)
        self.end_headers()

    def do_HEAD(self):
        self.send_response(200)
        response = str(handler.server.handleRequestGetHeaders(self.path[2:])).split('\n')
        self._doHeaders(response)

    def do_GET(self):
        response = str(handler.server.handleRequest(self.path[2:])).split('\n')
        i = 0
        self.send_response(200)
        self._doHeaders(response)
        self.wfile.write(('\n'.join(response[i:])).strip())

    def do_OPTIONS(s):
        handler.do_GET(s)

httpd = HTTPServer( ('', 8000), handler)

while True:
    httpd.handle_request()

The python bindings capture the server output instead of printing it on FCGI stdout and allow to pass the request parameters QUERY_STRING directly to the request handler as a string, this makes writing python tests very easy.

  • <<
  • Page 66 of 141 ( 2820 posts )
  • >>

Back to Top

Sustaining Members