Related Plugins and Tags

QGIS Planet

About label halos

A lot of cartographers have a love/hate relationship with label halos. On one hand they can be an essential technique for improving label readability, especially against complex background layers. On the other hand they tend to dominate maps and draw unwanted attention to the map labels.

In this post I’m going to share my preferred techniques for using label halos. I personally find this technique is a good approach which minimises the negative effects of halos, while still providing a good boost to label readability. (I’m also going to share some related QGIS 3.0 news at the end of this post!)

Let’s start with some simple white labels over an aerial image:

These labels aren’t very effective. The complex background makes them hard to read, especially the “Winton Shire” label at the bottom of the image. A quick and nasty way to improve readability is to add a black halo around the labels:

Sure, it’s easy to read the labels now, but they stand out way too much and it’s difficult to see anything here except the labels!

We can improve this somewhat through a better choice of halo colour:

This is much better. We’ve got readable labels which aren’t too domineering. Unfortunately the halo effect is still very prominent, especially where the background image varies a lot. In this case it works well for the labels toward the middle of the map, but not so well for the labels at the top and bottom.

A good way to improve this is to take advantage of blending (or “composition”) modes (which QGIS has native support for). The white labels will be most readable when there’s a good contrast with the background map, i.e. when the background map is dark. That’s why we choose a halo colour which is darker than the text colour (or vice versa if you’ve got dark coloured labels). Unfortunately, by choosing the mid-toned brown colour to make the halos blend in more, we are actually lightening up parts of this background layer and both reducing the contrast with the label and also making the halo more visible. By using the “darken” blend mode, the brown halo will only be drawn for pixels were the brown is darker then the existing background. It will darken light areas of the image, but avoid lightening pixels which are already dark and providing good contrast. Here’s what this looks like:

The most noticeable differences are the labels shown above darker areas – the “Winton Shire” label at the bottom and the “Etheridge Shire” at the top. For both these labels the halo is almost imperceptible whilst still subtly doing it’s part to make the label readable. (If you had dark label text with a lighter halo color, you can use the “lighten” blend mode for the same result).

The only issue with this map is that the halo is still very obvious around “Shire” in “Richmond Shire” and “McKinlay” on the left of the map. This can be reduced by applying a light blur to the halo:

There’s almost no loss of readability by applying this blur, but it’s made those last prominent halos disappear into the map. At first glance you probably wouldn’t even notice that there’s any halos being used here. But if we compare back against the original map (which used no halos) we can see the huge difference in readability:

Compare especially the Winton Shire label at the bottom, and the Richmond Shire label in the middle. These are much clearer on our tweaked map versus the above image.

Now for the good news… when QGIS 3.0 is released you’ll no longer have to rely on an external illustration/editing application to get this effect with your maps. In fact, QGIS 3.0 is bringing native support for applying many types of live layer effects to label buffers and background shapes, including blur. This means it will be possible to reproduce this technique directly inside your GIS, no external editing or tweaking required!

Recent labelling improvements in QGIS master

If you’re not like me and don’t keep a constant eye over at QGIS development change log (be careful – it’s addictive!), then you’re probably not aware of a bunch of labelling improvements which recently landed in QGIS master version. I’ve been working recently on a large project which involves a lot (>300) of atlas map outputs, and due to the size of this project it’s not feasible to manually tweak placements of labels. So, I’ve been totally at the mercy of QGIS’ labelling engine for automatic label placements. Generally it’s quite good but there were a few things missing which would help this project. Fortunately, due to the open-source nature of QGIS, I’ve been able to dig in and enhance the label engine to handle these requirements (insert rhetoric about beauty of open source here!). Let’s take a look at them one-by-one:

Data defined quadrant in “Around Point” placement mode

First up, it’s now possible to specify a data defined quadrant when a point label is set to the Around Point placement mode. In the past, you had a choice of either Around Point mode, in which QGIS automatically places labels around point features in order to maximise the number of labels shown, or the Offset from Point mode, in which all labels are placed at a specified position relative to the points (eg top-left). In Offset from Point mode you could use data defined properties to force labels for a feature to be placed at a specific relative position by binding the quadrant to a field in your data. This allowed you to manually tweak the placement for individual labels, but at the cost of every other label being forced to the same relative position. Now, you’ve also got the option to data define the relative position when in Around Point mode, so that the rest of the labels will fall back to being automatically placed. Here’s a quick example – I’ll start with a layer with labels in Around Point mode:

Around Point placement mode

You can see that some labels are sitting to the top right of the points, others to the bottom right, and some in the top middle, in order to fit all the labels for these points. With this new option, I can setup a data defined quadrant for the labels, and then force the ‘Tottenham’ label (top left of the map) to display below and to the left of the point:

Setting a data-defined quadrant

Here’s what the result looks like:

Manually setting the quadrant for the Tottenham label

The majority of the labels are still auto-placed, but Tottenham is now force to the lower left corner.

Data defined label priority

Another often-requested feature which landed recently is the ability to set the priority for individual labels. QGIS has long had the ability to set the priority for an entire labelling layer, but you couldn’t control the priority of features within a layer. That would lead to situations like that shown below, where the most important central station (the green point) hasn’t been labelled:

What... no label for the largest station in Melbourne?
What… no label for the largest station in Melbourne?

By setting a data defined priority for labels, I can set the priority either via values manually entered in a field or by taking advantage of an existing “number of passengers” field present in my data. End result is that this central station is now prioritised over any others:

Much better! (in case you're wondering... I've manually forced some other non-optimal placement settings for illustrative purposes!)
Much better! (in case you’re wondering… I’ve manually forced some other non-optimal placement settings for illustrative purposes!)

Obstacle only layers

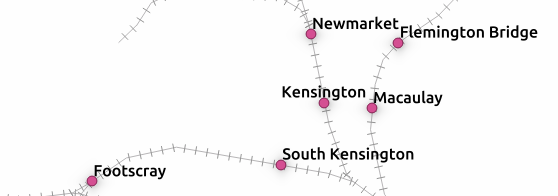
The third new labelling feature is the option for “Obstacle only” layers. What this option does is allow a non-labelled layer to act as an obstacle for the labels in other layers, so they will be discouraged from drawing labels over the features in the obstacle layer. Again, it’s best demonstrated with an example. Here’s my stations layer with labels placed automatically – you can see that some labels are placed right over the features in the rail lines layer:

Labels over rail lines...
Labels over rail lines…

Now, let’s set the rail lines layer to act as an obstacle for other labels:

... setting the layer as an obstacle...
… setting the layer as an obstacle…

The result is that labels will be placed so that they don’t cover the rail lines anymore! (Unless there’s no other choice). Much nicer.

No more clashing labels!

Control over how polygons act as obstacles for labels

This change is something I’m really pleased about. It’s only applicable for certain situations, but when it works the improvements are dramatic.

Let’s start with my labelled stations map, this time with an administrative boundary layer in the background:

Stations with administrative boundaries

Notice anything wrong with this map? If you’re like me, you won’t be able to look past those labels which cross over the admin borders. Yuck. What’s happening here is that although my administrative regions layer is set to discourage labels being placed over features, there’s actually nowhere that labels can possibly be placed which will avoid this. The admin layer covers the entire map, so regardless of where the labels are placed they will always cover an administrative polygon feature. This is where the new option to control how polygon layers act as obstacles comes to the rescue:

...change a quick setting...
…change a quick setting…

Now, I can set the administrative layer to only avoid placing labels over feature’s boundaries! I don’t care that they’ll still be placed inside the features (since we have no choice!), but I don’t want them sitting on top of these boundaries. The result is a big improvement:

Much better!
Much better!

Now, QGIS has avoided placing labels over the boundaries between regions. Better auto-placement of labels like this means much less time required manually tweaking their positioning, and that’s always a good thing!

Draw only labels which fit inside a polygon

The last change is fairly self explanatory, so no nice screenshots here. QGIS now has the ability to prevent drawing labels which are too large to fit inside their corresponding polygon features. Again, in certain circumstances this can make a huge cartographic improvement to your map.

So there you go. Lots of new labelling goodies to look forward to when QGIS 2.12 rolls around.


Customising the TimeManager time stamp

TimeManager is a fantastic plugin for QGIS which allows you to create animated maps from your data. You can read all about it here and here, and there’s a really nice demonstration of it here.

I’ve been playing with TimeManager a fair bit over the last month, and thought I’d share a quick tip on improving the appearance of TimeManager’s time stamp. TimeManager includes some basic functionality for placing a time stamp in the corner of your outputs, but it’s fairly limited. There’s only some basic appearance options, and no way to control the date or time formats displayed.

Default TimeManager time stamp

But, there’s a trick we can use to get around this: use a temporary point layer for the time stamp label. Let me elaborate:

  1. Create a throwaway point layer. It doesn’t matter what fields or format this layer has.
  2. Add a single point feature to this layer at the place you’d like the improved time stamp to appear at.

    Add a single point feature
    …add a single point feature
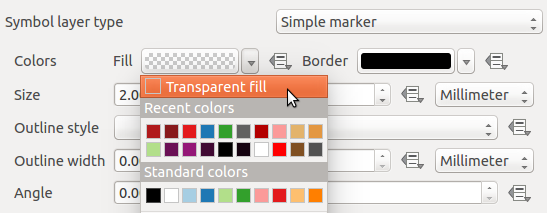
  3. We don’t want to see the marker, so hide the symbol for this layer by setting it to use a transparent fill and outline.

    Transparent fill and outline
    Transparent fill and outline
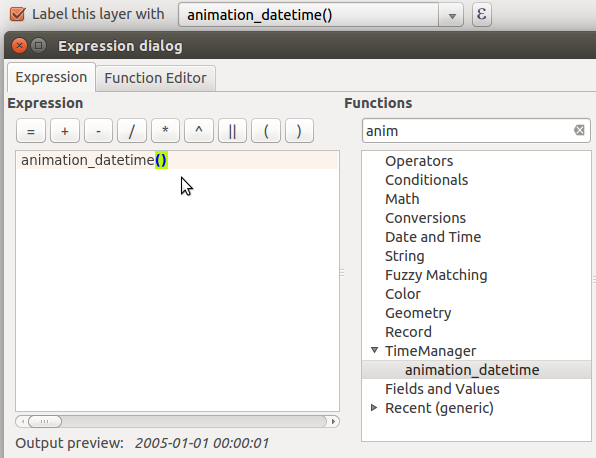
  4. Then, enable labels for this layer. Here’s the trick – set the label expression for the label to use “animation_datetime()” (or for QGIS 2.8, “$animation_datetime”). This is a custom function provided by the TimeManager plugin which evaluates to the current frame’s date and time.

    Setting the layer's label expression
    Setting the layer’s label expression
  5. Now, you can use all the built-in options within QGIS for styling this label. Buffers, drop shadows, background shapes… anything!

    ...tweaking the label appearance
    …tweaking the label appearance
  6. Apply and check. Much nicer!

    Formatted timestamp
    A nicely formatted time stamp
  7. To tweak the formatting of the time stamp’s date and time, you can modify the label expression using the built-in ‘format_date’, ‘year’, ‘month’, etc functions. Let’s try “format_date(animation_datetime(),’ddd dd MMM yyyy’)”:

    Tweaked expression
    Tweaked expression

Now, our final formatted time stamp looks like this:

Final, formatted time stamp

…and there we go. Using this simple trick allows you to take advantage of all the possibilities which the QGIS labelling and expression engines allow!

*Bonus points for the first person to use this technique along with data defined controls for animating the label colour/size!

Recent labelling improvements in QGIS master

If you’re not like me and don’t keep a constant eye over at QGIS development change log (be careful – it’s addictive!), then you’re probably not aware of a bunch of labelling improvements which recently landed in QGIS master version. I’ve been working recently on a large project which involves a lot (>300) of atlas map outputs, and due to the size of this project it’s not feasible to manually tweak placements of labels. So, I’ve been totally at the mercy of QGIS’ labelling engine for automatic label placements. Generally it’s quite good but there were a few things missing which would help this project. Fortunately, due to the open-source nature of QGIS, I’ve been able to dig in and enhance the label engine to handle these requirements (insert rhetoric about beauty of open source here!). Let’s take a look at them one-by-one:

Data defined quadrant in “Around Point” placement mode

First up, it’s now possible to specify a data defined quadrant when a point label is set to the Around Point placement mode. In the past, you had a choice of either Around Point mode, in which QGIS automatically places labels around point features in order to maximise the number of labels shown, or the Offset from Point mode, in which all labels are placed at a specified position relative to the points (eg top-left). In Offset from Point mode you could use data defined properties to force labels for a feature to be placed at a specific relative position by binding the quadrant to a field in your data. This allowed you to manually tweak the placement for individual labels, but at the cost of every other label being forced to the same relative position. Now, you’ve also got the option to data define the relative position when in Around Point mode, so that the rest of the labels will fall back to being automatically placed. Here’s a quick example – I’ll start with a layer with labels in Around Point mode:

Around Point placement mode

Around Point placement mode

You can see that some labels are sitting to the top right of the points, others to the bottom right, and some in the top middle, in order to fit all the labels for these points. With this new option, I can setup a data defined quadrant for the labels, and then force the ‘Tottenham’ label (top left of the map) to display below and to the left of the point:

Setting a data-defined quadrant

Setting a data-defined quadrant

Here’s what the result looks like:

Manually setting the quadrant for the Tottenham label

Manually setting the quadrant for the Tottenham label

The majority of the labels are still auto-placed, but Tottenham is now force to the lower left corner.

Data defined label priority

Another often-requested feature which landed recently is the ability to set the priority for individual labels. QGIS has long had the ability to set the priority for an entire labelling layer, but you couldn’t control the priority of features within a layer. That would lead to situations like that shown below, where the most important central station (the green point) hasn’t been labelled:

What... no label for the largest station in Melbourne?

What… no label for the largest station in Melbourne?

By setting a data defined priority for labels, I can set the priority either via values manually entered in a field or by taking advantage of an existing “number of passengers” field present in my data. End result is that this central station is now prioritised over any others:

Much better! (in case you're wondering... I've manually forced some other non-optimal placement settings for illustrative purposes!)

Much better! (in case you’re wondering… I’ve manually forced some other non-optimal placement settings for illustrative purposes!)

Obstacle only layers

The third new labelling feature is the option for “Obstacle only” layers. What this option does is allow a non-labelled layer to act as an obstacle for the labels in other layers, so they will be discouraged from drawing labels over the features in the obstacle layer. Again, it’s best demonstrated with an example. Here’s my stations layer with labels placed automatically – you can see that some labels are placed right over the features in the rail lines layer:

Labels over rail lines...

Labels over rail lines…

Now, let’s set the rail lines layer to act as an obstacle for other labels:

... setting the layer as an obstacle...

… setting the layer as an obstacle…

The result is that labels will be placed so that they don’t cover the rail lines anymore! (Unless there’s no other choice). Much nicer.

No more clashing labels!

No more clashing labels!

Control over how polygons act as obstacles for labels

This change is something I’m really pleased about. It’s only applicable for certain situations, but when it works the improvements are dramatic.

Let’s start with my labelled stations map, this time with an administrative boundary layer in the background:

Stations with administrative boundaries

Stations with administrative boundaries

Notice anything wrong with this map? If you’re like me, you won’t be able to look past those labels which cross over the admin borders. Yuck. What’s happening here is that although my administrative regions layer is set to discourage labels being placed over features, there’s actually nowhere that labels can possibly be placed which will avoid this. The admin layer covers the entire map, so regardless of where the labels are placed they will always cover an administrative polygon feature. This is where the new option to control how polygon layers act as obstacles comes to the rescue:

...change a quick setting...

…change a quick setting…

Now, I can set the administrative layer to only avoid placing labels over feature’s boundaries! I don’t care that they’ll still be placed inside the features (since we have no choice!), but I don’t want them sitting on top of these boundaries. The result is a big improvement:

Much better!

Much better!

Now, QGIS has avoided placing labels over the boundaries between regions. Better auto-placement of labels like this means much less time required manually tweaking their positioning, and that’s always a good thing!

Draw only labels which fit inside a polygon

The last change is fairly self explanatory, so no nice screenshots here. QGIS now has the ability to prevent drawing labels which are too large to fit inside their corresponding polygon features. Again, in certain circumstances this can make a huge cartographic improvement to your map.

So there you go. Lots of new labelling goodies to look forward to when QGIS 2.12 rolls around.


Customising the TimeManager time stamp

TimeManager is a fantastic plugin for QGIS which allows you to create animated maps from your data. You can read all about it here and here, and there’s a really nice demonstration of it here.

I’ve been playing with TimeManager a fair bit over the last month, and thought I’d share a quick tip on improving the appearance of TimeManager’s time stamp. TimeManager includes some basic functionality for placing a time stamp in the corner of your outputs, but it’s fairly limited. There’s only some basic appearance options, and no way to control the date or time formats displayed.

Default TimeManager time stamp

Default TimeManager time stamp

But, there’s a trick we can use to get around this: use a temporary point layer for the time stamp label. Let me elaborate:

  1. Create a throwaway point layer. It doesn’t matter what fields or format this layer has.
  2. Add a single point feature to this layer at the place you’d like the improved time stamp to appear at.

    Add a single point feature

    …add a single point feature

  3. We don’t want to see the marker, so hide the symbol for this layer by setting it to use a transparent fill and outline.

    Transparent fill and outline

    Transparent fill and outline

  4. Then, enable labels for this layer. Here’s the trick – set the label expression for the label to use “animation_datetime()” (or for QGIS 2.8, “$animation_datetime”). This is a custom function provided by the TimeManager plugin which evaluates to the current frame’s date and time.

    Setting the layer's label expression

    Setting the layer’s label expression

  5. Now, you can use all the built-in options within QGIS for styling this label. Buffers, drop shadows, background shapes… anything!

    ...tweaking the label appearance

    …tweaking the label appearance

  6. Apply and check. Much nicer!

    Formatted timestamp

    A nicely formatted time stamp

  7. To tweak the formatting of the time stamp’s date and time, you can modify the label expression using the built-in ‘format_date’, ‘year’, ‘month’, etc functions. Let’s try “format_date(animation_datetime(),’ddd dd MMM yyyy’)”:

    Tweaked expression

    Tweaked expression

Now, our final formatted time stamp looks like this:

Final, formatted time stamp

Final, formatted time stamp

…and there we go. Using this simple trick allows you to take advantage of all the possibilities which the QGIS labelling and expression engines allow!

*Bonus points for the first person to use this technique along with data defined controls for animating the label colour/size!

  • Page 1 of 1 ( 5 posts )
  • labelling

Back to Top

Sustaining Members