Related Plugins and Tags

QGIS Planet

Routing in polygon layers? Yes we can!

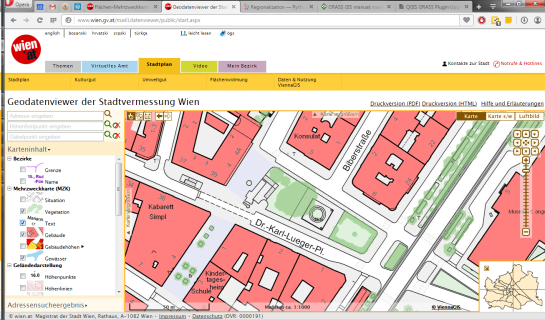
A few weeks ago, the city of Vienna released a great dataset: the so-called “Flächen-Mehrzweckkarte” (FMZK) is a polygon vector layer with an amazing level of detail which contains roads, buildings, sidewalk, parking lots and much more detail:

preview of the Flächen-Mehrzweckkarte

preview of the Flächen-Mehrzweckkarte

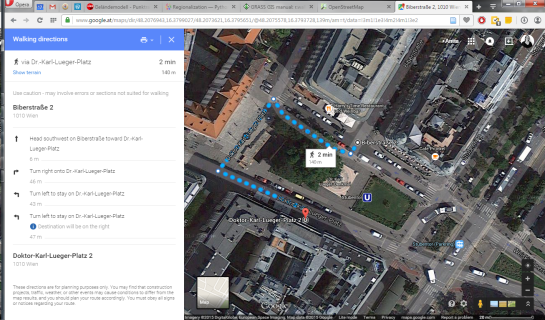
Now, of course we can use this dataset to create gorgeous maps but wouldn’t it be great to use it for analysis? One thing that has been bugging me for a while is routing for pedestrians and how it’s still pretty bad in many situations. For example, if I’d be looking for a route from the northern to the southern side of the square in the previous screenshot, the suggestions would look something like this:

Pedestrian routing in Google Maps

Pedestrian routing in Google Maps

… Great! Google wants me to walk around it …

Pedestrian routing on openstreetmap.org

Pedestrian routing on openstreetmap.org

… Openstreetmap too – but on the other side :P

Wouldn’t it be nice if we could just cross the square? There’s no reason not to. The routing graphs of OSM and Google just don’t contain a connection. Polygon datasets like the FMZK could be a solution to the issue of routing pedestrians over squares. Here’s my first attempt using GRASS r.walk:

Routing with GRASS r.walk

Routing with GRASS r.walk (Green areas are walk-friendly, yellow/orange areas are harder to cross, and red buildings are basically impassable.)

… The route crosses the square – like any sane pedestrian would.

The key steps are:

  1. Assigning pedestrian costs to different polygon classes
  2. Rasterizing the polygons
  3. Computing a cost raster for moving using r.walk
  4. Computing the route using r.drain

I’ve been using GRASS 7 for this example. GRASS 7 is not yet compatible with QGIS but it would certainly be great to have access to this functionality from within QGIS. You can help make this happen by supporting the crowdfunding initiative for the GRASS plugin update.


Fun with docker and GRASS GIS software

GRASS GIS and dockerSometimes, we developers get reports via mailing list that this & that would not work on whatever operating system. Now what? Should we be so kind and install the operating system in question in order to reproduce the problem? Too much work… but nowadays it has become much easier to perform such tests without having the need to install a full virtual machine – thanks to docker.

Disclaimer: I don’t know much about docker yet, so take the code below with a grain of salt!

In my case I usually work on Fedora or Scientific Linux based systems. In order to quickly (i.e. roughly 10 min of automated installation on my slow laptop) try out issues of GRASS GIS 7 on e.g., Ubuntu, I can run all my tests in docker installed on my Fedora box:

# we need to run stuff as root user
su
# Fedora 21: install docker 
yum -y docker-io

# Fedora 22: install docker
dnf -y install docker

# enable service
systemctl start docker
systemctl enable docker

Now we have a running docker environment. Since we want to exchange data (e.g. GIS data) with the docker container later, we prepare a shared directory beforehand:

# we'll later map /home/neteler/data/docker_tmp to /tmp within the docker container
mkdir /home/neteler/data/docker_tmp

Now we can start to install a Ubuntu docker image (may be “any” image, here we use “Ubuntu trusty” in our example). We will share the X11 display in order to be able to use the GUI as well:

# enable X11 forwarding
xhost +local:docker

# search for available docker images
docker search trusty

# fetch docker image from internet, establish shared directory and display redirect
# and launch the container along with a shell
docker run -v /data/docker_tmp:/tmp:rw -v /tmp/.X11-unix:/tmp/.X11-unix \
       -e uid=$(id -u) -e gid=$(id -g) -e DISPLAY=unix$DISPLAY \
       --name grass70trusty -i -t corbinu/docker-trusty /bin/bash

In almost no time we reach the command line of this minimalistic Ubuntu container which will carry the name “grass70trusty” in our case (btw: read more about Working with Docker Images):

root@8e0f233c3d68:/# 
# now we register the Ubuntu-GIS repos and get GRASS GIS 7.0
add-apt-repository ppa:ubuntugis/ubuntugis-unstable
add-apt-repository ppa:grass/grass-stable
apt-get update
apt-get install grass7

This will take a while (the remaining 9 minutes or so of the overall 10 minutes).

Since I like cursor support on the command line, I launch (again?) the bash in the container session:

root@8e0f233c3d68:/# bash
# yes, we are in Ubuntu here
root@8e0f233c3d68:/# cat /etc/issue

Now we can start to use GRASS GIS 7, even with its graphical user interface from inside the docker container:

# create a directory for our data, it is mapped to /home/neteler/data/docker_tmp/
# on the host machine 
root@8e0f233c3d68:/# mkdir /tmp/grassdata
# create a new LatLong location from EPSG code
# (or copy a location into /home/neteler/data/docker_tmp/)
root@8e0f233c3d68:/# grass70 -c epsg:4326 ~/grassdata/latlong_wgs84
# generate some data to play with
root@8e0f233c3d68:/# v.random n=30 output=random30
# start the GUI manually (since we didn't start GRASS GIS right away with it before)
root@8e0f233c3d68:/# g.gui

Indeed, the GUI comes up as expected!

GRASS GIS 7 GUI in docker container

GRASS GIS 7 GUI in docker container

You may now perform all tests, bugfixes, whatever you like and leave the GRASS GIS session as usual.
To get out of the docker session:

root@8e0f233c3d68:/# exit    # leave the extra bash shell
root@8e0f233c3d68:/# exit    # leave docker session

# disable docker connections to the X server
[root@oboe neteler]# xhost -local:docker

To restart this session later again, you will call it with the name which we have earlier assigned:

[root@oboe neteler]# docker ps -a
# ... you should see "grass70trusty" in the output in the right column

# we are lazy and automate the start a bit
[root@oboe neteler]# GRASSDOCKER_ID=`docker ps -a | grep grass70trusty | cut -d' ' -f1`
[root@oboe neteler]# echo $GRASSDOCKER_ID 
[root@oboe neteler]# xhost +local:docker
[root@oboe neteler]# docker start -a -i $GRASSDOCKER_ID

### ... and so on as described above.

Enjoy.

The post Fun with docker and GRASS GIS software appeared first on GFOSS Blog | GRASS GIS Courses.

A interactive command bar for QGIS

Something that has been on my mind for a long time is a interactive command interface for QGIS.  Something that you can easily open, run simple commands, and is interactive to ask for arguments when they are needed.

After using the command interface in Emacs for a little bit over the weekend – you can almost hear the Boos! from heavy Vim users :) – I thought this is something I must have in QGIS as well.  I’m sure it can’t be that hard to add.

So here it is.  A interactive command interface for QGIS.

commandbar

commandbar2

The command bar plugin (find it in the plugin installer) adds a simple interactive command bar to QGIS. Commands are defined as Python code and may take arguments.

Here is an example function:

@command.command("Name")
def load_project(name):
    """
    Load a project from the set project paths
    """
    _name = name
    name += ".qgs"
    for path in project_paths:
        for root, dirs, files in os.walk(path):
            if name in files:
                path = os.path.join(root, name)
                iface.addProject(path)
                return
    iface.addProject(_name)

All functions are interactive and if not all arguments are given when called it will prompt for each one.

Here is an example of calling the point-at function with no args. It will ask for the x and then the y

pointat

Here is calling point-at with all the args

pointatfunc

Functions can be called in the command bar like so:

my-function arg1 arg2 arg2

The command bar will split the line based on space and the first argument is always the function name, the rest are arguments passed to the function. You will also note that it will convert _ to - which is easier to type and looks nicer.

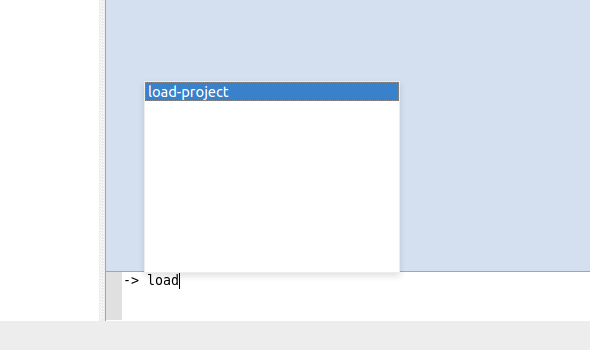
The command bar also has auto complete for defined functions – and tooltips once I get that to work correctly.

You can use CTRL + ; (CTRL + Semicolon), or CTRL + ,, to open and close the command bar.

What is a command interface without auto complete

autocomplete

Use Enter to select the item in the list.

How about a function to hide all the dock panels. Sure why not.

@command.command()
def hide_docks():
    docks = iface.mainWindow().findChildren(QDockWidget)
    for dock in docks:
        dock.setVisible(False)

alias command

You can also alias a function by calling the alias function in the command bar.

The alias command format is alias {name} {function} {args}

Here is an example of predefining the x for point-at as mypoint

-> alias mypoint point-at 100

point-at is a built in function that creates a point at x y however we can alias it so that it will be pre-called with the x argument set. Now when we call mypoint we only have to pass the y each time.

-> mypoint
(point-at) What is the Y?: 200

You can even alias the alias command – because why the heck not :)

-> alias a alias
a mypoint 100

a is now the shortcut hand for alias

WHY U NO USE PYTHON CONSOLE

The Python console is fine and dandy but we are not going for a full programming language here, that isn’t the point. The point is easy to use commands.

You could have a function called point_at in Python that would be

point_at(123,1331)

Handling incomplete functions is a lot harder because of the Python parser. In the end it’s easier and better IMO to just make a simple DSL for this and get all the power of a DSL then try and fit into Python.

It should also be noted that the commands defined in the plugin can still be called like normal Python functions because there is no magic there. The command bar is just a DSL wrapper around them.

Notes

This is still a bit of an experiment for me so things might change or things might not work as full expected just yet.

Check out the projects readme for more info on things that need to be done, open to suggestions and pull requests.

Also see the docs page for more in depth information


Filed under: Open Source, python, qgis Tagged: plugin, pyqgis, qgis

Crayfish 2.0: What's new!

After listening to user feedback we decided to do some major work on Crayfish. The changes include code refactoring, changes to the user interface, support for an additional file format, adding a vector and contour overlay, and a shiny new logo!

Crayfish 2.0

Time control

In the new version of Crayfish a time slider allows users to quickly browse through time. A drop-down menu allows the selection of an exact time.

Vector and contour overlay

In previous versions of Crayfish it was only possible to load contours and vectors from the same dataset. For example, it was not possible to show velocity vectors on top of depth contours. With the new Crayfish you can "unlock" the legend and choose different vectors or contours to be displayed. The video below demonstrates this in action.

Special times

Some datasets contain a special time-step outside the outputted time range. For example, Maximums and Minimums are stored at time 99999 in TUFLOW modelling package. Within the layer tree, additional time-steps items will now be shown if they exist within the dataset.

Additional file formats

We have added support for the XMDF file format. In addition, Hydro_AS 2D users should be able to open their files in the latest Crayfish.

New Python Module

We've refactored lots of code in the Crayfish library which makes it much easier to add support for further file formats and additional functionality. The Crayfish library now comes with a new Python module that allows easy manipulation with the mesh and results data - either in your custom scripts or within the QGIS Python console. For example, printing the coordinates of the nodes of a mesh together with their elevation takes just few lines of code:

import crayfish

m = crayfish.Mesh("/data/my_mesh.2dm")
o = m.dataset(0).output(0) # bed elevation data

for index, node in enumerate(m.nodes()):
print "Node XYZ: ", node.x, node.y, o.value(index)

New Profile tool plugin

If you use Profile tool plugin in QGIS, you can create a profile from the Crayfish layer and browse through the time. The profile gets updated as you change the output time.

Problems

If you have some feedback on our changes, suggestions for new functionality, or come across a bug, feel free to file a ticket on the issues page of the Crayfish github repository.

Sponsors

We’d like to thank Maroondah City Council for sponsoring some of the great features in this release.

You may also like...

Mergin Maps, a field data collection app based on QGIS. Mergin Maps makes field work easy with its simple interface and cloud-based sync. Available on Android, iOS and Windows. Screenshots of the Mergin Maps mobile app for Field Data Collection
Get it on Google Play Get it on Apple store

Introducing QGIS live layer effects!

I’m pleased to announce that the crowdfunded work on layer effects for QGIS is now complete and available in the current development snapshots! Let’s dive in and explore how these effects work, and check out some of the results possible using them.

I’ll start with a simple polygon layer, with some nice plain styling:

Nice and boring polygon layer

A nice and boring polygon layer

If I open the properties for this layer and switch to the Style tab, there’s a new checkbox for “Draw effects“. Let’s enable that, and then click the little customise effects button to its right:
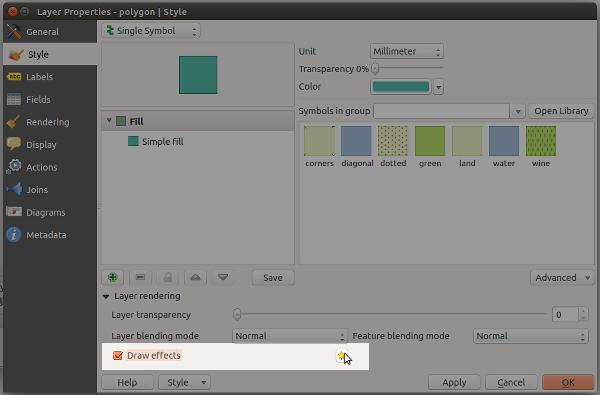
Enabling effects for the layer

Enabling effects for the layer

A new “Effects Properties” dialog opens:

Effects Properties dialog

Effects Properties dialog

You can see that currently the only effect listed is a “Source” effect. Source effects aren’t particularly exciting – all they do is draw the original layer unchanged. I’m going to change this to a “Blur” effect by clicking the “Effect type” combo box and selecting “Blur“:
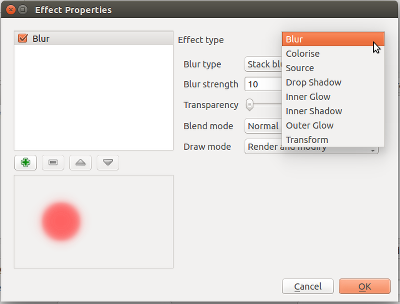
Changing to a blur effect

Changing to a blur effect

If I apply the settings now, you’ll see that the polygon layer is now blurry. Now we’re getting somewhere!

Blurry polygons!

Blurry polygons!

Ok, so back to the Effects Properties dialog. Let’s try something a bit more advanced. Instead of just a single effect, it’s possible to chain multiple effects together to create different results. Let’s make a traditional drop shadow by adding a “Drop shadow” effect under the “Source” effect:

Setting up a drop shadow

Setting up a drop shadow

Effects are drawn top-down, so the drop shadow will appear below the source polygons:

Live drop shadows!

Live drop shadows!

Of course, if you really wanted, you could rearrange the effects so that the drop shadow effect is drawn above the source!..

Hmmmm

Hmmmm…

You can stack as many effects as you like. Here’s a purple inner glow over a source effect, with a drop shadow below everything:
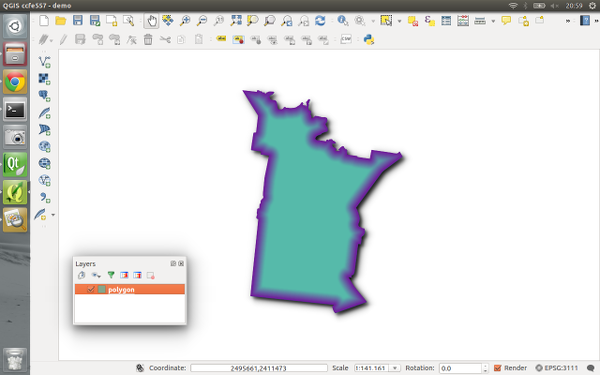
Inner glow, source, drop shadow...

Inner glow, source, drop shadow…

Now it’s time to get a bit more creative… Let’s explore the “transform” effect. This effect allows you to apply all kinds of transformations to your layer, including scaling, shearing, rotation and translation:

The transform effect

The transform effect

Here’s what the layer looks like if I add a horizontally shearing transform effect above an outer glow effect:

Getting freaky...

Getting tricky…

Transforms can get really freaky. Here’s what happens if we apply a 180° rotation to a continents layer (with a subtle nod to xkcd):
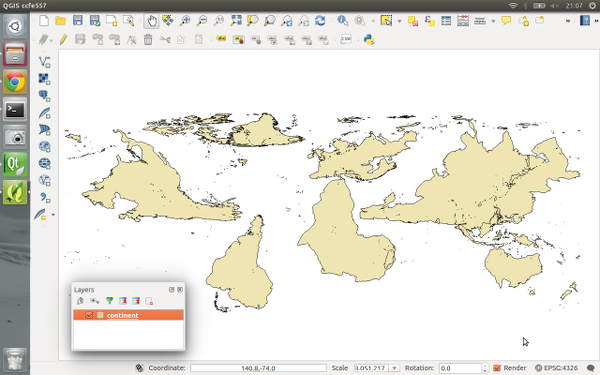
Change your perspective on the world!

Change your perspective on the world!

Remember that all these effects are applied when the layers are rendered, so no modifications are made to the underlying data.

Now, there’s one last concept regarding effects which really blasts open what’s possible with them, and that’s “Draw modes“. You’ll notice that this combo box contains a number of choices, including “Render“, “Modify” and “Render and Modify“:
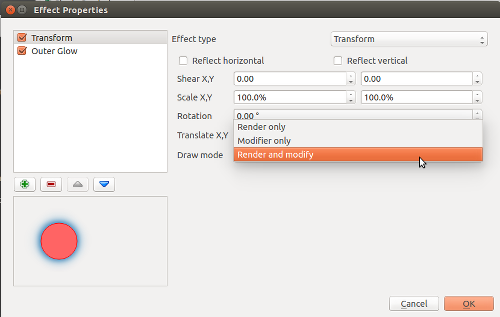
"Draw mode" options

“Draw mode” options

These draw modes control how effects are chained together. It’s easiest to demonstrate how draw modes work with an example, so this time I’ll start with a Transform effect over a Colorise effect. The transform effect is set to a 45° rotation, and the colorise effect set to convert to grayscale. To begin, I’ll set the transform effect to a draw mode of Render only:

The "Render only" draw mode

The “Render only” draw mode

In this mode, the results of the effect will be drawn but won’t be used to modify the underlying effects:
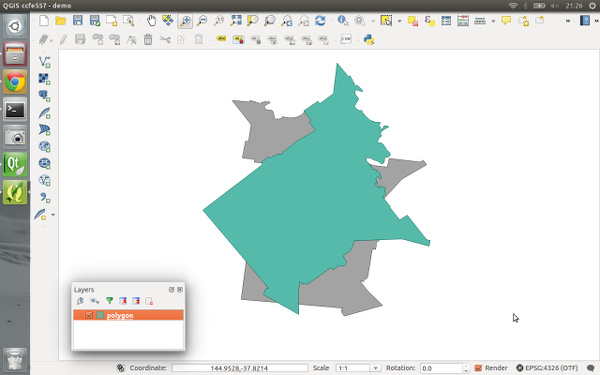
Rotation effect over the grayscale effect

Rotation effect over the grayscale effect

So what we have here is that the polygon is drawn rotated by 45° by the transform effect, and then underneath that there’s a grayscale copy of the original polygon drawn by the colorise effect. The results of the transform effect have been rendered, but they haven’t affected the underlying colorise effect.

If I instead set the Transform effect’s draw mode to “Modifier only” the results are quite different:
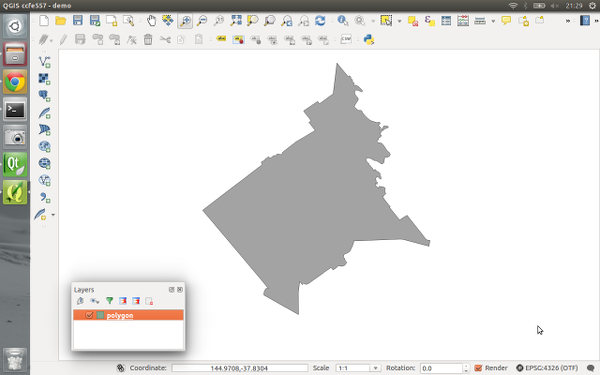
Rotation modifier for grayscale effect

Rotation modifier for grayscale effect

Now, the transform effect is rotating the polygon by 45° but the result is not rendered. Instead, it is passed on to the subsequent colorise effect, so that now the colorise effect draws a grayscale copy of the rotated polygon. Make sense? We could potentially chain a whole stack of modifier effects together to get some great results. Here’s a transform, blur, colorise, and drop shadow effect all chained together using modifier only draw modes:
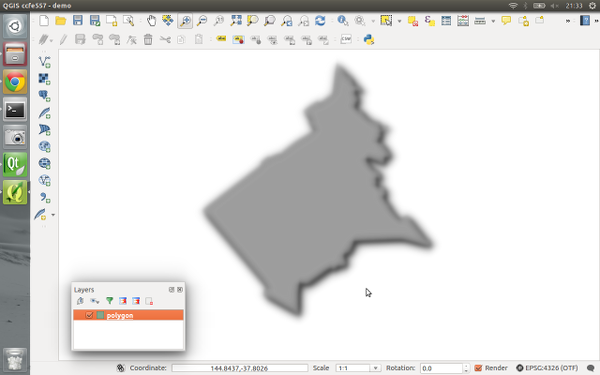
A stack of modifier effects

A stack of modifier effects

The final draw mode, “Render and modify” both renders the effect and applies its result to underlying effects. It’s a combination of the two other modes. Using draw modes to customise the way effects chain is really powerful. Here’s a combination of effects which turn an otherwise flat star marker into something quite different:
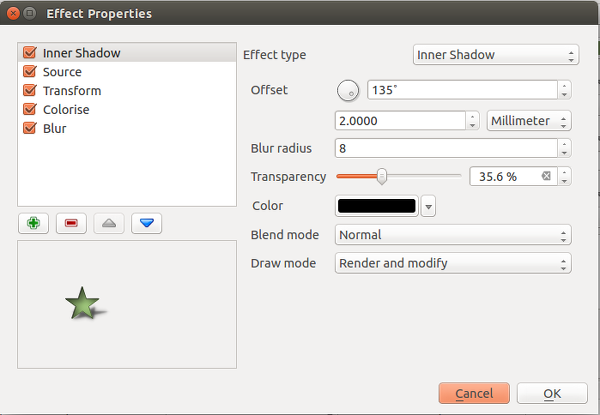
Lots of effects!

Lots of effects!

The last thing I’d like to point out is that effects can be either applied to an entire layer, or to the individual symbol layers for features within a layer. Basically, the possibilities are almost endless! Python plugins can also extend this further by implementing additional effects.

All this work was funded through the 71 generous contributors who donated to the crowdfunding campaign. A big thank you goes out to you all whole made this work possible! I honestly believe that this feature takes QGIS’ cartographic possibilities to whole new levels, and I’m really excited to see the maps which come from it.

Lastly, there’s two other crowdfunding campaigns which are currently in progress. Lutra consulting is crowdfunding for a built in auto trace feature, and Radim’s campaign to extend the functionality of the QGIS GRASS plugin. Please check these out and contribute if you’re interested in their work and would like to see these changes land in QGIS.

GRASS GIS 6.4.5RC1 released

GRASS GIS logoAfter months of development a first release candidate of GRASS GIS 6.4.5 is now available. This is a stability release of the GRASS GIS 6 line.

Source code download:
http://grass.osgeo.org/grass64/source/
http://grass.osgeo.org/grass64/source/grass-6.4.5RC1.tar.gz

Binaries download:
http://grass.osgeo.org/download/software/#g64x

To get the GRASS GIS 6.4.5RC1 source code directly from SVN:
svn checkout http://svn.osgeo.org/grass/grass/tags/release_20150406_grass_6_4_5RC1

Key improvements:
Key improvements of the GRASS GIS 6.4.5RC1 release include stability fixes (esp. vector library), some fixes for wxPython3 support, some module fixes, and more message translations.

See also our detailed announcement:
http://trac.osgeo.org/grass/wiki/Release/6.4.5RC1-News

First time users should explore the first steps tutorial after installation:
http://grasswiki.osgeo.org/wiki/Quick_wxGUI_tutorial

Release candidate management at
http://trac.osgeo.org/grass/wiki/Grass6Planning

Please join us in testing this release candidate for the final release.

Consider to donate pizza or beer for the next GRASS GIS Community Sprint (following the FOSS4G Europe 2015 in Como):
http://grass.osgeo.org/donations/

Thanks to all contributors!

About GRASS GIS

The Geographic Resources Analysis Support System (http://grass.osgeo.org), commonly referred to as GRASS GIS, is an Open Source Geographic Information System providing powerful raster, vector and geospatial processing capabilities in a single integrated software suite. GRASS GIS includes tools for spatial modeling, visualization of raster and vector data, management and analysis of geospatial data, and the processing of satellite and aerial imagery. It also provides the capability to produce sophisticated presentation graphics and hardcopy maps. GRASS GIS has been translated into about twenty languages and supports a huge array of data formats. It can be used either as a stand-alone application or as backend for other software packages such as QGIS and R geostatistics. It is distributed freely under the terms of the GNU General Public License (GPL). GRASS GIS is a founding member of the Open Source Geospatial Foundation (OSGeo).

The GRASS Development Team, April 2015

The post GRASS GIS 6.4.5RC1 released appeared first on GFOSS Blog | GRASS GIS Courses.

Create great looking hillshaded maps in QGIS

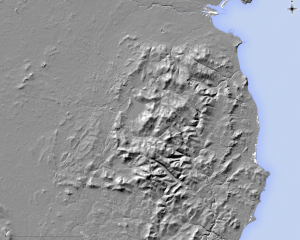
Wicklow-Topo-original

In this tutorial I will show you how to create a Hillshaded topographic map in QGIS. We will be using Shuttle Radar Topography Mission (SRTM) data, a near global Digital Elevation Model (DEM) collected in February 2000 aboard NASA’s Space Shuttle Endeavour (mission STS-99). The mission used a X-Band mapping radar to measure the Earth’s topography, built in collaboration with the U.S. Jet Propulsion Laboratory, the U.S. National Imagery and Mapping Agency (now the National Geospatial-Intelligence Agency), and the German and Italian space agencies.

The raw radar data has been continuously processed and improved since it was first collected. Countless artefacts have been painstakingly removed and areas of missing data have been filled using alternate data sources. The version we will be using is the 1 Arc-Second Global SRTM dataset, an enhanced 30 meter resolution DEM that was released last year. It is a substantial improvement over the 3 Arc-Second / 90 meter SRTM data previously available for Ireland. SRTM elevation data can be downloaded from the United States Geological Survey’s EarthExplorer website.

When first loaded into QGIS (via Add Raster Layer), the DEM is displayed as a rather uninformative black and white image.

Wicklow-Topo-blackwhite

It is therefore necessary to apply a suitable colour ramp that accentuates topography. While it is possible to create your own colour ramp, or use one of the colour ramps provided by QGIS, superior colour ramps can be downloaded using Etienne Tourigny’s Color Ramp Manager (Plugins – Manage and Install Plugins). After the plugin is added to QGIS, go to the Plugins menu again and choose the Colour Ramp Manager.

In the window that pops up, choose the full opt-city package and click check for update. The plugin will then download the cpt-city library, a collection of over a hundred cartographic gradients (version 2.15). After the package downloads, quit the dialogue.

Back in QGIS, right click the DEM layer to bring up the Layer Properties dialogue. In the Style tab, change the render type from single band grey to single band pseudocolor. Then click new color ramp and new color ramp again, choose the cpt-city color ramp to bring up the cpt-city dialogue. Click topography and choose the sd-a colour ramp. While this is an excellent colour ramp, I find its colours are a bit too strong for my liking.

Still in the Layer Properties dialogue, change the min and max values to match your DEM’s lowest and highest elevations values and click classify, this applies the new colour ramp. Next, change the brightness to 30 and lower the contrast and saturation to -20. Click OK to apply the new style and quit the Layer Properties dialogue.

Wicklow-Topo-noShade

Next we need to create a Hillshade layer from the DEM, a 3D like visual representation of topographic relief. This is achieved via the menu Raster – Analysis – DEM (Terrain models). There is one small catch, the hillshading algorithm assumes the DEM’s horizontal units are in meters (they are decimal degrees). We need to enter a scale correction factor of 111120 (in the Scale ratio vert. units to horiz. box). Once that is all done, select an output path to save the generated hillshade and click OK. Generating a hillshade may take up to a minute depending on the size of your DEM.

Wicklow-Topo-hillshade

After the hillshade is created, open its Layer properties dialogue. Change the min and max values to 125 and 255, increase its brightness to 45 and contrast to 20. Finally, switch the blending mode from normal to multiply. This allows the DEM beneath the hillshade to show though. Click OK to apply the new style.

If you followed these steps correctly you will have created a fine looking topographic map similar to the one below. It’s also possible to create contours but that’s a tutorial for another day.

Wicklow-Topo

Technical note:

There are two hillshading algorithms available in QGIS, one by Horne (1981) and another by Zevenbergen and Thorne (1987). Jones (1998) examined the quality of hillshading algorithms, he found the algorithm of Fleming and Ho€er (1979) is slightly superior to Horne’s (1981) algorithm. Zevenbergen and Thorne’s (1987) algorithm is a derivation of Fleming and Ho€er’s (1979) formula. QGIS uses Horne’s (1981) algorithm by default.

References:

Horn, B.K., 1981. Hill shading and the reflectance map. Proceedings of the IEEE, 69, 14–47.

Jones, K.H., 1998. A comparison of algorithms used to compute hill slope as a property of the DEM [PDF]. Computers & Geosciences, 24, 315–323.

Zevenbergen, L.W. & Thorne, C.R., 1987. Quantitative analysis of land surface topography. Earth surface processes and landforms, 12, 47–56.

Why QGIS Class Names Start with Qgs

If you're a developer, or have looked at the QGIS source code, you've likely noticed that most C++ classes in the project start with Qgs.

Back before the dark ages of QGIS, Trolltech (now Digia) allowed you to reserve name prefixes for classes that used the Qt framework.

Shortly afterwards, I reserved the gs prefix for my use, resulting in class names that start with Qgs.

You might think this is based on some mangling of words like QGIS or perhaps GIS, but it was purely egocentric:

As far as I can tell, reservation of prefix names is no longer possible. For a view into what it was like back then, take a look at the Internet Archive.

Although the choice of prefix wasn't based on technology or discipline, years later it seems to fit...

Plugin Builder 2.8.1

This minor update to the Plugin Builder allows you to choose where your plugin menu will be located. Previously your menu was placed under the Plugins menu. At version 2.8.1 you can choose from the following main menu locations: Plugins Database Raster Vector Web Plugins is the default choice when you open Plugin Builder. The value you choose is also written to the category field in your metadata.txt file.

QGIS Development with Plugin Builder and pb_tool

The Plugin Builder is a great tool for generating a working plugin project that you can customize.

One of the main tasks in the development cycle is deploying the plugin to the QGIS plugin directory for testing. Plugin Builder comes with a Makefile that can be used on Linux and OS X to aid in development. Depending on your configuration, the Makefile may work on Windows.

To help in managing development of your projects, we've come up with another option---a Python tool called pb_tool, which works anywhere QGIS runs.

Here's what it provides:

Usage: pb_tool [OPTIONS] COMMAND [ARGS]...

  Simple Python tool to compile and deploy a QGIS plugin. For help on a
  command use --help after the command: pb_tool deploy --help.

  pb_tool requires a configuration file (default: pb_tool.cfg) that declares
  the files and resources used in your plugin. Plugin Builder 2.6.0 creates
  a config file when you generate a new plugin template.

  See http://g-sherman.github.io/plugin_build_tool for for an example config
  file. You can also use the create command to generate a best-guess config
  file for an existing project, then tweak as needed.

Options:
  --help  Show this message and exit.

Commands:
  clean       Remove compiled resource and ui files
  clean_docs  Remove the built HTML help files from the...
  compile     Compile the resource and ui files
  create      Create a config file based on source files in...
  dclean      Remove the deployed plugin from the...
  deploy      Deploy the plugin to QGIS plugin directory...
  doc         Build HTML version of the help files using...
  list        List the contents of the configuration file
  translate   Build translations using lrelease.
  validate    Check the pb_tool.cfg file for mandatory...
  version     Return the version of pb_tool and exit
  zip         Package the plugin into a zip file suitable...

In the command summary, a description ending in ... means there is more to see using the help switch:

 pb_tool zip --help
Usage: pb_tool zip [OPTIONS]

  Package the plugin into a zip file suitable for uploading to the QGIS
  plugin repository

Options:
  --config TEXT  Name of the config file to use if other than pb_tool.cfg
  --help         Show this message and exit.

The Configuration File

pb_tool relies on a configuration file to do its work. Here's a sample pb_tool.cfg file:

# Configuration file for plugin builder tool
# Sane defaults for your plugin generated by the Plugin Builder are
# already set below.
#
[plugin]
# Name of the plugin. This is the name of the directory that will
# be created in .qgis2/python/plugins
name: TestPlugin

[files]
# Python  files that should be deployed with the plugin
python_files: __init__.py test_plugin.py test_plugin_dialog.py

# The main dialog file that is loaded (not compiled)
main_dialog: test_plugin_dialog_base.ui

# Other ui files for dialogs you create (these will be compiled)
compiled_ui_files: foo.ui

# Resource file(s) that will be compiled
resource_files: resources.qrc

# Other files required for the plugin
extras: icon.png metadata.txt

# Other directories to be deployed with the plugin.
# These must be subdirectories under the plugin directory
extra_dirs:

# ISO code(s) for any locales (translations), separated by spaces.
# Corresponding .ts files must exist in the i18n directory
locales: af

[help]
# the built help directory that should be deployed with the plugin
dir: help/build/html
# the name of the directory to target in the deployed plugin
target: help

The configuration file is pretty much self-explanatory and represents that generated by Plugin Builder 2.6 for a new plugin. As you develop your code, you simply add the file names to the appropriate sections.

Plugin Builder 2.6 will be available the week of the QGIS 2.6 release. In the meantime, you can use pb_tool create to create a config file. See the pb_tool website for more information.

Deploying

Here's what a deployment looks like with pb_tool:

$ pb_tool deploy
Deploying will:
            * Remove your currently deployed version
            * Compile the ui and resource files
            * Build the help docs
            * Copy everything to your .qgis2/python/plugins directory

Proceed? [y/N]: y
Removing plugin from /Users/gsherman/.qgis2/python/plugins/TestPlugin
Deploying to /Users/gsherman/.qgis2/python/plugins/TestPlugin
Compiling to make sure install is clean
Skipping foo.ui (unchanged)
Compiled 0 UI files
Skipping resources.qrc (unchanged)
Compiled 0 resource files
Building the help documentation
sphinx-build -b html -d build/doctrees   source build/html
Running Sphinx v1.2b1
loading pickled environment... done
building [html]: targets for 0 source files that are out of date
updating environment: 0 added, 0 changed, 0 removed
looking for now-outdated files... none found
no targets are out of date.

Build finished. The HTML pages are in build/html.
Copying __init__.py
Copying test_plugin.py
Copying test_plugin_dialog.py
Copying test_plugin_dialog_base.ui
Copying foo.py
Copying resources_rc.py
Copying icon.png
Copying metadata.txt
Copying help/build/html to /Users/gsherman/.qgis2/python/plugins/TestPlugin/help

Getting Started

For details on installing and using pb_tool, see: http://g-sherman.github.io/pluginbuildtool

PyQGIS Resources

Here is a short list of resources available when writing Python code in QGIS. If you know of others, please leave a comment. Blogs/Websites In alphabetical order: GIS StackExchange Kartoza Linfiniti Lutra Consulting Nathan Woodrow Nyall Dawson Twitter #pyqgis Documentation Choose the version to match your QGIS install PyQGIS Cookbook QGIS API Example Code Existing plugins can be a great learning tool Code Snippets in the PyQGIS Cookbook Plugins/Tools Script Runner: Run scripts to automate QGIS tasks Plugin Builder: Create a starter plugin that you can customize to complete your own plugin Plugin Reloader: Allows you to reload a plugin from within QGIS pb_tool: Tool to compile and deploy your plugins Books PyQGIS Programmers Guide Geospatial Desktop: GIS Scripting (PDF)

Faking a Data Provider with Python

QGIS data providers are written in C++, however it is possible to simulate a data provider in Python using a memory layer and some code to interface with your data. Why would you want to do this? Typically you should use the QGIS data providers, but here are some reasons why you may want to give it a go: There is no QGIS data provider The generic access available through OGR doesn’t provide all the features you need You have no desire to write a provider in C++ No one will write a C++ provider for you, for any amount of money If you go this route you are essentially creating a bridge that connects QGIS and your data store, be it flat file, database, or some other binary format.

The PyQGIS Programmer's Guide

The PyQGIS Programmer's Guide is now available in both paperback and PDF. A sample chapter is also available for download.

The book is fully compatible with the QGIS 2.x series of releases.

PyQGIS Programmer's Guide Available

The preview release of the PyQGIS Programmer’s Guide is now available for purchase from Locate Press.

QGIS Training Opportunities

We’re planning a couple of training classes for March: Introduction to QGIS Extending QGIS with Python Each is a one day class and we plan to run them back to back. If you are local or just want to come to Alaska in March for some spring skiing, northern lights viewing, or to experience the equinox, please hop over to GeoApt and let us know so we can plan accordingly.

Plugin Builder 2.8

Plugin Builder 2.8 is now available. This is a minor update that adds: Suggestion for setting up an issue tracker and creating a code repository Suggestion for a home page Tag selection from a list of current tags Documentation update, including information about using pb_tool to compile, deploy, and package your plugin New URLs for Plugin Builder’s home page and bug tracking Optional is now Recommended In previous versions the following items were “Optional” when creating a new plugin:

A Quick Guide to Getting Started with PyQGIS on Windows

Getting started with Python and QGIS can be a bit overwhelming. In this post we give you a quick start to get you up and running and maybe make your PyQGIS life a little easier. There are likely many ways to setup a working PyQGIS development environment—this one works pretty well. Contents Requirements Installing OSGeo4W Setting the Environment Python Packages Working on the Command Line IDE Example Workflow Creating a New Plugin Working with Existing Plugin Code Troubleshooting

Time Manager 1.6 – now with feature interpolation

Over the last couple of weeks, Karolina has been very busy improving and expanding Time Manager. This post is to announce the 1.6 release of Time Manager which brings you many fixes and exciting new features.

Screenshot 2015-03-25 17.58.38

What’s this feature interpolation you’re talking about?

Interpolation is really helpful if you have multiple observations of the same (moving) real-world object at different points in time and you want to visualize the movement between the observations. This can be used to visualize animal paths, vehicle tracks, or any other movement in space.

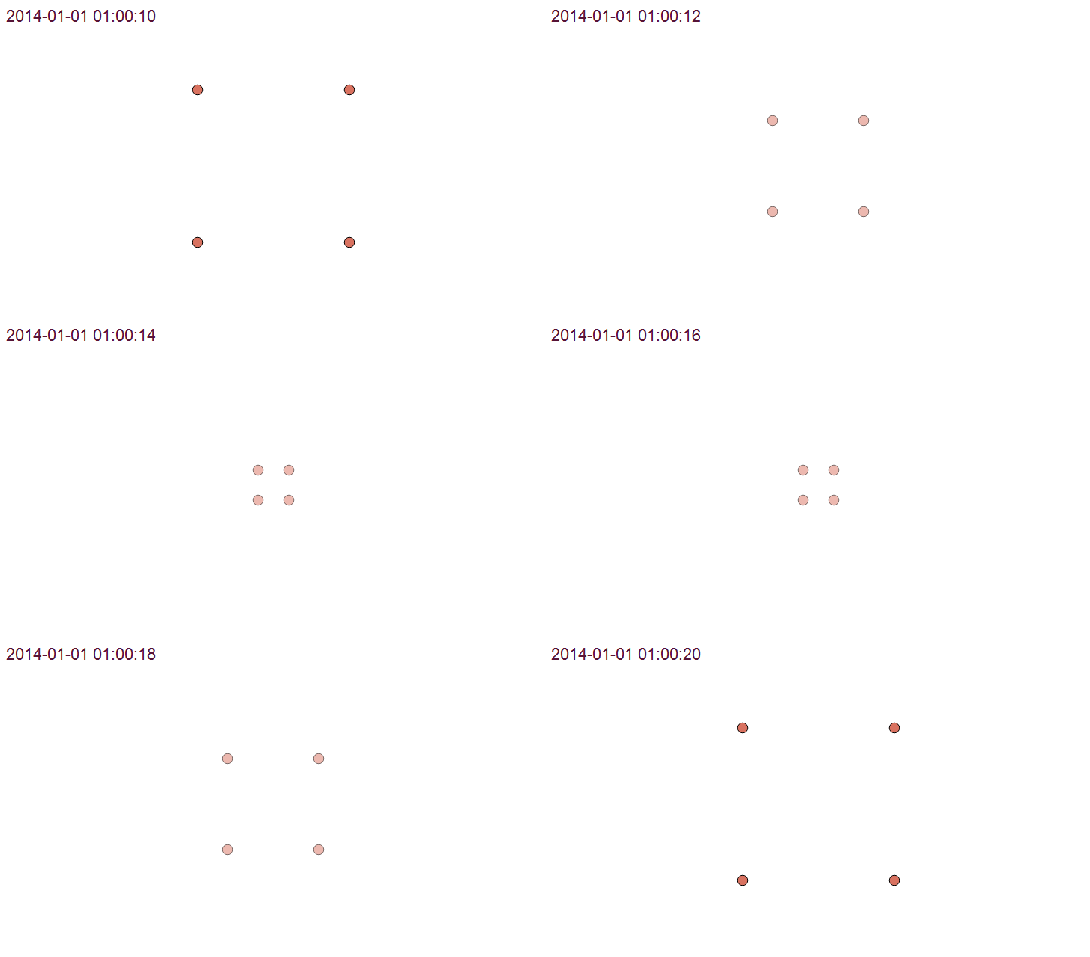
The following example shows a simple layer which contains 12 point features (3 for each id value).

Screenshot 2015-03-25 17.50.55

Using Time Manager interpolation, it is easy to create animations with interpolated positions between observations:

animation

How is it done?

When you open the Time Manager 1.6 Settings | Add layer dialog, you will find a new option for interpolation settings. This first version supports linear interpolation of point features but more options might be added in the future. Note how the id attribute is specified to let Time Manager know which features belong to the same real-world object.

Screenshot 2015-03-25 17.43.08

For the interpolation, Time Manager creates a new layer which contains the interpolated features. You can see this layer in the layer list.

Screenshot 2015-03-25 17.46.13

I’m really looking forward to seeing all the great animations this feature will enable. Thanks Karolina for making this possible!


Inofficial QGIS 2.8 RPMs for EPEL 7: Fedora 20, Fedora 21, Centos 7, Scientific Linux 7

qgis-icon_smallThanks to the work of Devrim Gündüz, Volker Fröhlich, Dave Johansen, Rex Dieter and other Fedora/EPEL packagers I had an easy going to prepare RPM packages of QGIS 2.8 Wien for Fedora 20 and 21, Centos 7, and Scientific Linux 7.

The base SRPM package I copied from Fedora’s koji server, modified the SPEC file in order to remove the now outdated PyQwt bindings (see bugzilla) and compiled QGIS 2.8 via the great COPR platform.

Repo: https://copr.fedoraproject.org/coprs/neteler/QGIS-2.8-Wien/

The following packages can now be installed and tested on epel-7-x86_64 (Centos 7, Scientific Linux 7, etc.), Fedora-20-x86_64, and Fedora-21-x86_64:

  • qgis 2.8.1
  • qgis-debuginfo 2.8.1
  • qgis-devel 2.8.1
  • qgis-grass 2.8.1
  • qgis-python 2.8.1
  • qgis-server 2.8.1

Installation instructions (run as “root” user or use “sudo”):

# EPEL7:
yum -y install epel-release
yum -y install wget
# https://copr.fedoraproject.org/coprs/neteler/python-OWSLib/
wget -O /etc/yum.repos.d/neteler-python-OWSLib-epel-7.repo https://copr.fedoraproject.org/coprs/neteler/python-OWSLib/repo/epel-7/neteler-python-OWSLib-epel-7.repo
yum -y update
yum -y install python-OWSLib
wget -O /etc/yum.repos.d/qgis-epel-7.repo https://copr.fedoraproject.org/coprs/neteler/QGIS-2.8-Wien/repo/epel-7/neteler-QGIS-2.8-Wien-epel-7.repo
yum update
yum install qgis qgis-grass qgis-python qgis-server

# Fedora 20:
wget -O /etc/yum.repos.d/qgis-epel-7.repo https://copr.fedoraproject.org/coprs/neteler/QGIS-2.8-Wien/repo/fedora-20/neteler-QGIS-2.8-Wien-fedora-20.repo
yum update
yum install qgis qgis-grass qgis-python qgis-server

# Fedora 21:
wget -O /etc/yum.repos.d/qgis-epel-7.repo https://copr.fedoraproject.org/coprs/neteler/QGIS-2.8-Wien/repo/fedora-21/neteler-QGIS-2.8-Wien-fedora-21.repo
yum update
yum install qgis qgis-grass qgis-python qgis-server

The other packages are optional (well, also qgis-grass, qgis-python, and qgis-server…).

Enjoy!

PS: Of course I hope that QGIS 2.8 officially hits EPEL7 anytime soon! My COPR repo is just a temporary bridge towards that goal.

EDIT 30 April 2015:

  • updated EPEL7 installation for python-OWSLib dependency

The post Inofficial QGIS 2.8 RPMs for EPEL 7: Fedora 20, Fedora 21, Centos 7, Scientific Linux 7 appeared first on GFOSS Blog | GRASS GIS Courses.

In memory of Tim York

The other weekend the world lost a great guy, someone so nice that you struggle to find anything bad to say about him at all. Tim was only 27 but died tragically on the weekend, to the complete shock of everyone that knew him. I don’t think anyone really knew what to feel at that point, and even now it is still really hard to take it.

Tim was very well known in the GIS space here in Australia, and extremely well respected by everyone that knew him. I attended Locate15, where I was going catch up for a beer and chat with him, and almost everyone I talked to knew who he was and how great he really was. I would not doubt at all he could have become CEO or leader at a large company, no doubt at all.

It was mentioned at the funeral that we should try to think of how Tim made our lives better. For that I can fully thank Tim for my job at DMS. It was at a SSSI event after talking with my now manager about if they would like me at DMS that I had caught up with Tim and he encouraged me to move into the private sector. For that I thank him a lot.

I have started to read “How To Win Friends & Influence People” by Dale Carnegie, because one can always do with more skills in life, and some important points from the book:

  • Become genuinely interested in other people.
  • Smile.
  • Remember a person’s name.
  • Be a good listener. Encourage others to talk about themselves.
  • Talk in terms of the other person’s interests

This. All of this is what Tim did. This is the reason it always felt great to talk to him and be around him, even when I only saw him a few times.

I don’t know if Tim’s life was better for knowing me, given his large group of friends and great partner I suspect not, but I know sure as shit that mine was better for having known him.

319187_10150351976087518_3388507_n


Filed under: personal

  • <<
  • Page 68 of 142 ( 2821 posts )
  • >>

Back to Top

Sustaining Members