Related Plugins and Tags

QGIS Planet

Results of the QGIS user survey 2015

In autumn last year, we ran a rather large-scale user survey, which was translated into many languages and advertised here on this blog. The final reports can be found here:

(Let me know if you have links to other language versions which were not sent to the mailing list.)

Looking at the English report, most responses were filed by regular (49.7%) and advanced users (35.9%) who use QGIS at least several times per week. One interesting result is that responders feel that the project should still prioritise new features when spending funds:

Top 3 “highest priority for spending QGIS funds”

  1. Important features that are missing (50%)
  2. More bugfixing (24.1%)
  3. Improved user documentation (12.4%)

This is also confirmed by the free comments section were roughly 23% of responders were asking for new features, 19% called for more stability (fewer releases and new features), and 9% for better documentation.

Documentation improvements were followed closely by calls for a more structured approach to plugins (making it easier to find the right tool for the job), stricter plugin documentation requirements, consolidation of plugins with similar functionality, and integration of key plugins into core.

When interpreting these results, it’s important to keep in mind that responses are skewed towards experienced users, who are more likely to require specialist functionality. Beginners on the other hand might rank stability, ease of use of core functionality, and good documentation higher.


City flows unfolding with the other Processing

A previous version of this post has been published in German on Die bemerkenswerte Karte.

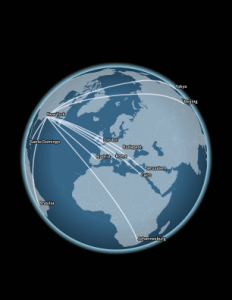
Visualizations of mobility data such as taxi or bike sharing trips have become very popular. One of the best most recent examples is cf. city flows developed by Till Nagel and Christopher Pietsch at the FH Potsdam. cf. city flows visualizes the rides in bike sharing systems in New York, Berlin and London at different levels of detail, from overviews of the whole city to detailed comparisons of individual stations:

The visualizations were developed using Unfolding, a library to create interactive maps and geovisualizations in Processing (the other Processing … not the QGIS Processing toolbox) and Java. (I tinkered with the Python port of Processing in 2012, but this is certainly on a completely different level.)

The insights into the design process, which are granted in the methodology section section of the project website are particularly interesting. Various approaches for presenting traffic flows between the stations were tested. Building on initial simple maps, where stations were connected by straight lines, consecutive design decisions are described in detail:

The results are impressive. Particularly the animated trips convey the dynamics of urban mobility very well:

However, a weak point of this (and many similar projects) is the underlying data. This is also addressed directly by the project website:

Lacking actual GPS tracks, the trip trajectories are rendered as smooth paths of the calculated optimal bike routes

This means that the actual route between start and drop off location is not known. The authors therefore estimated the routes using HERE’s routing service. The visualization therefore only shows one of many possible routes. However, cyclists don’t necessarily choose the “best” route as determined by an algorithm – be it the most direct or otherwise preferred. The visualization does not account for this uncertainty in the route selection. Rather, it gives the impression that the cyclist actually traveled on a certain route. It would therefore be undue to use this visualization to derive information about the popularity of certain routes (for example, for urban planning). Moreover, the data only contains information about the fulfilled demand, since only trips that were really performed are recorded. Demand for trips which could not take place due to lack of bicycles or stations, is therefore missing.

As always: exercise some caution when interpreting statistics or visualizations and then sit back and enjoy the animations.

If you want to read more about GIS and transportation modelling, check out
Loidl, M.; Wallentin, G.; Cyganski, R.; Graser, A.; Scholz, J.; Haslauer, E. GIS and Transport Modeling—Strengthening the Spatial Perspective. ISPRS Int. J. Geo-Inf. 2016, 5, 84. (It’s open access.)


Special FOSS4G offer: 25% off QGIS Map Design

FOSS4G2016 is drawing closer quickly. To get in the mood for a week full of of geogeekery, Locate Press is offering a special FOSS4G discount for QGIS Map Design.

Use the code foss4gbonn to get 25% off your copy.

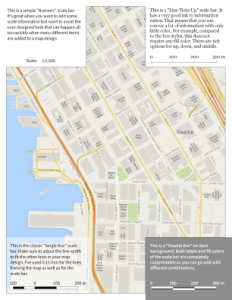
QGIS Map Design is the reference book to get if you want to bring your mapping skills up to speed. The book comes with a download for all our example map projects:

qmd114 qmd132 qmd140 qmd128 qmd174 qmd58 qmd152 qmd158 qmd64 qmd46 qmd146 qmd188 qmd164 qmd20 qmd90 qmd78 qmd84 qmd108 qmd184 qmd34 qmd180 qmd120 qmd26 qmd104 qmd168 qmd100 qmd52

Looking forward to meeting you in Bonn!


How to effectively get things changed in QGIS – a follow up

Last week I posted regarding some thoughts I’ve had recently concerning what I perceive as a general confusion about how QGIS is developed and how users can successfully get things to change in the project. The post certainly started a lot of conversation! However, based on feedback received I realise some parts of the posts were being misinterpreted and some clarification is needed. So here we go…

1. Please keep filing bug reports/feature requests

I don’t think I was very clear about this – but my original post wasn’t meant to be a discouragement from filing bug reports or feature requests. The truth is that there is a LOT of value in these reports, and if you don’t file a report then the QGIS team will never be aware of the bug or your feature idea. Here’s some reasons why you SHOULD file a report:

  • QGIS developers are a conscientious mob, and generally take responsibility for any regressions they’ve caused by changes they’ve made. In other words, there’s very much an attitude of “I-broke-it, I’ll-fix-it” in the project. So, if a new feature is buggy or has broken something else then filing bugs ASAP is the best way to make the developer aware of these issues. In my experience they’ll usually be addressed rapidly.
  • As mentioned in the original post – there’s always a pre-release bug fix sprint, so filing a bug (especially if it’s a critical one) may mean that it’s addressed during this sprint.
  • Filing feature requests can gain traction if your idea is innovative, novel, or interesting enough to grab a developer’s attention!

Speaking for myself, I regularly check new incoming tickets (at least once a day), and I know I’m not the only one. So filing a report WILL bring your issue to developer’s attention. Which leads to…

2. Frustration is understandable!

I can honestly understand why people get frustrated and resort to an aggressive “why hasn’t this been fixed yet?!” style reply. I believe that these complaints are caused because people have the misunderstanding that filing a bug report is the ONLY thing they can do to get an issue fixed. If filing a report IS the only avenue you have to get something fixed/implemented, then it’s totally understandable to be annoyed when your ticket gets no results. This is a failing on behalf of the project though – we need to be clearly communicating that filing a report is the LEAST you can do. It’s a good first step, but on its own it’s just the beginning and needs to be followed up by one of the methods I described in the initial post.

3. It applies to more than just code

When I wrote the original piece I focused on just the code aspect of the QGIS project. That’s only because I’m a developer and it’s the area I know best. But it applies equally across the whole project, including documentation, translations, infrastructure, websites, packaging QGIS releases, etc. In fact, some of these non-code areas are the best entry points into the project as they don’t require a development background, and eg the documentation and translation teams have done a great job making it easy to submit contributions. Find something missing in the QGIS documentation? Add it yourself! Missing a translation of the website which prevents QGIS adoption within your community? Why not sponsor a translator to tackle this task?!

4. It applies to more than just QGIS!

Again, I wrote the original piece focusing on QGIS because that’s the project I’m most familiar with. You could just as easily substitute GDAL, GEOS, OpenLayers, PostGIS, Geoserver, R, D3, etc… in and it would be equally valid!

Hopefully that helps clarify some of the points raised by the earlier article. Let’s keep the discussion flowing – I’d love to hear if you have any other suggestions or questions raised by this topic.


The road to QGIS 3.0 – part 1

qgis_icon.svgAs we discussed in QGIS 3 is under way, the QGIS project is working toward the next major version of the application and these developments have major impact on any custom scripts or plugins you’ve developed for QGIS.

We’re now just over a week into this work, and already there’s been tons of API breaking changes landing the code base. In this post we’ll explore some of these changes, what’s motivated them, and what they mean for your scripts.

The best source for keeping track of these breaking changes is to watch the API break documentation on GitHub. This file is updated whenever a change lands which potentially breaks plugins/scripts, and will eventually become a low-level guide to porting plugins to QGIS 3.0.

API clean-ups

So far, lots of the changes which have landed have related to cleaning up the existing API. These include:

Removal of deprecated API calls

The API has been frozen since QGIS 2.0 was released in 2013, and in the years since then many things have changed. As a result, different parts of the API were deprecated along the way as newer, better ways of doing things were introduced. The deprecated code was left intact so that QGIS 2.x plugins would still all function correctly. By removing these older, deprecated code paths it enables the QGIS developers to streamline the code, remove hacky workarounds, untested methods, and just generally “clean things up”. As an example, the older labelling system which pre-dates QGIS 2.0 (it had no collision detection, no curved labels, no fancy data defined properties or rule based labelling!) was still floating around just in case someone tried to open a QGIS 1.8 project. That’s all gone now, culling over 5000 lines of outdated, unmaintained code. Chances are this won’t affect your plugins in the slightest. Other removals, like the removal of QgsMapRenderer (the renderer used before multi-threaded rendering was introduced) likely have a much larger impact, as many scripts and plugins were still using QgsMapRenderer classes and calls. These all need to be migrated to the new QgsMapRendererJob and QgsMapSettings classes.

Renaming things for consistency

Consistent naming helps keep the API predictable and more user friendly. Lots of changes have landed so far to make the naming of classes and methods more consistent. These include things like:

  • Making sure names use consistent capitalization. Eg, there was previously methods named “writeXML” and “writeXml”. These have all been renamed to consistently use camel case, including for acronyms. (In case you’re wondering – this convention is used to follow the Qt library conventions).
  • Consistent use of terms. The API previously used a mix of “CRS” and “SRS” for similar purposes – it now consistently uses “CRS” for a coordinate reference system.
  • Removal of abbreviations. Lots of abbreviated words have been removed from the names, eg “destCrs” has become “destinationCrs”. The API wasn’t consistently using the same abbreviations (ie “dest”/”dst”/”destination”), so it was decided to remove all use of abbreviated words and replace them with the full word. This helps keep things predictable, and is also a bit friendlier for non-native English speakers.

The naming changes all need to be addressed to make existing scripts and plugins compatible with QGIS 3.0. It’s potentially quite a lot of work for plugin developers, but in the long term it will make the API easier to use.

Changes to return and argument types

There’s also been lots of changes relating to the types of objects returned by functions, or the types of objects used as function arguments. Most of these involve changing the c++ types from pointers to references, or from references to copies. These changes are being made to strengthen the API and avoid potential crashes. In most cases they don’t have any affect on PyQGIS code, with some exceptions:

  • Don’t pass Python “None” objects as QgsCoordinateReferenceSystems or as QgsCoordinateTransforms. In QGIS 3.0 you must pass invalid QgsCoordinateReferenceSystem objects (“QgsCoordinateReferenceSystem()”) or invalid QgsCoordinateTransform (“QgsCoordinateTransform()”) objects instead.

Transparent caching of CRS creation

The existing QgsCRSCache class has been removed. This class was used to cache the expensive results of initializing a QgsCoordinateReferenceSystem object, so that creating the same CRS could be done instantly and avoid slow databases lookups. In QGIS 3.0 this caching is now handled transparently, so there is no longer a need for the separate QgsCRSCache and it has been removed. If you were using QgsCRSCache in your PyQGIS code, it will need to be removed and replaced with the standard QgsCoordinateReferenceSystem constructors.

This change has the benefit that many existing plugins which were not explicitly using QgsCRSCache will now gain the benefits of the faster caching mechanism – potentially this could dramatically speed up existing plugin algorithms.

In summary

The QGIS developers have been busy fixing, improving and cleaning up the PyQGIS API. We recognise that these changes result in significant work for plugin and script developers, so we’re committed to providing quality documentation for how to adapt your code for these changes, and we will also investigate the use of automated tools to help ease your code transition to QGIS 3.0. We aren’t making changes lightly, but instead are carefully refining the API to make it more predictable, streamlined and stable.

If you’d like assistance with (or to outsource) the transition of your existing QGIS scripts and plugins to QGIS 3.0, just contact us at North Road to discuss. Every day we’re directly involved in the changes moving to QGIS 3.0, so we’re ideally placed to make this transition painless for you!

Exploring variables in QGIS 2.12, part 1

It’s been quite some time since I last had a chance to blog and a lot has happened since then. Not least of which is that QGIS 2.12 has now been released with a ton of new features that I’ve neglected to write about! To try and get things moving along here again I’m planning on writing a short series exploring how variables work in QGIS 2.12 and the exciting possibilities they unlock. First, let’s look into how variables can be used with QGIS map composer…

So, let’s get started! A new concept introduced in QGIS 2.12 is the ability to set custom variables for use in QGIS’ expression engine. The easiest way to do this is through the “Project Properties” dialog, under the “Variables” section:

Default project variables

You’ll see in the screenshot above that a blank project includes a number of read-only preset variables, such as @project_path and @project_title. (All variables in QGIS are prefixed with an @ character to differentiate them from fields or functions). You can add your own variables to this list by clicking the + button, as shown below:

Adding new variables to a project

Here I’ve added some new variables, @project_version and @author. Now, any of these variables can be used anywhere that you can use expressions in QGIS, including the field calculator, data defined symbology, labelling, map composer text, etc. So, you could make a map composer template with a label that includes the @author, @project_version and @project_path variables:

Variables in a composer label

Sure, you *could* also manually enter all these details directly into the label for the same result. But what happens when you have multiple composers in your project, and need to update the version number in all of them? Or you move your project to a new folder and need to make sure the path is updated accordingly? Manually updating multiple composers is a pain – make QGIS do the work for you and instead use variables! This would especially be helpful if you’re saving map composer templates for use across multiple projects or users. Using variables will ensure that the template is automatically updated with the right details for the current project.

Another neat thing about QGIS variables is that they can be inherited and overridden, just like CSS rules. Opening the options dialog will also show a Variables group for setting “Global” variables. These variables are always available for your QGIS installation, regardless of what project you’re working on at the time. If your workplace tends to reorganise a lot and constantly shuffle your department around, you could add a global variable for @work_department, so that changing the global variable value in one place will automatically filter through to any existing and future projects you have.

Global variables
Global variables

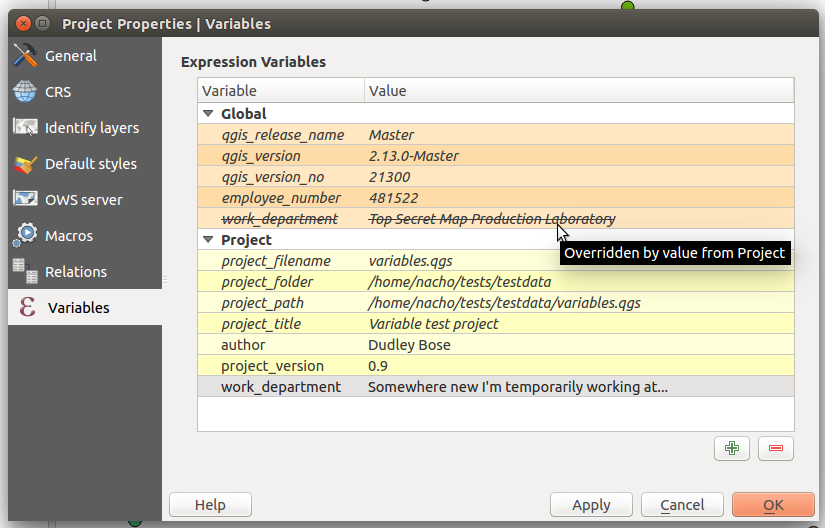
And like I mentioned earlier, these variables are inherited through various “contexts” within QGIS. If I reopen the Project Properties dialog, you’ll see that a project has access to all the global variables plus the variables set within that specific project. In addition, by adding a variable with the same name to the Project variables the value of the Global variable will be overridden:

Overridden variables

There’s also a variable editor within each individual composer’s properties tab, so variables can also be set and overridden on a composer-by-composer basis within a project. It’s a really flexible and powerful approach which both simplifies workflows and also opens up lots of new possibilities.

Stay tuned for more on this topic – this topic has only just scratched the surface of how expression variables have changed QGIS! (You can also read part 2 and part 3)

Customising the TimeManager time stamp

TimeManager is a fantastic plugin for QGIS which allows you to create animated maps from your data. You can read all about it here and here, and there’s a really nice demonstration of it here.

I’ve been playing with TimeManager a fair bit over the last month, and thought I’d share a quick tip on improving the appearance of TimeManager’s time stamp. TimeManager includes some basic functionality for placing a time stamp in the corner of your outputs, but it’s fairly limited. There’s only some basic appearance options, and no way to control the date or time formats displayed.

Default TimeManager time stamp

But, there’s a trick we can use to get around this: use a temporary point layer for the time stamp label. Let me elaborate:

  1. Create a throwaway point layer. It doesn’t matter what fields or format this layer has.
  2. Add a single point feature to this layer at the place you’d like the improved time stamp to appear at.

    Add a single point feature
    …add a single point feature
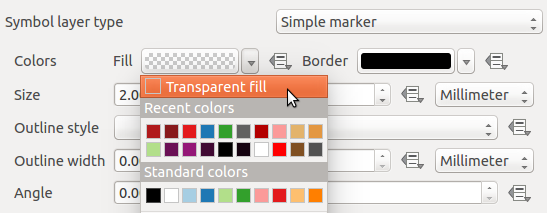
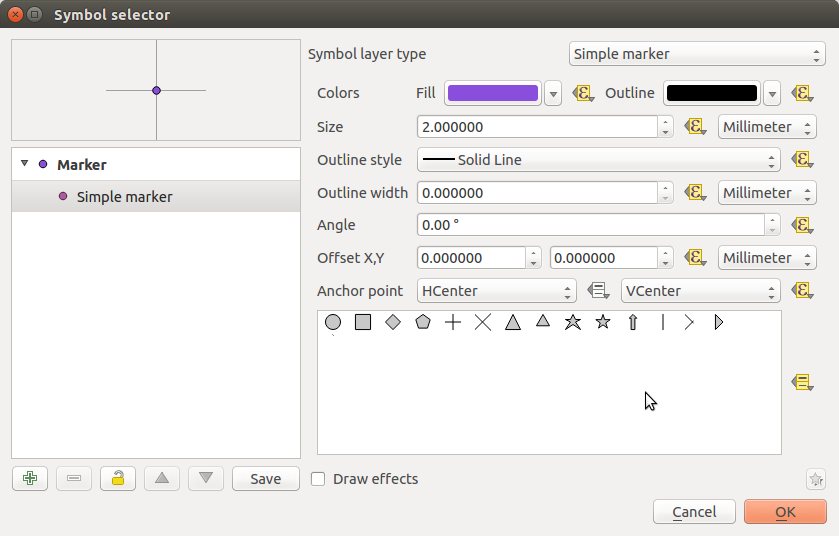
  3. We don’t want to see the marker, so hide the symbol for this layer by setting it to use a transparent fill and outline.

    Transparent fill and outline
    Transparent fill and outline
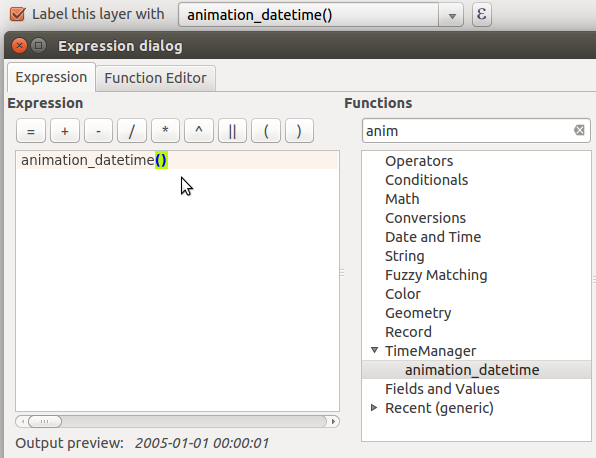
  4. Then, enable labels for this layer. Here’s the trick – set the label expression for the label to use “animation_datetime()” (or for QGIS 2.8, “$animation_datetime”). This is a custom function provided by the TimeManager plugin which evaluates to the current frame’s date and time.

    Setting the layer's label expression
    Setting the layer’s label expression
  5. Now, you can use all the built-in options within QGIS for styling this label. Buffers, drop shadows, background shapes… anything!

    ...tweaking the label appearance
    …tweaking the label appearance
  6. Apply and check. Much nicer!

    Formatted timestamp
    A nicely formatted time stamp
  7. To tweak the formatting of the time stamp’s date and time, you can modify the label expression using the built-in ‘format_date’, ‘year’, ‘month’, etc functions. Let’s try “format_date(animation_datetime(),’ddd dd MMM yyyy’)”:

    Tweaked expression
    Tweaked expression

Now, our final formatted time stamp looks like this:

Final, formatted time stamp

…and there we go. Using this simple trick allows you to take advantage of all the possibilities which the QGIS labelling and expression engines allow!

*Bonus points for the first person to use this technique along with data defined controls for animating the label colour/size!

Recent labelling improvements in QGIS master

If you’re not like me and don’t keep a constant eye over at QGIS development change log (be careful – it’s addictive!), then you’re probably not aware of a bunch of labelling improvements which recently landed in QGIS master version. I’ve been working recently on a large project which involves a lot (>300) of atlas map outputs, and due to the size of this project it’s not feasible to manually tweak placements of labels. So, I’ve been totally at the mercy of QGIS’ labelling engine for automatic label placements. Generally it’s quite good but there were a few things missing which would help this project. Fortunately, due to the open-source nature of QGIS, I’ve been able to dig in and enhance the label engine to handle these requirements (insert rhetoric about beauty of open source here!). Let’s take a look at them one-by-one:

Data defined quadrant in “Around Point” placement mode

First up, it’s now possible to specify a data defined quadrant when a point label is set to the Around Point placement mode. In the past, you had a choice of either Around Point mode, in which QGIS automatically places labels around point features in order to maximise the number of labels shown, or the Offset from Point mode, in which all labels are placed at a specified position relative to the points (eg top-left). In Offset from Point mode you could use data defined properties to force labels for a feature to be placed at a specific relative position by binding the quadrant to a field in your data. This allowed you to manually tweak the placement for individual labels, but at the cost of every other label being forced to the same relative position. Now, you’ve also got the option to data define the relative position when in Around Point mode, so that the rest of the labels will fall back to being automatically placed. Here’s a quick example – I’ll start with a layer with labels in Around Point mode:

Around Point placement mode

You can see that some labels are sitting to the top right of the points, others to the bottom right, and some in the top middle, in order to fit all the labels for these points. With this new option, I can setup a data defined quadrant for the labels, and then force the ‘Tottenham’ label (top left of the map) to display below and to the left of the point:

Setting a data-defined quadrant

Here’s what the result looks like:

Manually setting the quadrant for the Tottenham label

The majority of the labels are still auto-placed, but Tottenham is now force to the lower left corner.

Data defined label priority

Another often-requested feature which landed recently is the ability to set the priority for individual labels. QGIS has long had the ability to set the priority for an entire labelling layer, but you couldn’t control the priority of features within a layer. That would lead to situations like that shown below, where the most important central station (the green point) hasn’t been labelled:

What... no label for the largest station in Melbourne?
What… no label for the largest station in Melbourne?

By setting a data defined priority for labels, I can set the priority either via values manually entered in a field or by taking advantage of an existing “number of passengers” field present in my data. End result is that this central station is now prioritised over any others:

Much better! (in case you're wondering... I've manually forced some other non-optimal placement settings for illustrative purposes!)
Much better! (in case you’re wondering… I’ve manually forced some other non-optimal placement settings for illustrative purposes!)

Obstacle only layers

The third new labelling feature is the option for “Obstacle only” layers. What this option does is allow a non-labelled layer to act as an obstacle for the labels in other layers, so they will be discouraged from drawing labels over the features in the obstacle layer. Again, it’s best demonstrated with an example. Here’s my stations layer with labels placed automatically – you can see that some labels are placed right over the features in the rail lines layer:

Labels over rail lines...
Labels over rail lines…

Now, let’s set the rail lines layer to act as an obstacle for other labels:

... setting the layer as an obstacle...
… setting the layer as an obstacle…

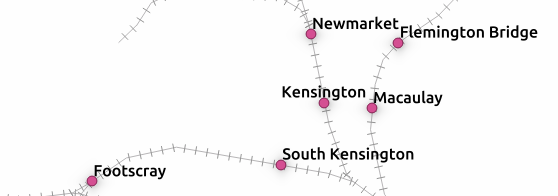
The result is that labels will be placed so that they don’t cover the rail lines anymore! (Unless there’s no other choice). Much nicer.

No more clashing labels!

Control over how polygons act as obstacles for labels

This change is something I’m really pleased about. It’s only applicable for certain situations, but when it works the improvements are dramatic.

Let’s start with my labelled stations map, this time with an administrative boundary layer in the background:

Stations with administrative boundaries

Notice anything wrong with this map? If you’re like me, you won’t be able to look past those labels which cross over the admin borders. Yuck. What’s happening here is that although my administrative regions layer is set to discourage labels being placed over features, there’s actually nowhere that labels can possibly be placed which will avoid this. The admin layer covers the entire map, so regardless of where the labels are placed they will always cover an administrative polygon feature. This is where the new option to control how polygon layers act as obstacles comes to the rescue:

...change a quick setting...
…change a quick setting…

Now, I can set the administrative layer to only avoid placing labels over feature’s boundaries! I don’t care that they’ll still be placed inside the features (since we have no choice!), but I don’t want them sitting on top of these boundaries. The result is a big improvement:

Much better!
Much better!

Now, QGIS has avoided placing labels over the boundaries between regions. Better auto-placement of labels like this means much less time required manually tweaking their positioning, and that’s always a good thing!

Draw only labels which fit inside a polygon

The last change is fairly self explanatory, so no nice screenshots here. QGIS now has the ability to prevent drawing labels which are too large to fit inside their corresponding polygon features. Again, in certain circumstances this can make a huge cartographic improvement to your map.

So there you go. Lots of new labelling goodies to look forward to when QGIS 2.12 rolls around.


Want to sponsor some QGIS features? Here’s some ideas…

I’ve been working on QGIS for a number of years now and, contrary to what I thought when I started, my wishlist seems to grow longer with every feature I add to QGIS! Unfortunately, almost all of my QGIS development work is done on a volunteer basis and it’s sometimes hard to justify the time required to tackle items on this list. So here’s your chance to help me fix this!

Here’s a quick list of things which I’d love to add to QGIS (or improve), but would need someone to step up and help sponsor their development:

  • Raster marker symbol type: Currently QGIS supports a number of marker symbol types (simple markers, font markers, SVG markers) but there’s no option to just use a raster image file for a symbol. A few versions back I added support for a raster image fill type, and now I’d love to do the same for markers. Options could include overriding the image size, rotation and opacity. And of course, all of these properties would be data-definable.
  • Paint effects for diagrams: The successful Kickstarter campaign meant that QGIS 2.10 includes a powerful framework for applying live effects to layers, including drop shadows, outer glows, blurs, and colour effects (plus lots of others!). I’d like to take this framework and allow effects to be applied to diagrams on a layer. Drop shadows and outer glows would really help aid the readability of diagrams by allowing them to sit on a different visual layer to the rest of the map. The effects framework was designed to allow reuse across all of QGIS, and diagrams would be the next logical step in this.

    Layer effects for diagrams! (Well... a mockup of them...)
    Layer effects for diagrams! (Well… a mockup of them…)
  • Additional diagram types/options: While we’re on the topic of diagrams, there’s lots more that we could do with QGIS’ diagram support. We’ve currently got support for pie charts, text diagrams and histograms, but there’s a lot of really nice diagram styles which we don’t yet support. Everybody loves infographics with nicely designed diagrams… so I’d love the chance to extend what’s possible using QGIS diagram engine. Some ideas include icon arrays, circle packing.
  • Adding a geometry widget in the attribute table: This feature has been on my mind a lot lately. What I’d like to add is a new “geometry widget” as the last column in a layer’s attribute table. This widget would allow you to do all sorts of modifications to the geometry attached to a feature. Possible options include clearing the geometry (resetting it to null), copying the geometry as WKT or GeoJSON, or pasting geometry into the feature from a WKT string (making it super easy to copy the geometry between features). This could also be extended in future to start incorporating the editing capabilities current possible through the Plain Geometry Editor plugin.

    Poor quality mockup of a geometry widget...
    Poor quality mockup of a geometry widget…
  • Options for non square/straight line legend patches: QGIS’ legend currently has no options for customising the shape of legend patches. Polygon layers in the legend are rectangles, line layers are straight lines — that’s it. There’s lots of room for improvement here. I’d like to add options for shapes such as circles, rounded rectangles, jagged lines, and possibly even custom shapes (via a WKT string or something similar).

    Custom legend shapes anyone?
    Custom legend shapes anyone?
  • Improving the heatmap plugin: The current heatmap plugin needs some love. The code and UI could do with a big refresh. I’d love a chance to totally revamp this plugin and move it into QGIS core code, and allow it to be used from within processing models. I’d also like to add additional hotspot techniques, such as Getis Ord Gi* hotspotting, to the plugin.
  • Extending the raster calculator: QGIS’ raster calculator was given a bunch of needed fixes and improvements in 2.10, but there’s more we could do. The major limitation with the calculator is that it currently only supports functions with at most two parameters. This needs to be fixed so that we can add a bunch of much desired functions to the calculator – eg min, max, avg, coalesce, if, etc… Lack of support for multi-parameter functions is really holding back what’s possible in the calculator.

Of course, this list is just a start. I’m always keen to chat about any other features you’d like to see added to QGIS (or even tackle specific pet-hate bugs or frustrations!). Just drop me an email at [email protected] to discuss.

Oh, one last thing – I’m in the process of preparing for my next crowd funded feature for QGIS – and this one is big! More on that shortly.


Point cluster renderer crowdfund launched!

We’ve just launched a new crowd funding campaign to implement a live point cluster renderer within QGIS. Full details are available on the campaign page.

clusterer

This is a really exciting new feature which would help make possible some neat styling effects which just aren’t possible in QGIS at the moment. To make it possible we need 2300€ pledged before 31 August. You can help make this a reality by supporting the campaign or by sharing the page and increasing exposure to the campaign. Updates to follow!

Exploring variables in QGIS pt 2: project management

Following on from part 1 in which I introduced how variables can be used in map composers, I’d like to now explore how using variables can make it easier to manage your QGIS projects. As a quick refresher, variables are a new feature in QGIS 2.12 which allow you to create preset values for use anywhere you can use an expression in QGIS.

Let’s imagine a typical map project. You load up QGIS, throw a bunch of layers on your map, and then get stuck into styling and labelling them ‘just right’. Over time the project gets more and more complex, with a stack of layers all styled using different rendering and labelling rules. You keep tweaking settings until you’re almost happy with the result, but eventually realise that you made the wrong choice of font for the labelling and now need to go through all your layers and labelling rules and update each in turn to the new typeface. Ouch.

Variables to the rescue! As you may recall from part 1, you can reuse variables anywhere in QGIS where you can enter an expression. This includes using them for data defined overrides in symbology and labelling. So, lets imagine that way back at the beginning of our project we created a project level variable called @main_label_font:

Creating a variable for label font

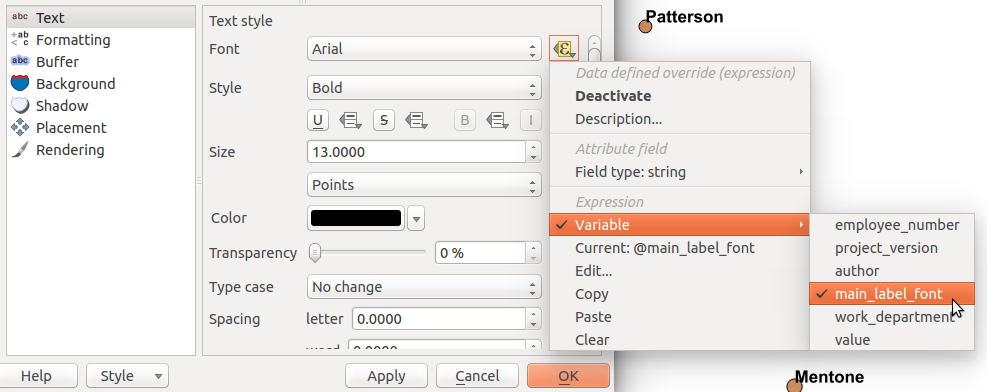
Now, we can re-use that variable in a data defined override for the label font setting. In fact, QGIS makes this even easier for you by showing a “variables” sub-menu allowing easy access to all the currently defined variables accessible to the layer:

Binding the label font to the @main_label_font variable


When we hit Apply all our labels will be updated to use the font face defined by the @main_label_font variable, so in this case ‘Courier New’:

courier_new

In a similar way we can bind all the other layer’s label fonts to the same variable, so @main_label_font will be reused by all the layers in the project. Then, when we later realise that Courier New was a horrible choice for labelling the map, it’s just a matter of opening up the Project Properties dialog and updating the value of the @main_label_font variable:

delicious

And now when we hit Apply the font for all our labelled layers will be updated all at once:

new_labels

It’s not only a huge time saver, it also makes changes like this easier because you can try out different font faces by updating the variable and hitting apply and seeing the effect that the changes have all at once. Updating multiple layers manually tends to have the consequence that you forget what the map looked like before you started making the change, making direct comparisons harder.

Of course, you could have multiple variables for other fonts used by your project too, eg @secondary_label_font and @highlighted_feature_font. Plus, this approach isn’t limited to just setting the label font. You could utilise project level variables for consolidating font sizes, symbol line thickness, marker rotation, in fact, ANYTHING that has one of those handy little data defined override buttons next to it:

See all those nice little yellow buttons? All those controls can be bound to variables...
See all those nice little yellow buttons? All those controls can be bound to variables…

One last thing before I wrap up part 2 of this series. The same underlying changes which introduced variables to QGIS also allows us to begin introducing a whole stack of new, useful functions to the expression engine. One of these which also helps with project management is the new project_color function. Just like how we can use project level variables throughout a project, project_color lets you reuse a color throughout your project. First, you need to create a named colour in the Default Styles group under the Project Properties dialog:

Define a colour in the project's colour scheme...
Define a colour in the project’s colour scheme…

Then, you can set a data defined override for a symbol or label colour to the expression “project_color(‘red alert!’)“:

bind_color

When you go back and change the corresponding colour in the Project Properties dialog, every symbol bound to this colour will also be updated!

blue_alert

So, there you have it. With a little bit of forward planning and by taking advantage of the power of expression variables in QGIS 2.12 you can help make your mapping projects much easier to manage and update!

That’s all for now, but we’re still only just getting started with variables. Part 3, coming soon!.. (Update: Part 3 is available now)


Introducing QGIS live layer effects!

I’m pleased to announce that the crowdfunded work on layer effects for QGIS is now complete and available in the current development snapshots! Let’s dive in and explore how these effects work, and check out some of the results possible using them.

I’ll start with a simple polygon layer, with some nice plain styling:

Nice and boring polygon layer
A nice and boring polygon layer

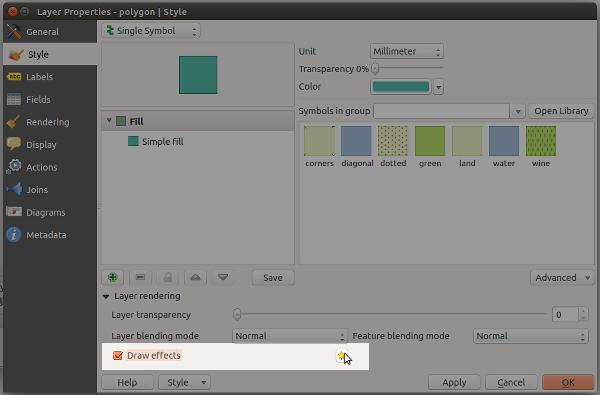
If I open the properties for this layer and switch to the Style tab, there’s a new checkbox for “Draw effects“. Let’s enable that, and then click the little customise effects button to its right:

Enabling effects for the layer

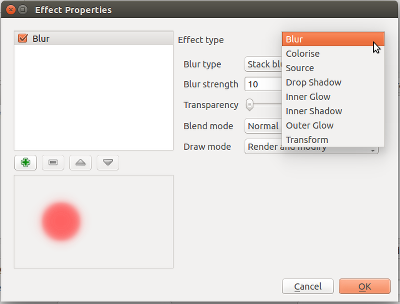
A new “Effects Properties” dialog opens:

Effects Properties dialog

You can see that currently the only effect listed is a “Source” effect. Source effects aren’t particularly exciting – all they do is draw the original layer unchanged. I’m going to change this to a “Blur” effect by clicking the “Effect type” combo box and selecting “Blur“:

Changing to a blur effect

If I apply the settings now, you’ll see that the polygon layer is now blurry. Now we’re getting somewhere!

Blurry polygons!
Blurry polygons!

Ok, so back to the Effects Properties dialog. Let’s try something a bit more advanced. Instead of just a single effect, it’s possible to chain multiple effects together to create different results. Let’s make a traditional drop shadow by adding a “Drop shadow” effect under the “Source” effect:

Setting up a drop shadow

Effects are drawn top-down, so the drop shadow will appear below the source polygons:

Live drop shadows!
Live drop shadows!

Of course, if you really wanted, you could rearrange the effects so that the drop shadow effect is drawn above the source!..

Hmmmm
Hmmmm…

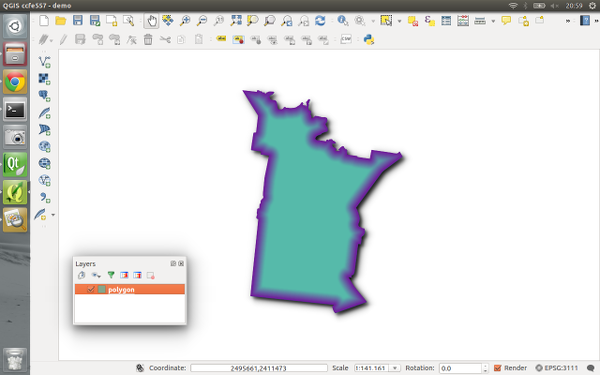
You can stack as many effects as you like. Here’s a purple inner glow over a source effect, with a drop shadow below everything:

Inner glow, source, drop shadow...
Inner glow, source, drop shadow…

Now it’s time to get a bit more creative… Let’s explore the “transform” effect. This effect allows you to apply all kinds of transformations to your layer, including scaling, shearing, rotation and translation:

The transform effect

Here’s what the layer looks like if I add a horizontally shearing transform effect above an outer glow effect:

Getting freaky...
Getting tricky…

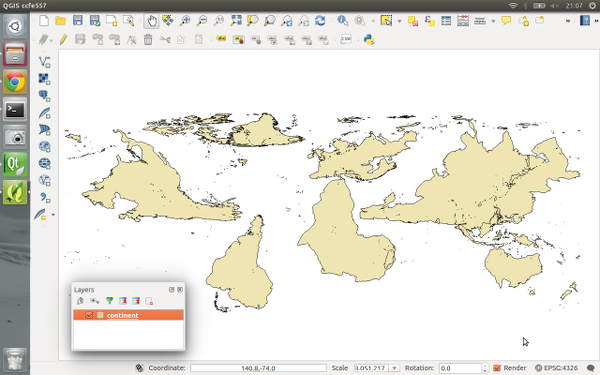
Transforms can get really freaky. Here’s what happens if we apply a 180° rotation to a continents layer (with a subtle nod to xkcd):

Change your perspective on the world!

Remember that all these effects are applied when the layers are rendered, so no modifications are made to the underlying data.

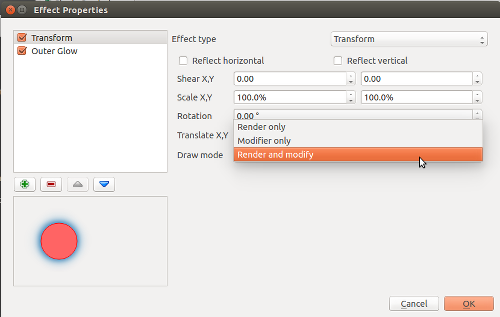
Now, there’s one last concept regarding effects which really blasts open what’s possible with them, and that’s “Draw modes“. You’ll notice that this combo box contains a number of choices, including “Render“, “Modify” and “Render and Modify“:

"Draw mode" options
“Draw mode” options

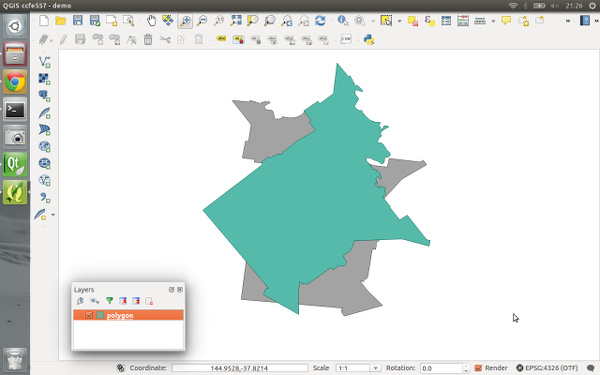
These draw modes control how effects are chained together. It’s easiest to demonstrate how draw modes work with an example, so this time I’ll start with a Transform effect over a Colorise effect. The transform effect is set to a 45° rotation, and the colorise effect set to convert to grayscale. To begin, I’ll set the transform effect to a draw mode of Render only:

The "Render only" draw mode
The “Render only” draw mode

In this mode, the results of the effect will be drawn but won’t be used to modify the underlying effects:

Rotation effect over the grayscale effect

So what we have here is that the polygon is drawn rotated by 45° by the transform effect, and then underneath that there’s a grayscale copy of the original polygon drawn by the colorise effect. The results of the transform effect have been rendered, but they haven’t affected the underlying colorise effect.

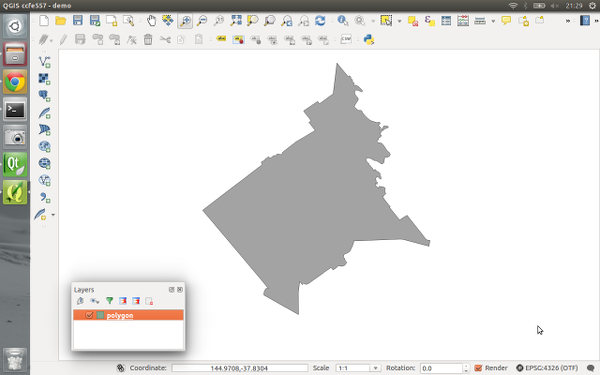
If I instead set the Transform effect’s draw mode to “Modifier only” the results are quite different:

Rotation modifier for grayscale effect

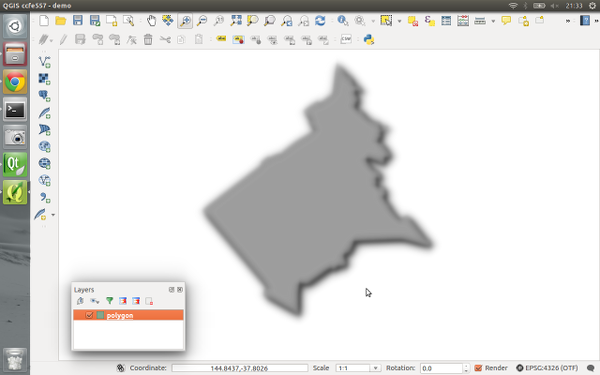
Now, the transform effect is rotating the polygon by 45° but the result is not rendered. Instead, it is passed on to the subsequent colorise effect, so that now the colorise effect draws a grayscale copy of the rotated polygon. Make sense? We could potentially chain a whole stack of modifier effects together to get some great results. Here’s a transform, blur, colorise, and drop shadow effect all chained together using modifier only draw modes:

A stack of modifier effects

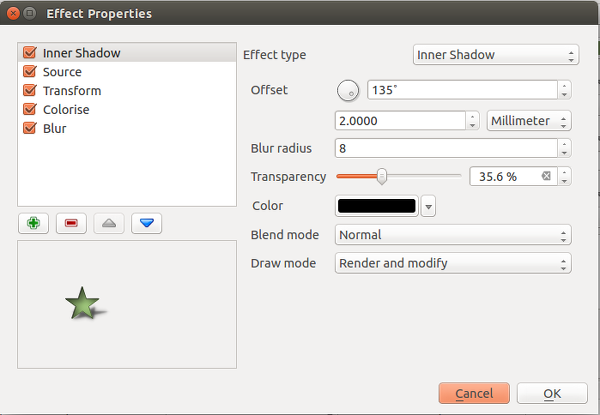
The final draw mode, “Render and modify” both renders the effect and applies its result to underlying effects. It’s a combination of the two other modes. Using draw modes to customise the way effects chain is really powerful. Here’s a combination of effects which turn an otherwise flat star marker into something quite different:

Lots of effects!
Lots of effects!

The last thing I’d like to point out is that effects can be either applied to an entire layer, or to the individual symbol layers for features within a layer. Basically, the possibilities are almost endless! Python plugins can also extend this further by implementing additional effects.

All this work was funded through the 71 generous contributors who donated to the crowdfunding campaign. A big thank you goes out to you all whole made this work possible! I honestly believe that this feature takes QGIS’ cartographic possibilities to whole new levels, and I’m really excited to see the maps which come from it.

Lastly, there’s two other crowdfunding campaigns which are currently in progress. Lutra consulting is crowdfunding for a built in auto trace feature, and Radim’s campaign to extend the functionality of the QGIS GRASS plugin. Please check these out and contribute if you’re interested in their work and would like to see these changes land in QGIS.

Exploring variables in QGIS pt 3: layer level variables

In part 3 of my exploration of variables in QGIS 2.12, I’m going to dig into how variables are scoped in QGIS and what layer level variables are available (you can read parts 1 and 2 for a general introduction to variables).

Some background

Before we get to the good stuff, a bit of background in how variables work behind-the-scenes is important. Whenever an expression is evaluated in QGIS the context of the expression is considered. The context is built up from a set of scopes, which are all stacked on top of each other in order from least-specific to most-specific. It’s easier to explain with an example. Let’s take an expression used to set the source of a picture in a map composer. When this expression is evaluated, the context will consist of:

  1. The global scope, consisting of variables set in the QGIS options dialog, and other installation-wide properties
  2. The project scope, which includes variables set in the Project Properties dialog and the auto-generated project variables like @project_path, @project_title (you can read more about this in part 2)
  3. composer scope, with any variables set for the current composer, plus variables for @layout_pagewidth, @layout_pageheight, @layout_numpages, etc.
  4. composer item scope for the picture, with item-specific variables including @item_id

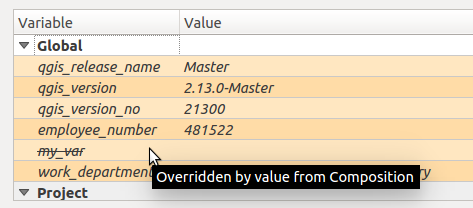
The more specific scopes will override any existing clashing variables from less specific scopes. So a global @my_var variable will be overridden by an @my_var variable set for the composer:

overridden

Another example. Let’s consider now an expression set for a data-defined label size. When this expression is evaluated the context will depend on where the map is being rendered. If it’s in the main map canvas then the context will be:

  1. The global scope
  2. The project scope
  3. map settings scope, with variables relating to how the map is being rendered. Eg @map_rotation, @map_scale, etc
  4. layer scope. More on this later, but the layer scope includes layer-level variables plus preset variables for @layer_name and @layer_id

If instead the map is being rendered inside a map item in a map composer, the context will be:

  1. The global scope
  2. The project scope
  3. The composer scope
  4. An atlas scope, if atlas is enabled. This contains variables like @atlas_pagename, @atlas_feature, @atlas_totalfeatures.
  5. composer item scope for the map item
  6. map settings scope (with scale and rotation determined by the map item’s settings)
  7. The layer scope

Using layer level variables

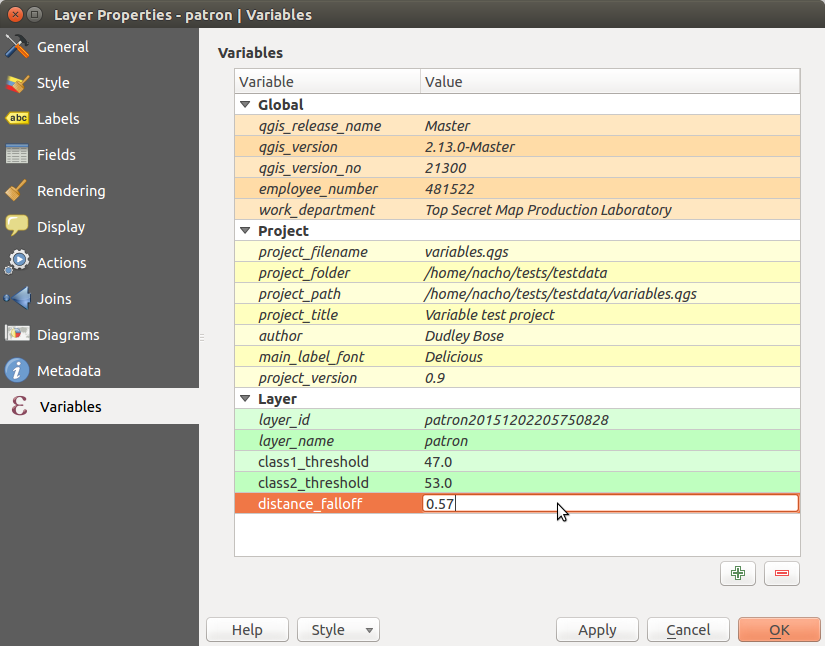
Ok, enough with the details. The reason I’ve explained all this is to help explain when layer level variables come into play. Basically, they’ll be available whenever an expression is evaluated inside of a particular layer. This includes data defined symbology and labeling, field calculator, and diagrams. You can’t use a layer-level variable inside a composer label, because there’s no layer scope used when evaluating this. Make sense? Great! To set a layer level variable, you use the Variables section in the Layer Properties dialog:

Setting a layer variablee
Setting a layer variable

Any layer level variables you set will be saved inside your current project, i.e. layer variables are per-layer and per-project. You can also see in the above screenshot that as well as the layer level variables QGIS also lists the existing variables from the Project and Global scopes. This helps show exactly what variables are accessible by the layer and whether they’ve been overridden by any scopes. You can also see that there’s two automatic variables, @layer_id and @layer_name, which contain the unique layer ID and user-set layer name too.

Potential use cases for layer-level variables

In the screenshot above I’ve set two variables, @class1_threshold and @class2_threshold. I’m going to use these to sync up some manual class breaks between rule based symbology and rule based labeling. Here’s how I’ve set up the rule-based symbols for the layer:

Rule based symbology using layer level variables

In a similar way, I’ve also created matching rule-based labeling (another new feature in QGIS 2.12):

Matching rule-based labels

Here’s what my map looks like now, with label and symbol colors matched:

*Map for illustrative purposes only... not for cartographic/visual design excellence!
*Map for illustrative purposes only… not for cartographic/visual design excellence!

If I’d hard-coded the manual class breaks, it would be a pain to keep the labeling and symbology in sync. I’d have to make sure that the breaks are updated everywhere I’ve used them in both the symbology and labeling settings. Aside from being boring, tedious work, this would also prevent immediate before/after comparisons. Using variables instead means that I can update the break value in a single place (the variables panel) and have all my labeling and symbols immediately reflect this change when I hit apply!

Another recent use case I had was teaming layer-level variables along with Time Manager. I wanted my points to falloff in both transparency and size with age, and this involved data defined symbol settings scattered all throughout my layer symbology. By storing the decay fall-off rate in a variable, I could again tweak this falloff by changing the value in a single place and immediately see the result. It also helps with readability of the data defined expressions. Instead of trying to decipher a random, hard-coded value, it’s instead immediately obvious that this value relates to a decay fall-off rate. Much nicer!

I’m sure there’s going to be hundreds of novel uses of layer-level variables which I never planned for when adding this feature. I’d love to hear about them though – leave a comment if you’d like to share your ideas!

One last thing – the new “layer_property” function

This isn’t strictly related to variables, but another new feature which was introduced in QGIS 2.12 was a new “layer_property” expression function. This function allows you to retrieve any one of a bunch of properties relating to a specific map layer, including the layer CRS, metadata, source path, etc.

This function can be used anywhere in QGIS. For instance, it allows you to insert dynamic metadata about layers into a print composer layout. In the screenshot below I’ve used expressions like layer_property(‘patron’,’crs’) and layer_property(‘patron’,’source’) to insert the CRS and source path of the “patron” layer into the label. If either the CRS or the file path ever changes, this label will be automatically updated to reflect the new values.

Inserting dynamic layer properties into a composer label


So there you go – layer level variables and the layer_property function – here in QGIS 2.12 and making your workflow in QGIS easier. In the final part of this series, we’ll explore the magical @value variable. Trust me, I’ve saved the best for last!

QGIS 3 is underway – what does it mean for your plugins and scripts?

With the imminent release of QGIS 2.16, the development attention has now shifted to the next scheduled release – QGIS 3.0! If you haven’t been following the discussion surrounding this I’m going to try and summarise what exactly 3.0 means and how it will impact any scripts or plugins you’ve developed for QGIS.

qgis_icon.svgQGIS 3.0 is the first major QGIS release since 2.0 was released way back in September 2013. Since that release so much has changed in QGIS… a quick glance over the release notes for 2.14 shows that even for this single point release there’s been hundreds of changes. Despite this, for all 2.x releases the PyQGIS API has remained stable, and a plugin or script which was developed for use in QGIS 2.0 will still work in QGIS 2.16.

Version 3.0 will introduce the first PyQGIS API break since 2013. An API break like this is required to move QGIS to newer libraries such as Qt 5 and Python 3, and allows the development team the flexibility to tackle long-standing issues and limitations which cannot be fixed using the 2.x API. Unfortunately, the side effect of this API break is that the scripts and plugins which you use in QGIS 2.x will no longer work when QGIS 3.0 is released!

Numerous API breaking changes have already started to flow into QGIS, and 2.16 isn’t even yet publicly available. The best way to track these changes is to keep an eye on the “API changes” documentation.  This document describes all the changes which are flowing in which affect PyQGIS code, and describe how best they should be addressed by plugin and script maintainers. Some changes are quite trivial and easy to update code for, others are more extreme (such as changes surrounding moving to PyQt5 and Python 3) and may require significant time to adapt for.

I’d encourage all plugin and script developers to keep watching the API break documentation, and subscribe to the developers list for additional information about required changes as they are introduced.

If you’re looking for assistance or to outsource adaptation of your plugins and scripts to QGIS 3.0 – the team at North Road are ideally placed to assist! Our team includes some of the most experienced QGIS developers who are directly involved with the development of QGIS 3.0, so you can be confident knowing that your code is in good hands. Just contact us to discuss your QGIS development requirements.

You can read more about QGIS 3.0 API changes in The road to QGIS 3.0 – part 1.

How to effectively get things changed in QGIS

I’ve been heavily involved in the open source QGIS mapping project for a number of years now. During this time I’ve kept a close watch on the various mailing lists, issue trackers, stackexchange, tweets and other various means users have to provide feedback to the project. Recently, I’ve started to come to the conclusion that there’s a lot of fundamental confusion about how the project works and how users can get changes made to the project. Read on for these insights, but keep in mind that these are just my thoughts and not reflective of the whole community’s views!..

Firstly – QGIS is a community driven project. Unlike some open source projects (and unlike the proprietary GIS offerings) there is no corporate backer or singular organisation directing the project. This means two things:

  1. The bad news: No-one will do your work for you. QGIS has been created through a mix of user-led contributions (ie, users who have a need to change something and dive in and do it themselves) and through commercially supported contributions (either organisations who offer commercial QGIS support pushing fixes because their customers are directly affected or because they’ve been contracted by someone to implement a particular change). There HAS been a number of volunteer contributions from developers who are just donating their time (for various reasons), but these contributions are very much the minority.
  2. The good news: YOU have the power to shape the project! (And whenever I say “you” – I’m referring directly to the person reading this, or the company you work for. Just pretend it’s in 24 point bold red blinking text.) Because QGIS is community driven (and not subject to the whims of any one particular enterprise) every user has the ability to implement changes and fixes in the program.

So how exactly can users get changes implemented in QGIS? Well, let’s take a look at all the possible different ways that changes get made and how effective each one is:

  1. YOU can make the changes yourself. This implies that you have the c++/Python skills required to make the changes, are able to find your way around the source code, and push through the initial hurdles of setting up a build environment and navigating git. This can be a significant time investment, but the ultimate result is that you can make whatever changes you want, and so long as your pull request is accepted you’ll get your changes directly into QGIS. You’ll find the QGIS team is very open to new contributors and will readily lend a hand if you need assistance navigating the source or for advise on the best way to make these changes. Just ask!
  2. YOU (or your employer) can pay (or “sponsor”) someone to make the changes on your behalf. Reinvesting some of those savings you’re making through using an open source program back into the program itself is a great idea, and everyone benefits. There’s numerous organisations who specialise in QGIS development (eg… my own consultancy, North Road). You can liaise with these organisations to get them to make the changes on your behalf. This is probably the most effective way of getting changes implemented. These organisations all have a history with QGIS development and this experience generally translates to much faster development then if you code it yourself. It’s also somewhat of a shortcut – if you hire a core QGIS developer to make your changes, then you can be confident that they are familiar with the coding style, policies, and long-term goals of the project and accordingly can get the changes accepted rapidly. The obvious down side of paying for changes is that, well, it costs money. Understandably, not everyone has the resources available to do this.
  3. Following on from option 2 – if you can’t directly sponsor changes yourself, you could help indirectly raise funds to pay for the changes. This is a great way to get changes implemented, because everyone has the power to do this. You could seek out similar organisations/users who have the same need and pool your resources, get involved with the local QGIS user group and raise funds together, organise a crowd-funding campaign, etc.
  4. Ask a developer to make the changes for you. This is not terribly effective – you’re basically asking someone to work for free, and take time away from their family/job/hobbies/social life to do work for you. That said, it does sometimes happen, and here’s a few reasons I can think of why:
    • You’ve build up enough “karma” within the project through other contributions. If someone has been heavily involved in the non-development side of the project (eg translations, documentation, helping users out on mailing lists/stackexchange, organising hackfests or user groups, etc) then developers are much more likely to want to help them out in turn.
    • You’ve got a fantastic idea which has just never occurred to anyone before. By bringing it to the attention of a developer you might trigger the “wow, I could really benefit from that too!” impulse which is hard-wired into some of us!
    • It’s a particularly interesting or challenging problem, and sometimes developers just like to extend themselves.
  5. (For bugs only) File a bug report, and hope it gets picked up in one of the pre-release bug fixing sprints. This is basically the same as option 2 – expect that in this case someone else (the QGIS steering committee) is paying for the development time. There’s no way of guaranteeing that your bug will get fixed during this time though, so it’s not a particularly reliable approach if the fix is critical for you.

Finally, there’s two more very ineffective approaches:

  1. File a bug report/feature request, and wait. This isn’t very effective, because what you’re doing is basically the same as 1-4 above, but just waiting for someone else to either do the work or sponsor the changes. This might happen in a week, or might take 10 years.
  2. Complain about something and hope for the best. This is… not very effective. No-one is particularly motivated to help out someone who is being a jerk.

That’s it. Those are the ONLY ways changes get made in QGIS. There’s no other magical short-cuts you can take. Some of these approaches are much more effective than others, and some require skills or resources which may not be available. If you want to see something change in QGIS, you need to take a look at these options and decide for yourself which best meets your needs. But please, just don’t choose option 7!

Update: a follow up to this article was published

QGIS Grants: Call for applications

We are pleased to announce the first round of funding for the QGIS grant programme.

What is the grant programme?

The QGIS.ORG grant programme is our way to accelerate and streamline development of the QGIS.ORG project by rewarding committed developers and contributors for their work through a grant system. It is a way to distribute our funds amongst our team members in a fair and transparent way.

Why have a grant programme?

There are four main reasons for embarking on a grant programme.

  1. The first intent of the grant programme is to amplify the contributions of grantees by allowing them to spend more time on QGIS over and above what they would be able to do on a purely volunteer basis. At the broader level we would also like to avert the potentially negative reaction to funded development work in QGIS: “Why should I donate my time to work on QGIS when others are paid to do it?” And rather create an aspirational environment: “If I make a large contribution to QGIS I could also be eligible for a grant like other dedicated contributors have received.”
  2. To simplify the decision making process for how to spend the funds received in the QGIS project via our Sponsorship and Donations programmes. The grant programme would allow us to streamline our decision making when it comes to funding developers. We receive many proposals for funding various activities in QGIS which invariably lead to protracted debate. In addition, not having a cohesive plan for how to disburse QGIS funds results in funding being done in a very ad hoc manner – which in turn results in a skew of funding towards development related activities and away from other critical project activities such as improvement of user documentation, API documentation, sysadmin tasks and so on.
  3. To get things done that volunteers don’t naturally gravitate towards doing, such as housekeeping, maintenance and so on.
  4. To transparently spend QGIS.ORG funds to advance the QGIS project.

In this funding round, we are ring-fencing EUR 20,000 for the grant programme. We expect to run further grant calls in the future if this round proves to be a success and as funds allow.

Applicants may submit more than one proposal and the proposal may be on any topic that you think is relevant and beneficial to the greater QGIS community. Some examples of the kinds of topics you could propose are:

  • Updating and improving documentation
  • Updating and improving QGIS.org web infrastructure
  • Implementing a new feature in QGIS
  • Curating the pull request queue
  • Bug fixing
  • Improving API documentation
  • Improving the API and help making QGIS 3.0 a reality
  • Rewriting and improving a part of the code base
  • A security review of QGIS
  • Helping new QGIS devs to get started with improved developer documentation and utilities
  • etc.

The closing date for applications is Thursday, 15 September 2016

PLEASE NOTE: All applications made here will be PUBLICLY VISIBLE, including your name.

FAQ:

Here are a list of frequently asked questions relating to the grant call. Please check back on this article regularly – we will update it as any new questions are raised so that everyone may benefit from the answers.

1) Q: Are collaborative proposals allowed?

A: One person should be the proposal lead though. Additional collaborators can be mentioned in the proposal details section.

2) Q: Can I make a proposal for a smaller amount?

A: Yes

3) Q: Can I make a proposal for a larger amount?

A: No

4) Q: Can I charge VAT / additional expenses on top of the grant allocation?

A: No, the amount should be all-inclusive.

5) Q: How will the grant awards be decided?

A: Grant applications will be decided on by vote of the QGIS Board Voting Members

6) Q: Can the grant be made on behalf of my company or a group of people?

A: Yes. Just note that any application you make should be inclusive of all costs, VAT, Taxes etc.

7) Q: How many grants will be awarded from the 20,000 Euros?

A: We expect to award at minimum two grants, possibly more if there are a number of smaller grant proposals that are worthwhile.

8) Q: Can I make more than one application?

A: Yes

9) Q: Is this like Google Summer of Code – a mentorship programme?

A: No. We will not provide mentorship – we expect that you are already an established developer or contributors to the QGIS project and do not need any ‘hand holding’ other than via normal community consultation processes like QEP’s.

10) Q: I am thinking of submitting a proposal to do XYZ. Would that be considered a valid proposition?

A: We don’t have any specific pre-conceived ideas of what a valid proposal is, so I would encourage you to make a submission if you think it is worthwhile. During the decision about which proposals to access, we will consider factors like:

  • how broadly useful the proposal is to all our users,
  • how unlikely is it that the feature or improvement would be done without Grant funding,
  • how much ‘value’ does the work bring to the project,
  • how feasible is it that the applicant will actually achieve their goals etc.

11) Q: Have you thought of how to handle situations where person A submits a proposal and, later, person B submits the same proposal but cheaper?

A: In these cases, we will use criteria such as the applicant’s standing in the community, the technical details of their implementation plan, etc. Price would probably be a low-weighted factor but certainly could enter into it if there is a significant difference.

12) Q: I’ve read that QGIS 3 might land in first quarter of 2017 (if everything goes well). Do you expect proposals to be tied to QGIS 3? Should bug fixes, plugins, PyQGIS book translations, should they be planned, developed, and tested against QGIS 3’s code base?

A: Where proposals relate to the code base, yes we would expect that they are ‘3.0 ready’ – though they do not necessarily have to be completed when 3.0 is released.

13) Q: Do you have an indication of how long it will take for the grants to be awarded after the closing date?

A: It’s a bit hard for me to say how long it is going to take. The process will entail asking the QGIS voting community to rank all the proposals. Depending on how many proposals we receive we will need to allow for sufficient time of this to happen. We hope we can do it within a month of the closing date for applications but it we get a hundred proposals we will need more time probably….
Q: I still have questions, who can I ask?

A: Please contact [email protected] if you have further questions, or write to the pic mailing list.


How to apply:

To apply please use this online form


OSM turn restriction QA with QGIS

Wrong navigation instructions can be annoying and sometimes even dangerous, but they happen. No dataset is free of errors. That’s why it’s important to assess the quality of datasets. One specific use case I previously presented at FOSS4G 2013 is the quality assessment of turn restrictions in OSM, which influence vehicle routing results.

The main idea is to compare OSM to another data source. For this example, I used turn restriction data from the City of Toronto. Of the more than 70,000 features in this dataset, I extracted a sample of about 500 turn restrictions around Ryerson University, which I had the pleasure of visiting in 2014.

As you can see from the following screenshot, OSM and the city’s dataset agree on 420 of 504 restrictions (83%), while 36 cases (7%) are in clear disagreement. The remaining cases require further visual inspection.

toronto_turns_overview

The following two examples show one case where the turn restriction is modelled in both datasets (on the left) and one case where OSM does not agree with the city data (on the right).
In the first case, the turn restriction (short green arrow) tells us that cars are not allowed to turn right at this location. An OSM-based router (here I used OpenRouteService.org) therefore finds a route (blue dashed arrow) which avoids the forbidden turn. In the second case, the router does not avoid the forbidden turn. We have to conclude that one of the two datasets is wrong.

turn restriction in both datasets missing restriction in OSM?

If you want to learn more about the methodology, please check Graser, A., Straub, M., & Dragaschnig, M. (2014). Towards an open source analysis toolbox for street network comparison: indicators, tools and results of a comparison of OSM and the official Austrian reference graph. Transactions in GIS, 18(4), 510-526. doi:10.1111/tgis.12061.

Interestingly, the disagreement in the second example has been fixed by a recent edit (only 14 hours ago). We can see this in the OSM way history, which reveals that the line direction has been switched, but this change hasn’t made it into the routing databases yet:

now before

This leads to the funny situation that the oneway is correctly displayed on the map but seemingly ignored by the routers:

toronto_okeefe_osrm

To evaluate the results of the automatic analysis, I wrote a QGIS script, which allows me to step through the results and visually compare turn restrictions and routing results. It provides a function called next() which updates a project variable called myvar. This project variable controls which features (i.e. turn restriction and associated route) are rendered. Finally, the script zooms to the route feature:

def next():
    f = features.next()
    id = f['TURN_ID']
    print "Going to %s" % (id)
    QgsExpressionContextUtils.setProjectVariable('myvar',id)
    iface.mapCanvas().zoomToFeatureExtent(f.geometry().boundingBox())
    if iface.mapCanvas().scale() < 500:
        iface.mapCanvas().zoomScale(500)

layer = iface.activeLayer()
features = layer.getFeatures()
next()

You can see it in action here:

I’d love to see this as an interactive web map where users can have a look at all results, compare with other routing services – or ideally the real world – and finally fix OSM where necessary.

This work has been in the making for a while. I’d like to thank the team of OpenRouteService.org who’s routing service I used (and who recently added support for North America) as well as my colleagues at Ryerson University in Toronto, who pointed me towards Toronto’s open data.


QGIS 2.16 ‘Nødebo’ is released!

We’re happy to announce the release of QGIS 2.16.0 ‘Nødebo’. The University of Copenhagen’s Department of Geoscience and Natural Resource Management Forest and Landscape College in Nødebo were hosts to the First International QGIS conference and developer meeting in May 2015. For all of us who are not fluent in Danish, Lene Fischer has prepared the following video teaching us how to pronounce the release name:

QGIS 2.16 is not designated as a Long Term Release (LTR). Users wishing to have a version of QGIS which does not change and receives bug fixes for at least 1 year are invited to use the current LTR release 2.14.
If you are upgrading from QGIS 2.14 you will find a great many new features in this release.
Whenever new features are added to software they introduce the possibility of new bugs – if you encounter any problems with this release, please file a ticket on the QGIS Bug Tracker.

We would like to thank the developers, documenters, testers and all the many folks out there who volunteer their time and effort (or fund people to do so). From the QGIS community we hope you enjoy this release! If you wish to donate time, money or otherwise get involved in making QGIS more awesome, please wander along to qgis.org and lend a hand!

QGIS is supported by donors and sponsors. A current list of donors who have made financial contributions large and small to the project can be seen on our donors list. If you would like to become and official project sponsor, please visit our sponsorship page for details. Sponsoring QGIS helps us to fund our six monthly developer meetings, maintain project infrastructure and fund bug fixing efforts.

QGIS is Free software and you are under no obligation to pay anything to use it – in fact we want to encourage people far and wide to use it regardless of what your financial or social status is – we believe empowering people with spatial decision making tools will result in a better society for all of humanity. If you are able to support QGIS, you can donate here.


One “add” button to rule them all

Reducing the number of “Add layer” buttons in the QGIS GUI is a commonly voiced wish. Multiple approaches have been discussed but no decision has been made so far. One idea is to use the existing browser functionality to replace the “Add layer” dialogs. Others are envisioning completely novel approaches.

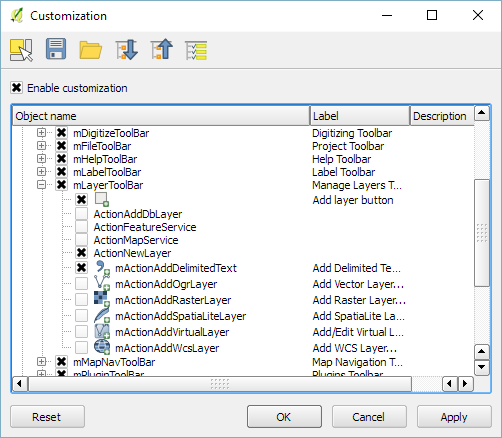
Since the topic came up again today on Twitter, I decided to implement a quick & dirty version of a unified Add layer button. This way, I can comfortably reduce my Layer toolbar to three buttons using Settings | Customization …

layerToolBar

customization

I pretty much just kept the “Create new layer” button and the “Add delimited text layer” button because, as far as I know, there is no way to call the dialog from the browser. (Instead, CSVs are opened with OGR, which doesn’t have nearly as many nice features.)

And here it is in action:

(I recommend to undock the Browser panel to get the dialog-like behavior that you see in the video.)

To install the plugin: download it and unzip it into your QGIS plugin folder, then activate it in the plugin manager.

I would love to hear what you think about this UX experiment.


QGIS workshops at FOSSGIS

We are looking forward to a hot geo summer here in Central Europe with both the German FOSSGIS (this year in conjunction with the annual AGIT conference) and the international FOSS4G just a few weeks away. It’s going to be exciting, and I still have a lot of talks (and a keynote) to prep for both events ;-)

If you speak German and want to enhance your geo skills, the FOSSGIS program offers some great opportunities and there is still the chance to sign up for a couple of great FOSSGIS workshops:

Of course the program also features many non-QGIS workshops. If I’d have to pick one of them, it would most certainly be Marc Jansen’s and Andreas Hocevar’s OpenLayers 3 workshop because it’s always great to get the latest information first hand, directly from the developers.

Online registration closes on June 25th.


  • <<
  • Page 58 of 141 ( 2820 posts )
  • >>

Back to Top

Sustaining Members