Related Plugins and Tags

QGIS Planet

Traveltime routing & catchment extension for the QGIS IDF router

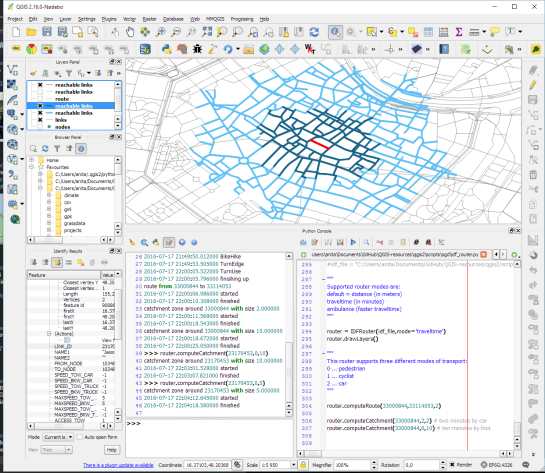
As announced in Salzburg a few days ago, I’m happy to present the lastest enhancement to my IDF router for QGIS: travel time routing and catchment computation.

Travel times for pedestrians and cyclists are computed using constant average speeds, while car travel times depend on the speed values provided by the road network data.

Catchment computations return the links that can be traversed completely within the given time (or distance limit). The current implementation does not deal with links at the edge of the catchment area, which can only be traversed partially.

Loading the whole network (2.7GB unzipped IDF) currently requires around 10GB of memory. One of the next plans therefore is to add a way to only load features within a specified bounding box.

Plans to turn this into a full-blown plugin will most likely have to wait for QGIS 3, which will ship with Python 3 and other updated libraries.

Screenshot 2016-07-17 22.04.54


Slides & workshop material from #QGISConf2016

If you could not make it to Girona for this year’s QGIS user conference, here’s your chance to catch up with the many exciting presentations and workshops that made up the conference program on May 25-26th:

(Some resources are still missing but they’ll hopefully be added in the coming days.)

Update: Now you can also watch the talks online or even download them.

Thanks to everyone who was involved in making this second QGIS user conference a great experience for all participants!


QGIS workshops at FOSSGIS

We are looking forward to a hot geo summer here in Central Europe with both the German FOSSGIS (this year in conjunction with the annual AGIT conference) and the international FOSS4G just a few weeks away. It’s going to be exciting, and I still have a lot of talks (and a keynote) to prep for both events ;-)

If you speak German and want to enhance your geo skills, the FOSSGIS program offers some great opportunities and there is still the chance to sign up for a couple of great FOSSGIS workshops:

Of course the program also features many non-QGIS workshops. If I’d have to pick one of them, it would most certainly be Marc Jansen’s and Andreas Hocevar’s OpenLayers 3 workshop because it’s always great to get the latest information first hand, directly from the developers.

Online registration closes on June 25th.


Videos and slides from FOSSGIS & AGIT OSGeo Day

Last week I had the pleasure to attend the combined FOSSGIS, AGIT and GI_Forum conferences in Salzburg. It was a great joint event bringing together GIS user and developers from industry and academia, working with both open source and commercial GIS.

I was particularly impressed by the great FOSSGIS video team. Their tireless work makes it possible to re-watch all FOSSGIS talks (in German).

I also had the pleasure to give a few presentations. Most of all, it was an honor to give the AGIT opening keynote, which I dedicated to Open Source, Open Data & Open Science.

In addition, I also gave one talk related to an ongoing research project on pedestrian routing. It was really interesting to see that other people – in particular from the OSM community – also talked about this problem during FOSSGIS:

(For more details, please see the full paper (OA).)

To wrap up this great week, Astrid Emde, Andreas Hocevar, and myself took the chance to celebrate the 10th anniversary of OSGeo during AGIT2016 OSGeo Day.

And last but not least, I presented an update from the QGIS project with news about the 3.0 plans and a list of (highly subjective) top new features:


Crayfish 2.3: New features

Crayfish 2.3 is out with FLO-2D format support and automatic export of contours

Support for new formats

We added support for FLO-2D result files.

FLO-2D format in Crayfish

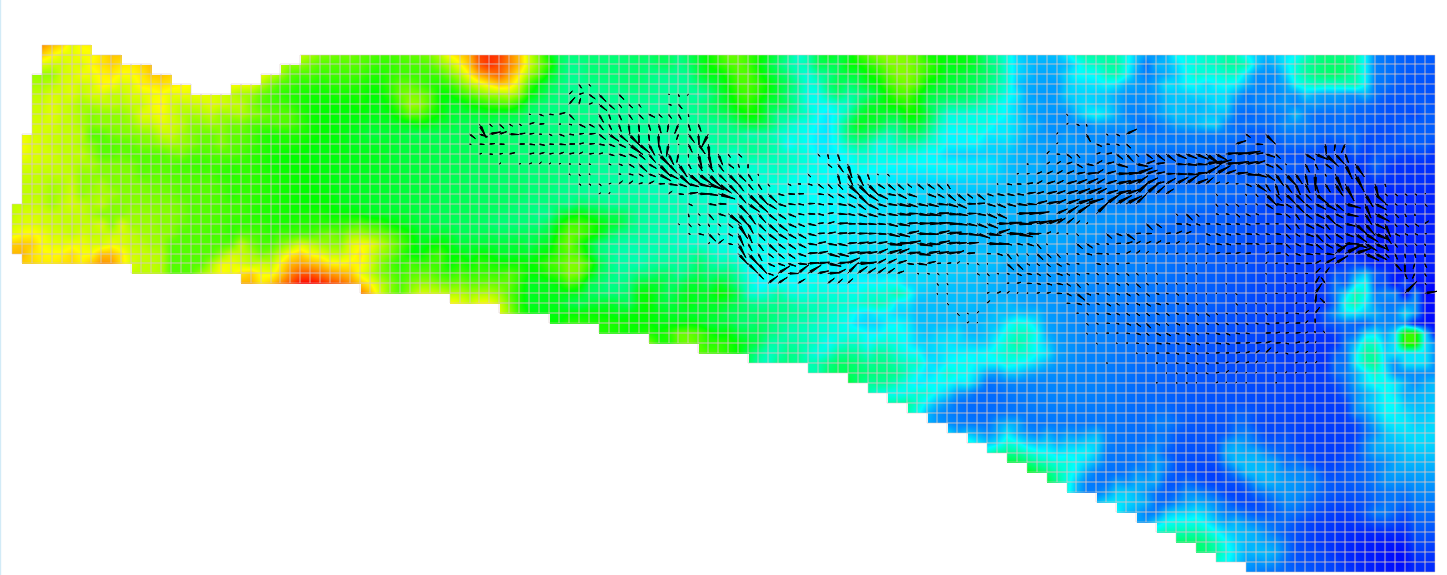
Weather Research and Forecasting Model (WRF) outputs are now fully supported in Crayfish.

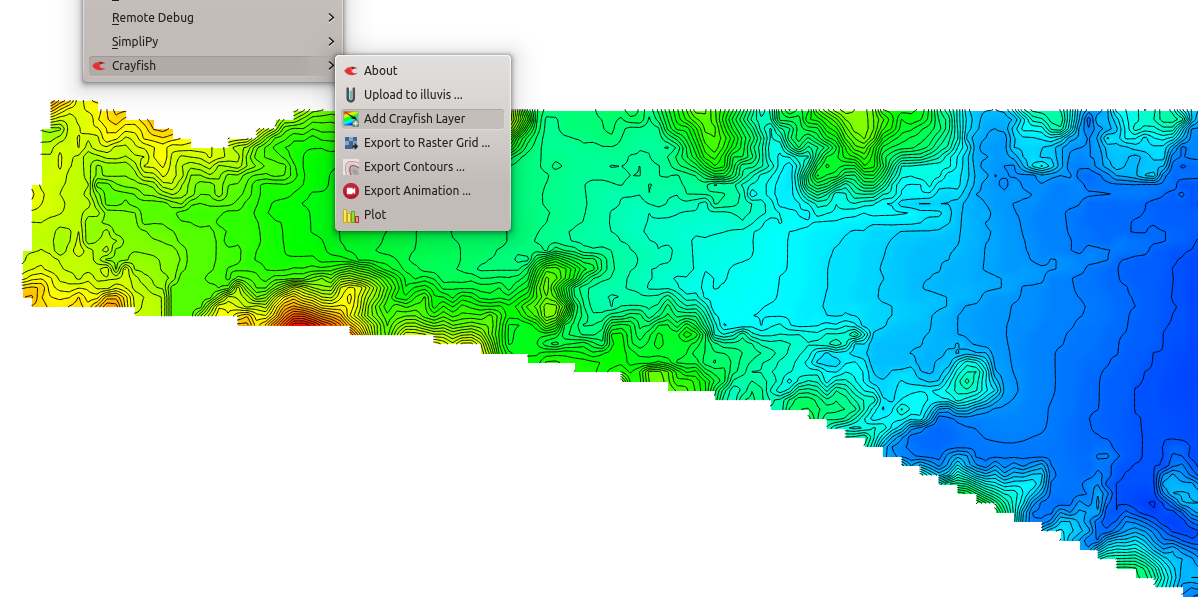
Export contours

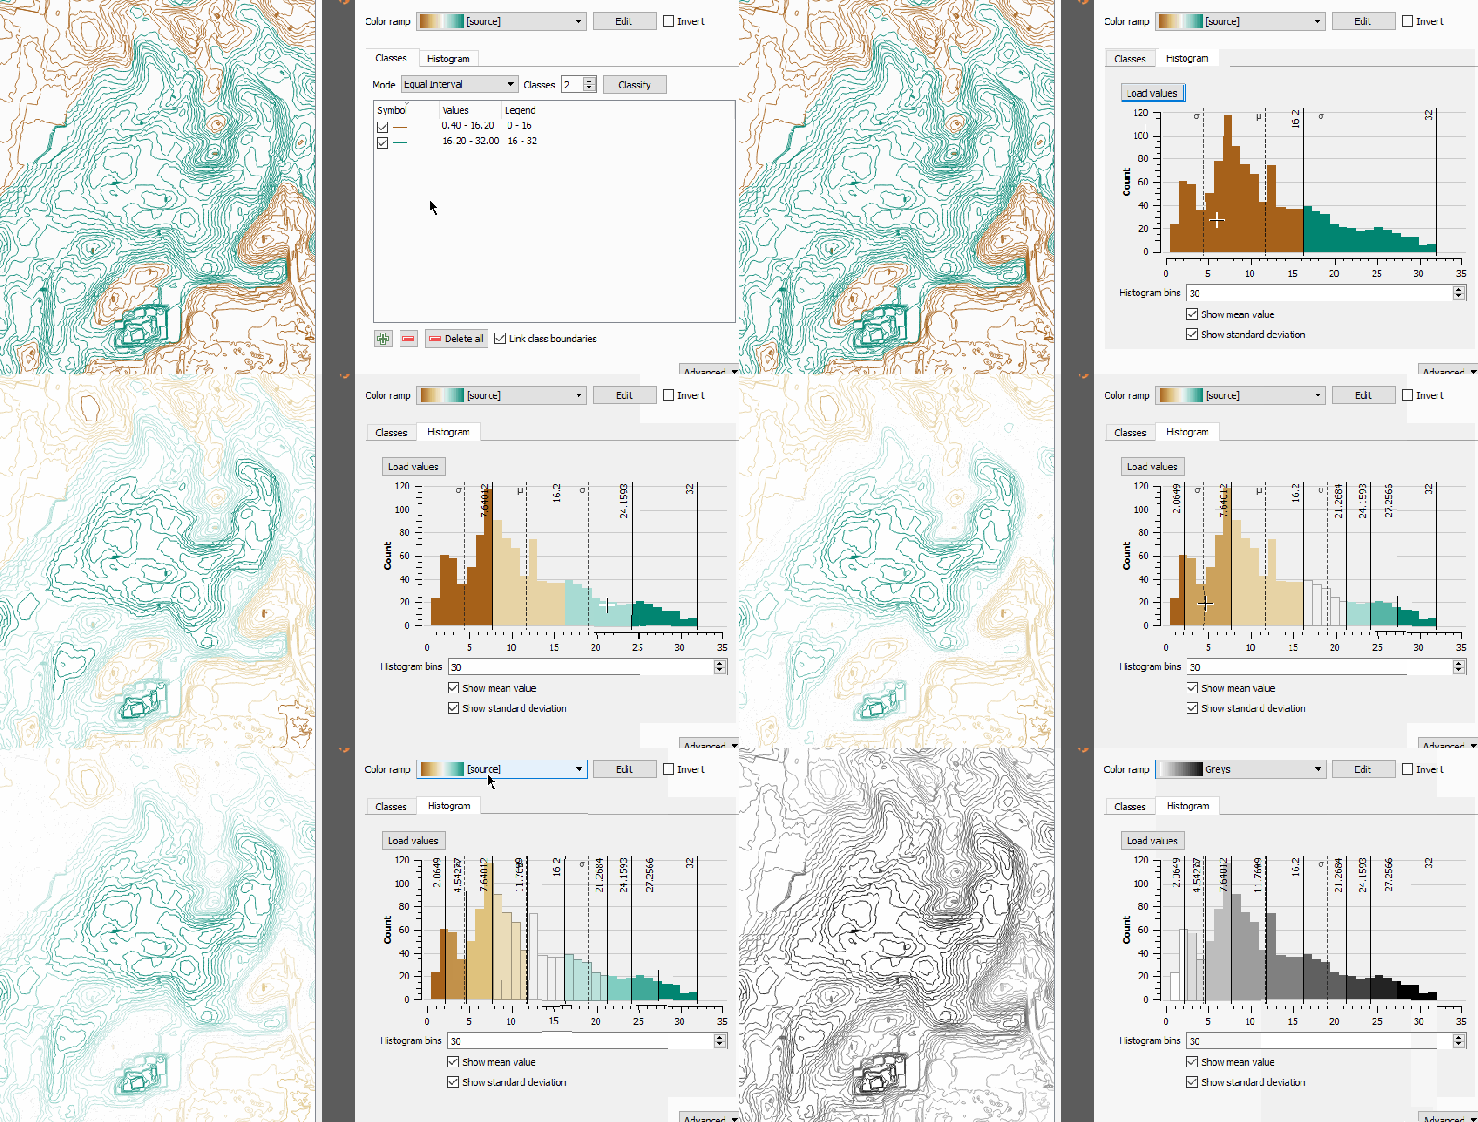
Users can now directly generate vector contours from a Crayfish layer. The export-to-contour feature allows you to select type of contour (e.g. line or area contour) and contour intervals. A very handy option is that the current colour ramp can be also used for your contour intervals.

Exporting contours in Crayfish

Processing toolbox Crayfish provider

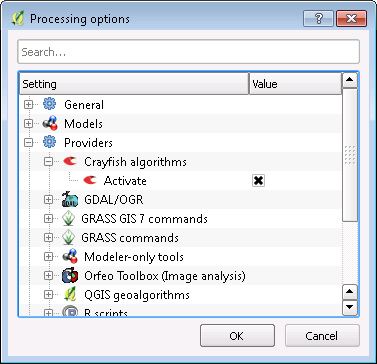
We have incorporated many algorithms from Crayfish to processing toolbox (Export grid, Export mesh elements, …). To activate the Crayfish module, from the main menu, select Processing > Options and in the new window, under Providers > Crayfish algorithms select the option for Activate.

Exporting contours in Crayfish

With the processing toolbox, user can create batch geo-processing algorithms to automate their work. For example, you can create a batch process using this module, to export several Crayfish grids to rasters.

Export to animation using the Processing Toolbox is not supported yet.

Future developments

We’d like to add support for mesh generation and also mesh calculator. If these are something of you or your organisation interest and would like to contribute financially, feel free to get in touch.

For any problems or feedback, please consider to file a ticket here.

You may also like...

Mergin Maps, a field data collection app based on QGIS. Mergin Maps makes field work easy with its simple interface and cloud-based sync. Available on Android, iOS and Windows. Screenshots of the Mergin Maps mobile app for Field Data Collection
Get it on Google Play Get it on Apple store

Report back: 15th QGIS hackfest in Girona, Spain

Time flies when you are having fun! It seems like only yesterday that I was writing about the 14th Hackfest in Gran Canaria. At the end of May 2016, we held the 15th QGIS hackfest! QGIS has been on an incredible journey since the project was started by Gary Sherman 14 years ago, and the fact that the hackfest was held in tandem with the 2nd QGIS International User conference is a testament to the growth and strength of the project.

2nd International QGIS Conference

Isn’t it amazing – we just held the second international QGIS User’s Conference! We really need to give credit to the amazing team who ran a totally seamless operation to organise the event: Gemma Pons, Toni Hernández, Josep Sitjar, Alexandre Busquets, Ferran Orduña, Rosa Olivella, Laura Olivas, & Lluís Vicens

Girona Organising Team

We would like to give a special thank you to the University of Girona’s Director of GIS Service (SIGTE) – Gemma Boix who helped to organised the event as well as ensuring the institutional support for the event. In case I have missed mentioning someone by name, our thanks to all the other volunteers and the sponsors of the conference. Not only did the conference team host the conference event, they also covered a large part of the costs of the hackfest that followed the conference – for which we can’t thank them enough! OSGeo also supported the hack fest financially for which we are extremely grateful.

The conference team also extends their thanks to the attendees and presenters, instructors and developers who also actively participated on the event!  For those interested in viewing the various talks at the conference, here are some handy links:


State of QGIS

The QGIS.org project is in a very healthy state right now. For my talk at the user conference (video here) I got some fresh download stats from our servers and the numbers are quite astounding: QGIS 2.8 LTR (release Feb 2015) has been downloaded over 679, 000 times for the Windows Standalone installer (which includes all bug fix releases). Even after controlling for overestimates (from bot downloads, multiple downloads per user, “try and don’t use”) and underestimates (single downloads being distributed to many users) it is clear that we have an extremely large and constantly growing user base. By another metric, our most popular plugin, the OpenLayers plugin has been downloaded over 700 000 times!

Something else that is clear from the make up of the talks, workshop topics and attendees at the user conference and hackfest: QGIS is increasingly moving from single user environments to large multi-user deployments. This ‘edge of network effect’ is a common phenomenon in FOSS and is largely how Linux came to be such a lynchpin in the dev-ops world. Sys admins and (in the case of QGIS) GIS power users, test out the software on their own devices, see the potential for it in their workplace and start integrating it into their workflows in the office until eventually it has become a mission critical piece of software for an organisation.

One thing my slides probably do not make clear is that there is a huge amount of investment being made into QGIS and plugins for QGIS to fulfil a wide variety of needs. These investments are largely external to the project (i.e. not factored into the financial figures I mentioned in the talk) and happen in direct client-to-developer relationships completely bypassing (from a financial sense) the upstream  QGIS.ORG project. This is a really good model since we do not need to deal with contract delivery, competing interests etc.

If we do a simple calculation based on direct QGIS.org revenue for 2015/2016 (around EUR 69, 000) to downloads, the average revenue per download of QGIS 2.8.x was around EUR 0.10. All of the money we receive into the project goes into improving the QGIS, maintaining infrastructure and funding travel and accommodation for hackfests. I mention these numbers both because they are interesting and because it is good to emphasise how incredibly grateful we are to each and every one of our sponsors and donors that support the project. We really do run on a shoe-string budget and we have audacious goals and a vision to put spatial decision making tools into the hands of everyone on the planet who wants to use them. Your sponsorship and donations are a key enabler to making this vision a reality!

By the way, my apologies for not mentioning Gary Sherman (our project founder) by name at the start of my talk – that was totally unintentional! Before I talk about the main activities, let me make a quick aside to mention the small excursion we took:

Underwater autonomous vehicles & QGIS

Natalia

One of the really cool things we did at the hackfest was take a little side trip to visit the Computer Vision and Robotics Institute. Natália Hurtós (who works for the institute) kindly gave a bunch of us QGIS geeks a tour. The work they are doing building [relatively] cheap underwater autonomous vehicles is really awesome and inspiring – all the more so because Natalia is planning to build the mission planning tool using QGIS libraries!

Ok so what actually happened at the hackfest? Lets dig in and find out!

Cool stuff from the QGIS Hackfest

I am only going to focus on the hackfest here because the videos from the talks at the QGIS User Conference have been posted online (see above), so you can take in all the QGIS goodness you like from those. There was a lot going on at the hackfest, so these are only the nuggets I managed to cherry-pick from the talks.

Give processing some love
Screen Shot 2016-06-12 at 22.13.15

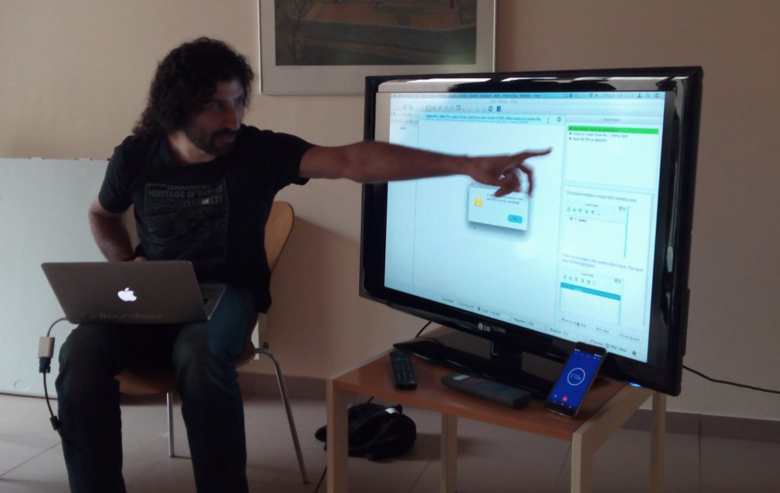
During the hackfest and user conference, Victor Olaya (lead developer for the QGIS processing framework) really did a great job of promoting the idea of writing processing plugins rather than ‘normal’ plugins. His argument is that most plugins that are intended to provide single purpose analytical capabilities (we are looking at you geeks about to write the 300th buffer plugin!) would  be better off implemented as processing plugins:

  • the plugin author would not need to spend valuable time writing user interfaces, input validators and so on.
  • users of the plugins could chain the tool into complex workflows easily, rather than only being able to use it on a once off basis.
  • we would grow the amount of options available in the processing toolbox while at the same time reducing the sometimes overwhelming amount of choice in the QGIS Plugin Manager.

ILWIS processing tools coming soon

Also on the topic of plugins, Bas Restsios from the ILWIS Project gave a demo of the ILWIS software in order for QGIS developers to be more aware of its capabilities. Although currently Windows only, the ILWIS developers are in the process of porting the software to be based on the Qt5 framework, which means us Linux and OSX users will get to enjoy using it too soon. ILWIS is Open Source and does its rendering using OpenGL. Because of their smart rendering system, everything draws lightning fast. ILWIS packs in many remote sensing tools and raster analysis tools and should be on anyone’s radar if they are interested in FOSSGIS. The best part (from my point of view) is that Bas and his team members are also busy creating a set of processing plugins for QGIS that call out to ILWIS’s command line tools. This means you can expect a huge leap forward in the number of raster based analysis functions you can do with QGIS in the near future.

GeoPackage, JPEG2000, WFS improvements

It was really great to have Even Rouault (maintainer of GDAL/OGR) present at the hackfest. Even recently received core committer rights to the QGIS code repository and has been making great contributions by adding support for the OGC Geopackage format (death to shapefiles!). The shapefile format is long in the tooth and doesn’t serve the GIS community well as a de facto standard for GIS data interchange. It also doesn’t make a good format for intermediate  representation of data processing outputs (e.g. when using multi algorithm processing models). Even has also been working on improvements to WFS support in QGIS which many will appreciate.

Not directly related to QGIS, but Even also mentioned he has been giving the GDAL driver for JPEG2000 some love – gaining good performance increases. This gives me some hope that there will be a viable open format alternative to ECW and MrSid in the future – something which QGIS will benefit from greatly. One of the interesting things that GDAL supports with the JPEG2000 specification is embedded vectors – you can write the raster with gdal_translate and then during creation pass a shapefile or GML stream to the gdal_translate command. I look forward to the day (not currently on the roadmap) where we can ship JP2 images with embedded vector masks and use those embedded vectors  seamlessly in QGIS.

Planning for 3.0 release

We did some planning for the 3.0 release of QGIS and, in particular, fine tuned the plans for how we will manage the transition from QGIS 2.x to 3.x. In February 2016 I posted an outline of the general approach we planned to follow. Some developers felt that we would be better off having the core of the 3.0 transition work happening on the master branch of QGIS so that it has more attention and testing focussed on it. I guess there are two main interest groups to consider here, so I will break down the outcome between take-home points for developers and general users:

For developers:

  • 2.16 gets released off master.
  • After 2.16 we create a 2x branch and the 2x branch will be put into caretaker mode.
  • Support for Qt4 and Py2 will be discontinued in master and we do packaging only against Qt5 and Py3.
  • Once Qt5 and Py3 only are supported in master, nightly build packages may not be immediately available on master as we need to get the packaging systems update.
  • After 2.16 is released API breaking changes will be allowed in master (but code must build and packaging not broken, plugins will be broken).
  • All API breaking changes should be annotated by means of a Doxygen page patch to indicate what changes were made.
  • We target the API change window to end in Feb 2017 so that we can have a 3.0 release in March 2017.
  • We may do a 2.18 release off the 2x branch  if there have been substantial changes in the 2x branch. If there are no substantial changes in the 2x branch following 2.16, we will not do a 2.18 release.
  • In January 2017 we will have a review to establish if all the API breaking changes are complete. If someone has specific implementation plans that are in progress and they need more time, we will (under agreement from the dev community) extend the API breaking window and may push out the release date.
  • Following the release of 3.0 we will implement API freeze again and polish up the codebase for an LTR release based on 3.2
  • 2.14 LTR support will be extended until 3.2 is ready
  • Note: for QGIS 3.x, a minimum of Qt 5.5 is recommended
  • Note: for QGIS 3.x a minimum of Python 3.4 is recommended
  • Note: We are looking for a volunteer to set up a  windows build system using vagrant on win 7 so that we can test and build automaticallyl

For General Users

We propose that for general users, you rather share the following more easy to digest bullet list as it does not contain all the technical details above that mainly developers will care about.

  • 2.18 release is not guaranteed
  • We are planning a 3.0 release in March 2017
  • This release date may be postponed – we will do a review in January to establish whether we are on track for the release date
  • The 3.0 release will break your plugins – we will publish a migration guide and tools to help you migrate your plugin to the new platform
  • If you have any queries about the process please feel free to contact us (via the developer or user mailing lists preferably)

Style repository

Akbar Gumbira, our Google Summer of Code (GSOC) student joined us at the hackfest. For his GSOC project, Akbar is working on a unified way to share styles, symbols, ramps and markers in QGIS. The idea will be very similar to the QGIS plugin repository, where users can host their favourite cartographic elements for everyone else to enjoy. There was quite a lot of technical discussion about the exact mechanisms to use for hosting shared symbology with the key elements of the debate being about whether to use git as a hosting system, simple zip files or some other mechanism. If you wish to chat to Akbar about his work, visit this chat room or comment on the QEP.

OSX Packaging and Building

QGIS is an attractive proposition for OSX users since the big commercial vendors typically don’t support OSX. Since QGIS is built on cross platform technologies, this does not pose a huge limitation for us, but there are few OSX developers in the QGIS developer team and the platform requirements and constraints are pretty complex. Larry Shaffer has been doing awesome work to cut through the various issues and simplify the installation process – both for end users and for developers. It’s finally pretty easy to get a development environment up and running on a Mac now. Using brew (a package manager for OSX) you can install all the needed dependencies and get  QGIS compiling in Qt Creator with full debugging support. The next challenge is going to be supporting this under Qt5 for QGIS 3.0 and Larry has been doing a bunch of great work to make that happen.

Lizmap!

There are several web client frontends for QGIS out there. Lizmap is probably the most feature rich of them. Michaël Douchin (@kimaidou on twitter) showed off the latest version of Lizmap. If you are doing any web mapping, you really should check it out!

QField

Marco Bernasocchi showed off the work they have been doing on QField – an Android app for your mobile device. The workflow for using QField is simple: Create a QGIS project on your desktop, copy it over to your device’s SD Card or internal storage, then open the same project on your device. Since it uses the same QGIS 2.14 backend as you are probably running on your desktop, all the cartographic elements from your desktop are supported – including the new 2.5D rendering. The main use case for QField is field data collection and new in QField is the ability to capture point data and edit / update feature attributes. This opens many possibilities for asset management and field survey work.

Marco shared some roadmap plans for QField including broader support for form elements. Value maps are already implemented, value relations, date and picture support are coming soon!. There is also beta support for digitising lines which should land in your installed version soon. I am eagerly looking forward to seeing how QField develops!

During the hackfest I did some testing of QFied using a PostGIS layer in a project with the data coming from a remote QGIS server – and it works (assuming you have internet connectivity). I also did some testing using BTSync to create a synchronised file system between my mobile device and my desktop. Edits to layers on the desktop and the mobile device can easily be pushed back and forth, making it very very easy to push out maps and new data to workers in the field.

Testing

There were lots of interesting things going on for those interested in testing. Alessandro Pasotti showed off some really cool stuff he has been working on for running python tests directly in QGIS instead of using a mock QGIS iface object. There are huge benefits to doing this since your tests run in  a ‘real’ QGIS environment. He also showed off how they are testing QGIS plugins in Docker using the above mentioned technique.

If you do need / want to use an mock iface object, Matthias Kuhn has been promoting the use of the new qgis.testing python module improvements which includes an iface object which is comprehensive in terms of API stubs. For pythonistas:

from qgis.testing import start_app, unittest 

Matthias has also created a unittest subclass that you can use which includes nice goodies like letting you do asserts that geometries match.

Matthias Kuhn, Nyall Dawson and others have really been leading the charge to build a more comprehensive test suite in QGIS and there were lots of other interesting tips and tricks been shown like how to make your travis tests run against multiple versions of QGIS – which can be very handy for plugin authors.

Victor Olaya also showed off the tester plugin – for automated GUI testing based on recorded interaction sequences.

Nice things for developers

Martin Dobias showed off some of the tools they have been developing including:

  • The report plugin (see http://plugins.qgis.org/plugins/report/) that lets you trap python exceptions and send a bug report directly to a github issue tracker.
  • Martin also showed of the First Aid plugin which lets you capture tracebacks in a more elegant way and also debug your plugin, stepping through the code and execute python instructions in the current run context. The First AID plugin makes a great alternative to using remote debugging from an IDE which is time consuming to set up and technical for less experienced developers to do.

Training plugin

Victor Olaya showed of a plugin (the Lessons plugin) they are working on to facilitate interactive training in QGIS. It uses a simple dock interface to guide the user through a series of activities. Interestingly you can ask it to play recorded macros (saved as python code) of the active being explained so that you can see how it is done if you can’t figure it out yourself. Their authoring system also allows you to record these  macros.


Docker

Docker is increasingly becoming a useful building block for those wishing to deploy QGIS in server side contexts. Patrick Valsecchi and Stéphane Brunner did some really awesome work refactoring the QGIS Server docker image – you can get a preview here  https://github.com/pvalsecc/QGIS/tree/docker (read the README for usage notes). Patrick’s work strips down the size of the docker image to make it much less of an overhead to pull the image. We would like to eventually merge this into the upstream QGIS repo so that we have a versioned docker build set up for each QGIS release.


Crayfish

Martin Dobias showed off the Crayfish plugin. Crayfish includes some really awesome multi temporal visualisation tools – really useful if you have time slice data in NetCDF or similar formats and you want to view layers sequentially as animations. It also has cool symbology additions to show flow / directionality arrows over your raster.


GeoNode QGIS Server Demo

Etienne Trimaille demonstrated the work he, Ismail Sunni and Rizky Maulana have been doing to implement a QGIS Server backend for GeoNode. GeoNode is a spatial content management system that allows you to easily upload and share geospatial data on the web. With their implementation you can upload a shape file or TIFF along with a QGIS .qml style file and the layer is published directly as a tile service in the original QGIS styling. Bye-bye hard do create SLD’s, hello easy to create QGIS styles. (Disclaimer: I work with Etienne, Ismail and Rizky so I am tooting our own horn a bit here).

Documentation

The work of the documentation team is often overlooked in the frenzy to enjoy the new cool stuff that developers churn out. Take a look over at the documentation GitHub pulse page to see how just as much effort is going on in the documentation work. During the hackfest Yves Jacolin and the rest of the documentation team were hard at work getting things ready for the next QGIS Manual release. If you are able to lend a hand with the documentation effort (no coding skills required), please do contact Otto Dassau, the QGIS Documentation Lead!

Lightning talks

Here is also a quick-fire list of features that were shown off -that are coming down the QGIS conveyor belt – mostly for QGIS 2.16 but also new plugins and other efforts:

  • Style dock in QGIS 2.16 with undo / redo – Nathan Woodrow
  • Dynamic hillside rendering – Nathan Woodrow
  • Awesome new gradient editor – Nyall Dawson
  • D3 & Plotly charting with chart interaction showing on the layer – Matteo Ghetta and Michael Douchin
  • Forms improvements: the ‘drag and drop’ editor will support multiple columns – Matthias Kuhn
  • Table view will be able to filter which columns to show (to let you hide unwanted columns) – Matthias Kuhn
  • Action widget columns in the attribute table: you can place one or more action widgets (and icons) into the attribute table making it very easy to fire off an action (e.g. python script) for a particular record – Matthias Kuhn
  • Support for changing column order display in attribute table – Matthias Kuhn
  • In composer you can get have JSON of all layer relations that you can use in your html widget – Nyall Dawson
  • Aggregation in expressions. We will explain this more in the visual changeling for the next release, but you will be able to compute attribute aggregates (e.g. sum of areas) in your reports – Nyall Dawson
  • Default values for fields – Matthias Kuhn showed upcoming work to add support for field defaults in when adding a new record to a vector layer.
  • Transaction groups / cascaded editing mode when you are editing a feature so that related tables get put into edit mode (project property needs to be enabled) – again we will explain this more in the upcoming 2.16 changelog – Matthias Kuhn
  • SectorPlot plugin: a plugin to let you make ‘pizza plots’ of your data – Raymond Nijssen and Richard Duivenvoorde
  • Denis Rouzaud showed off work he has been doing to create a standard settings dialog that you can use in your plugins. It has support for different input types and layer chooser etc. They provide a settings dialog base class that you can derive from in your plugin which will take care of reading and writing your settings to Settings.
  • User profiles plugin – lets you create customised user interface for different user categories – Alex Bruy
  • Georeferenced PDFs and outputs from composer (sorry not yet GeoPDF) but you can use composer to create a  PDF – and then add that into QGIS just like any other raster layer. Nyall Dawson
  • Nyall Dawson chatted about his work on QGIS Task manager – a tool to let you easily create concurrent background tasks and show the progress of each task in a simple UI. I believe he is looking for funding to help him get this finished, so if you are interested please contact him.
  • Bivariate legends plugin (not published yet).  Thomas Gratier showed off work he is doing to support the creation of bivariate legends.


Albireo QGIS Fork
albireo

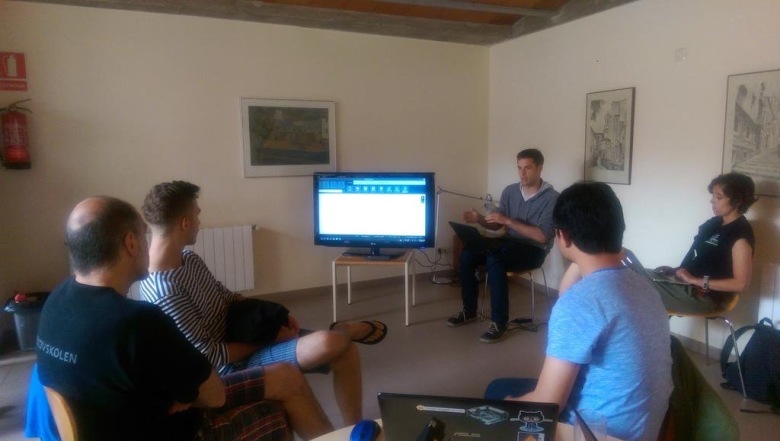
Sandro Mani showed off an awesome new QGIS front end they have been working on at Sourcepole. Their implementation creates a brand dew ribbon based UI paradigm for QGIS (don’t scoff, it’s actually pretty cool!). They have pared down the number of features and grouped functionality into discrete areas, both the menus and ribbon icons changing based on the context of what you are doing. You can see the source code here: https://github.com/sourcepole/kadas-albireo.  Here are some bullet notes I made while watching his presentation:

  • 3D Globe updates to get it ready for production use. They have also integrated the 3D extrusion support and lots of improvements to the globe that Matthias Kuhn did as part of his masters thesis. Its really exciting to think that these improvements may make their way into the official QGIS builds sometime soon and we can all enjoy them.
  • Redlining – you can sketch onto the map without saving those geometries in a specific layer.
  • Measuring & profile tools
  • Shift-drag for zoom – just like you can do in OpenLayers and Leaflet (Nyall then went and added this to QGIS for 2.16 – yay!)
  • Switch coordinate reference systems used for cursor position display easily from the status bar

There were many other cool features – some of them may make their way into the mainstream QGIS desktop. If you are looking to support users who need a simplified QGIS user interface, Albireo QGIS spin off is something to watch.

Conclusion

Girona was an absolutely awesome venue for the QGIS Conference and Hackfest. I hope the participants of the conference gained good benefit from the experience. The hackfest had around 50 participants and beyond the above notes, there was such a lot going on including work on the documentation system, discussions on the proposed community voter system (more on that in a follow up blog post) and many other things. I really encourage you to attend these events if you want to keep track of the leading edge of QGIS developers.


QGIS style dock – Part 1 – Live Styles!

This post is part of a series exploring the new style dock.

  • Part 1 – Styles
  • Part 2 – Plugin pages
  • Part 3 – New panel API

A while ago did a post about the new style dock in QGIS. The first stage was getting labels working and then moving on to styles. After many iterations of the UIs and the APIs I’m pretty happy with the release state of the dock. We now have styles (vector and raster), labels, saved styles, undo redo, and plugin support (yep!)

Of all the features I have added to QGIS this is my favorite. Nothing has made me feel more productive then working on this feature and seeing the gains it allows in day to day work.

If you haven’t used the style dock yet I would strongly encourage you to grab the nightly QGIS builds and give it a crack, F7 to open anytime, or use the paint brush icon on the layers panel.   I’m not bragging when I say that it will change your life in QGIS for the better, it has become a part of my daily workflow. No going back!

Dock break down

breakdown

As you can see in the image there is a few main things in the dock, the layer selection, style options selector (come back to this later), undo/redo, live update and apply.

Live Updates

One of the key things for me when doing this dock was instant feedback. I really hated the open close, change, apply, repeat workflow of the old dialogs.  Every widget in the dock can request a redraw on change so you can see feedback instantly in the canvas.  This might not always be what you want so you can disable it for those cases and use manual apply.

Undo Stack

Live updates come with a risk. What happens if you apply something you didn’t mean. There is no cancel button. Well not to fear we now have a undo/redo stack.  Any style change will now add an entry to the style undo stack so you can rollback and forward any changes. Undo/Redo now allows for fearless style changes, so style away to your hearts content and rollback anything you don’t like.

I will also add that the undo stack is stored on the layer object itself, so closing the dock doesn’t clear the stack nor does changing the active layer. You can also access the stack via the Python bindings if needed.

Style Options

On the side of the dock we have the different style options.  These buttons change the style options in the main panel.

options
Vector Style Options
  • Style
  • Label
  • Saved styles
  • Undo/Redo
optionsraster
Raster Style Options
  • Style
  • Transparency
  • Histogram
  • Saved styles
  • Undo/Redo

The Saved Styles and Undo/Redo will always be the last in the stack regardless of the active layer type.

Style UIs (Note: GIF heavy section)

Almost all the widgets have been tweaked to allow for better dock layout. Widgets are now in a more uniform layout which flows better when moving around in the dock and just generally look better.

layout

When I talked about live updates before this applies to everything, even the data defined buttons.  Any changes in those will be reflected into the canvas without any extra clicks.

dd

Changing renderers is now simple and quick. You go from nothing to seeing instant results in seconds.

change

A excellent side effect of the live updates is workflows that were never exposed before and now possible. Using the graduated renderer histogram for example. As the histogram allows for live edits we can now update the map on the fly from adjusting the histogram.

hiso.gif

Style UIs (Raster)

As soon as I finished vectors it became pretty evident that raster layers were going to be the next main thing to move.   So the style dock fully supports raster styling.

raster

Undo/Redo

For the final trick. Here we have the undo/redo stack in action. Unlimited undo/redo  on all layers when changing styles. Fearless change he we come

undo

Trying to find a picture to sum up my feelings about the style dock and I think this fits

but of course I’m super bias.

Stay tuned for Part 2 where I talk about adding your own style panels to the style dock.

QGIS style dock – Part 2 – Plugin panels

In part 1 I talked about the new style dock and the in built functions it has in this post I would like to cover how you can extend that dock using plugin panels.

While building the dock it became evident that being able to add your own panels with be super neat, why lock the user to what styling controls we have built into core.

After one, or two, API iterations it is now possible to add your own panels to the style dock.

First we need to make a new widget using QgsLayerStylingPanel

class CustomPanel(QgsLayerStylingPanel):
    def __init__(self, layer, canvas, parent):
        super(CustomPanel, self).__init__(layer, canvas, parent)
        self.layer = layer

    def apply(self):
        pass

then we need to create a factory object (QgsLayerStylingPanelFactory) which will hold the metadata for the panel widget, things like icon, title, and the widget it self as required. The factory object looks like this:

class PanelFactory(QgsLayerStylingPanelFactory):
    def icon(self):
        return QIcon(r"F:\icons\SVG\book.svg")

    def title(self):
        return ""

    def supportsLayer( self, layer):
        return layer.type() == QgsMapLayer.VectorLayer

    def createPanel(self, layer, canvas, parent):
        return CustomPanel(layer, canvas, parent)

# Also make a instance and tell the style dock about it
# make sure you keep a instance of the the factory around
factory = PanelFactory()
iface.registerMapStylePanelFactory(factory)

You can also see we have a supportsLayer() method. This must return True if the layer can be supported for the widget, if the layer isn’t support it’s not shown in the layer style dock. We also have the createPanel method which just returns the widget, you could also use this method to return different widgets based on layer type if you needed. This createPanel method will be called any time the item is selected in the left panel of the style dock. Using the above code we will see a new icon on the side panel

style

Remember, the create method is called any time this new item is selected.    If your widget is expensive to create you can create a cache here.

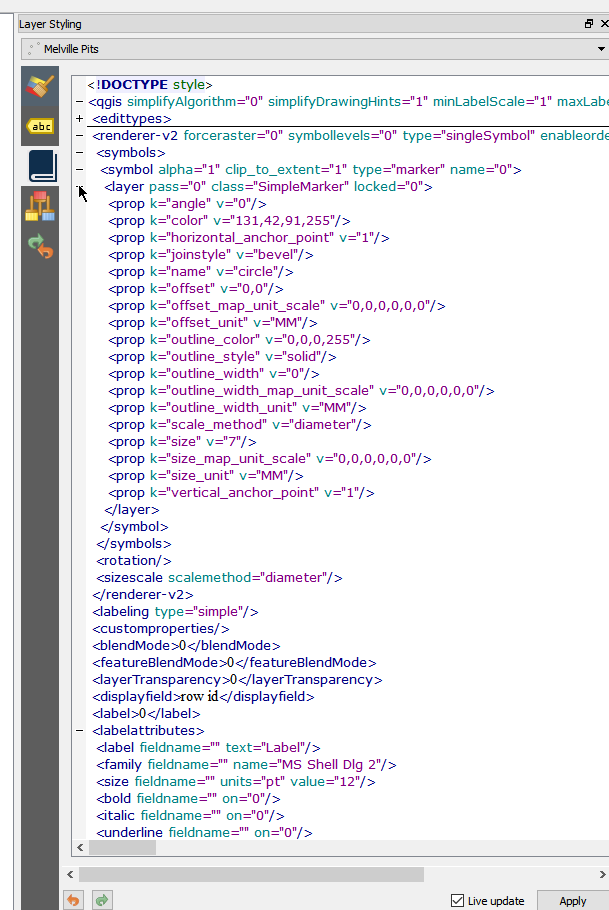
Now lets add some logic.  As an example I’m going to load the style xml and show it in the panel. Adding some logic to the __init__ method of the CustomPanel class

class CustomPanel(QgsLayerStylingPanel):
    def __init__(self, layer, canvas, parent):
        super(CustomPanel, self).__init__(layer, canvas, parent)
        self.layer = layer
        self.setLayout(QVBoxLayout())

        # Create the editor and set the xml from the layer.
        self.editor = QgsCodeEditorHTML()
        self.editor.setLexer(QsciLexerXML())
        doc = QDomDocument( "style" ) 
        rootNode = doc.createElement( "qgis" )
        doc.appendChild( rootNode )
        iface.activeLayer().writeStyle( rootNode, doc, "")
        xml = doc.toString()
        self.editor.setText(xml)
        self.layout().addWidget(self.editor)

xml

Nifty.  Now can we 1 UP it and make it live edit?  Sure can!  The style dock will call apply() whenever we raise the widgetChanged signal.  We can just connect this to the text changed event and add some logic to the apply method.

class CustomPanel(QgsLayerStylingPanel):
    def __init__(self, layer, canvas, parent):
        super(CustomPanel, self).__init__(layer, canvas, parent)
        .....
        self.editor.textChanged.connect(self.widgetChanged.emit)

    def apply(self):
        # Read the xml and set it back to the style.
        doc = QDomDocument( "style" ) 
        doc.setContent(self.editor.text())
        node = doc.documentElement()
        self.layer.readStyle(node, "")
        self.layer.triggerRepaint()

live

WINNING!

Pro Tip: Raise widgetChanged whenever you need to tell the style dock to trigger the apply method. The style state of the layer will also be saved to the undo stack so you don’t have to worry about that.

This is just an example, hand editing xml is well gross, but I’m sure you can see great uses for being able to expand the style dock.

New GRASS GIS 7.2.x stable release branch created

Towards the new stable release series

As of 24 May 2016, a new stable release branch was created for the upcoming GRASS GIS 7.2 release. This new branch includes all the many improvements which have been implemented in the former development version 7.1.svn.

What is a branch? In simple words, it is a kind of directory in the software development server (SVN in our case) in which no more development but only bugfixing happens. From a release branch, new stable releases are created and published.

The actual branches in the GRASS GIS project are:

  • very old stable: releasebranch_6_4 (used for bugfixing and to publish stable GRASS GIS 6.4.x releases) – very low release frequency (started in revision r34936)
  • old stable releasebranch_7_0 (used for bugfixing and to publish stable GRASS GIS 7.0.x releases) – perhaps one last release upcoming (branch started in revision r59487 but development already started in Apr 2008 in r31142)
  • new stable releasebranch_7_2 (used for bugfixing and to publish stable GRASS GIS 7.2.x releases) – upcoming series of stable releases (branch started in revision r68500)
  • trunk (used for development, with pseudo-name 7.3.svn) – under heavy development

Note to SVN users

The trunk branch with pseudo-name 7.1.svn has become 7.3.svn due to the creation of the new 7.2.svn release branch. You can simply continue to update from SVN, the version will be automatically updated.

If you used to work with the 7.0.svn release branch, consider to download the new 7.2.svn release branch, either from the weekly source code snapshot (here) or from the SVN server directly (here).

About GRASS GIS

The Geographic Resources Analysis Support System (http://grass.osgeo.org/), commonly referred to as GRASS GIS, is an Open Source Geographic Information System providing powerful raster, vector and geospatial processing capabilities in a single integrated software suite. GRASS GIS includes tools for spatial modeling, visualization of raster and vector data, management and analysis of geospatial data, and the processing of satellite and aerial imagery. It also provides the capability to produce sophisticated presentation graphics and hardcopy maps. GRASS GIS has been translated into about twenty languages and supports a huge array of data formats. It can be used either as a stand-alone application or as backend for other software packages such as QGIS and R geostatistics. It is distributed freely under the terms of the GNU General Public License (GPL). GRASS GIS is a founding member of the Open Source Geospatial Foundation (OSGeo).

The GRASS Development Team, May 2016

The post New GRASS GIS 7.2.x stable release branch created appeared first on GFOSS Blog | GRASS GIS Courses.

Gaining more WMS speed through enabling the QGIS cache directory

Interestingly the WMS caching is not enabled by default in QGIS. To better enjoy WMS/WMS-C/WMTS connections – if you have some disk space to dedicate – it is a good idea to enable the cache in these few steps:

Go to the menu entry Settings >> Options:

Enabling the QGIS WMS cache - step 1

Enabling the QGIS WMS cache – step 1

Go to tab “Network“. Therein, in “Cache settings“, select the “Directory” and choose a folder for the cache files. Be sure that there is free space for lots of megabytes can be stored there over time. And this directory should ideally be located on a fast disk (if you have several).

Here I choose the existing “tmp/” folder in my HOME directory and create inside a new folder “qgis_wms_cache”:

Enabling the QGIS WMS cache - step 2

Enabling the QGIS WMS cache – step 2: create new “qgis_wms_cache” cache folder

Eventually we change the “Default expiration period for WMS-C/WMTS tiles (hours)” to more than 24 hours (as it would be rather useless…). Here I change to 24*30 = 720 hours. And the cache size we increase as well, here to 250MB (written as 250000 since it is to be given in kilobytes):

Enabling the QGIS WMS cache - step 3

Enabling the QGIS WMS cache – step 3: increase expiration period for tiles and cache size

Now we press “OK” and close the dialog. Time to try out a WMS service, zoom back and forth… and:
Enjoy!

The post Gaining more WMS speed through enabling the QGIS cache directory appeared first on GFOSS Blog | GRASS GIS Courses.

Introducing First Aid Plugin

Software development often consists of a brief period of pure excitement while writing the bulk of the source code, followed by a long and dreaded period of finding bugs and fixing them. This scheme is no different when writing plugins for QGIS.

Because we also write QGIS plugins ourselves, we were thinking of how to ease the pain of getting rid of bugs – and so we ended up creating the First Aid plugin, now available in the official QGIS plugin repository.

It is meant to be a Swiss army knife for QGIS plugin developers, a tool that allows easy inspection of any Python code running within QGIS. This is important because it can potentially save developers a lot of their valuable time.

How many times did you end up adding “print” statements into the code to find out what was going wrong in your code? With First Aid plugin this should be no longer necessary.

Error Handler

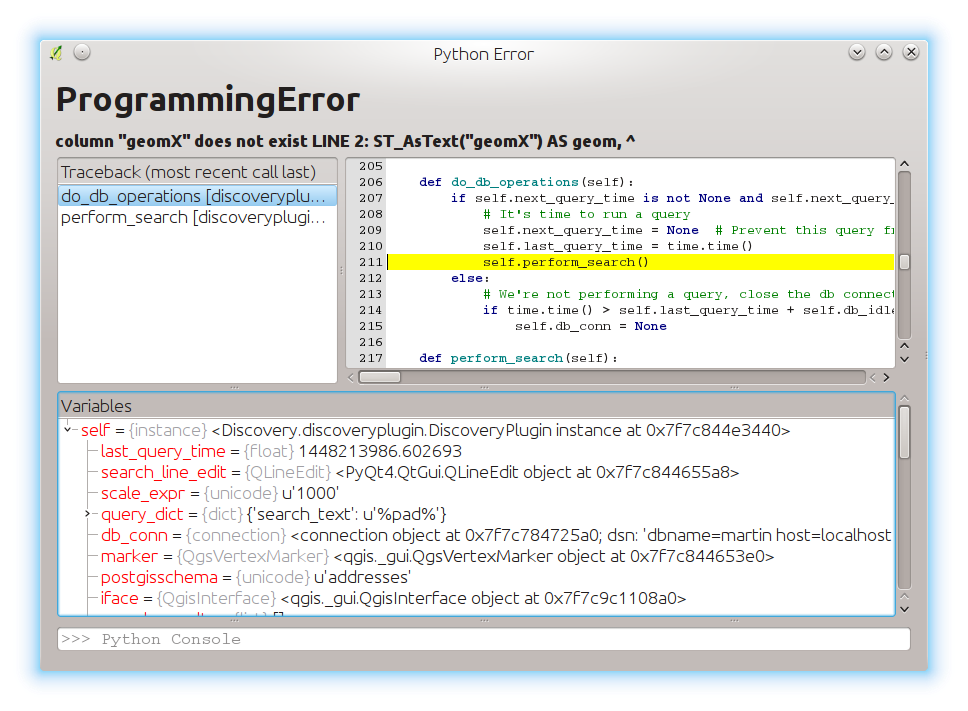
So let me explain what does it do. First of all, it comes with an improved Python error handler. What this means is that whenever an error occurs in code of a plugin, a window with all the details comes up.

Previously in QGIS you could only find out what was the exception’s type, message and stack trace. First Aid plugin adds source code view, variables view and even an embedded Python console where you can further inspect the state of the plugin at the time of the error. Here is how it looks like in action:

Error Handler Screenshot

Debugger

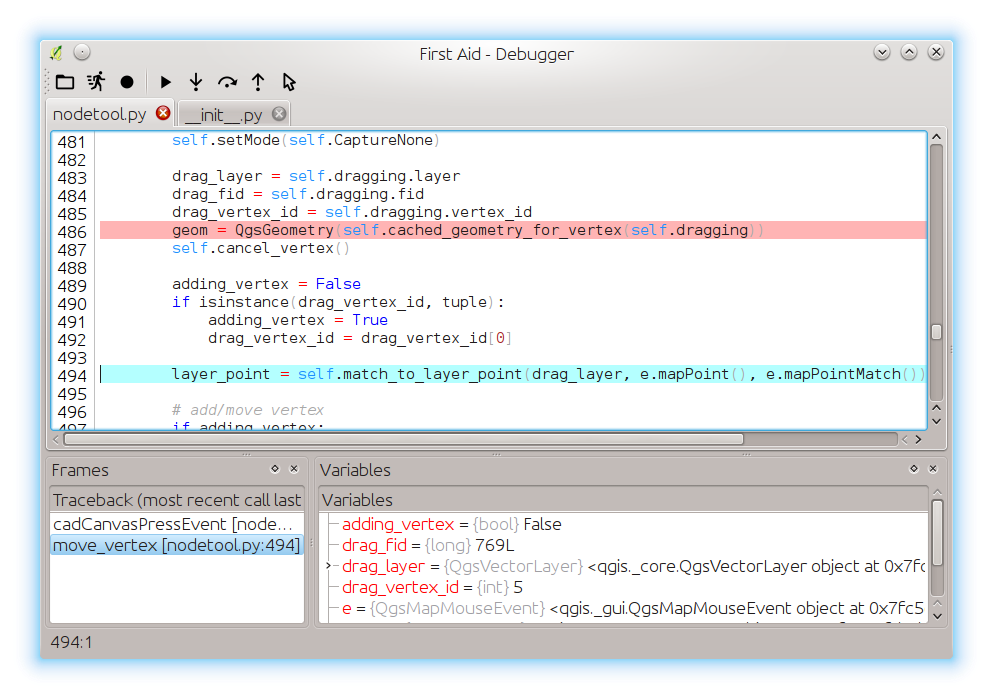
Plugins however do not always come up with errors that can be caught and handled by QGIS. More often plugins simply do not behave as one would expect them to. Here is when people usually resort to using debuggers. There are IDEs like PyDev or PyCharm - or even standalone tools like Winpdb - that allow developers to do remote debugging. Basically they can connect to the Python environment within QGIS and debug the code there. Personally, I have never been a big fan of this approach and found remote debugging cumbersome to set up and use. And trying to debug something on a client’s computer is even a greater challenge.

First Aid fortunately integrates a debugger into QGIS environment. This allows developers to simply open the debugger window, load some Python files, set breakpoints and everything is ready. Once QGIS reaches a line with a breakpoint, the debugger window will be activated and it is possible to step through the code and inspect the variables to understand what is going on in the code.

Debugger Screenshot

The great thing is that once the execution of Python code is stopped, it is possible to step into code, step over, step out or run to cursor, just like in any other debugger. It is also possible to run custom scripts from within debugger window – they will be also run in debug mode.

Debugging is active only while the debugger window is still open. While debugging, there is some extra overhead when running any Python code (even for code that you do not intend to debug), so it is better to close the debugger when not needed.

The plugin has already helped us various times to quickly identify problems in plugins. Having said that, please note that the plugin is still quite young and may not work perfectly in all cases. We would be happy to hear your feedback. Any issues or pull requests on GitHub would be greatly appreciated!

You may also like...

Mergin Maps, a field data collection app based on QGIS. Mergin Maps makes field work easy with its simple interface and cloud-based sync. Available on Android, iOS and Windows. Screenshots of the Mergin Maps mobile app for Field Data Collection
Get it on Google Play Get it on Apple store

QGIS Code Sprint - FOSS4G UK - 2016

Issue Reporting

The Open Source community in the UK will get together for another great FOSS4G meeting from 14 to 16 of June in Southampton.

QGIS has already established itself as one of the major Open Source GIS applications. To help the community to contribute back to the project, we are running a code sprint.

The code sprint session will not require prior knowledge of coding, so all participants are welcome to join. Make sure you bring your laptop!

There will be several power users and plugin developers to help with the code sprint. There will be 3 topics covered during the code sprint:

  • Documentation
  • Helping with the bug fixing
  • Contributing to qgis2web plugin

Documentation

If you are interested in helping with the QGIS documentation, we will run a short presentation to introduce you to the workflow.

Participants are required to have installed and configured the following software packages:

Helping with the bug fixing

For those who are interested in findings bugs, testing existing bugs and leaning up the bug queue, you will need:

  • An OSGeo ID
    • Currently requires contacting OSGeo admins on IRC (#osgeo) in order to get the registration form (!)
  • Multiple versions of QGIS
    • QGIS LTR (LTS)
    • QGIS release
    • QGIS master

If you are familiar with coding (in C++ and python) and would like to fix some bugs, you will need:

  • QGIS development environment
  • Github account

##Contributing to qgis2web plugin##

qgis2web

Help improve qgis2web by joining any of these activities:

What you’ll need

  • laptop
  • QGIS, ideally current or nightly
  • a Github account
  • whatever Git/Github client you prefer
  • your favourite text editor

Details of some specific bugs and features are listed in a dedicated Github issue. If you are not coming to FOSS4GUK 2016, we’d still really value any help you can give. We’ll keep an eye on Github, or try the qgis2web Gitter.

This is a great opportunity to take your first steps in contributing to an open-source project. Come and help - we’ll tell you everything you need to know, and help you learn the skills you don’t yet have. Rest assured that we will be at least as grateful as you for the help you give.

If you are a beginner, @archaeogeek is also running a great workshop at FOSS4GUK 2016 on getting started in open-source: Don’t be afraid to commit

You may also like...

Mergin Maps, a field data collection app based on QGIS. Mergin Maps makes field work easy with its simple interface and cloud-based sync. Available on Android, iOS and Windows. Screenshots of the Mergin Maps mobile app for Field Data Collection
Get it on Google Play Get it on Apple store

Licensing requirements for QGIS plugins

One thing we have been encountering lately in the QGIS project is plugin authors not understanding the licensing requirements for publishing their QGIS plugins. In this article I will try to clarify this a little:

QGIS is Open Source Software and provides a great platform for third parties to distribute additional functionality to users through our plugin system. QGIS is licensed under the GPL version 2 or greater. This license is provided with every copy of the QGIS and in the source code and is available on our web site here:

http://docs.qgis.org/2.0/en/docs/user_manual/appendices/appendices.html

Under the terms of this license, it is a requirement that all plugins distributed via http://plugins.qgis.org (or through other repositories that may be self-hosted) should comply with the GPL version 2 or greater license. In particular all code included in any plugin should be made clearly and easily available in source form. It has come to our attention that some plugin authors are distributing plugins that do not comply with this condition.

We ask you to consider the fact that many thousands of hours of work and large amounts of financial outlay from individuals and companies has gone into the creation of QGIS. This work is done under the basis that in-kind contributions raise the quality and capabilities of the platform for everyone. When you create a plugin, you only need to spend a minimal amount of effort to solve your specific requirements because we have done the rest of the work needed to provide an entire platform for you and our community of users. This is a key value proposition of Open Source: ‘a rising tide floats all boats’.

By publishing the source code for your plugin, others may inspect the underlying code of your plugin and learn from it and use that knowledge to further improve the platform. Not releasing your source code breaks this model. Besides being a contravention of the licensing conditions under which you received the QGIS software, withholding your source code does not advance the body shared knowledge, and does not embrace the spirit of sharing that has made the QGIS project such a success to date.

Thus if you are a plugin author who is distributing your plugin without the accompanying source code, you need to be aware that the source code needs to be made available to each person who receives the binary sources for your plugin.

One query that plugin authors have raised is whether the requirement to publish the sources of their plugin precludes their ability to sell or otherwise commercially benefit from their plugin work. This is not the case – you can sell you plugin as long as you make  the sources of your plugin available under the same license as QGIS to each purchaser.

Should you have any queries about how to better collaborate within the QGIS community we are available to you – please direct your queries to [email protected]


Using OS AddressBase for Address Search in QGIS

In this blog post we’ll learn how to use Ordnance Survey AddressBase data with the QGIS Discovery plugin for searching addresses.

Discovery Plugin for QGIS

Before we start

The AddressBase data will be loaded into a PostGIS table for Discovery to query. At this stage we should already have a functioning PostgreSQL / PostGIS installation.

A previous blog post describes how to quickly set up such an environment.

Creating the addressbase table

Let’s now create a table for storing the addressbase data. In the example below we’ll create a table called addressbase in the os_address schema.

The script below can be executed through pgAdminIII.

To run the script:

  1. Open pgAdminIII
  2. Connect to your destination database
  3. Select Query tool from the Tools menu
  4. Paste the code below into the Query tool
  5. Press F5 to execute the query (it may take a few seconds to complete)

When the query has finished you should see Query returned successfully with no result in … seconds. in the Messages panel:

pgAdminIII Messages Panel

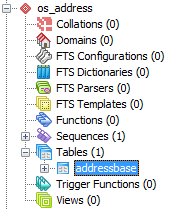
At this point we should be able to locate the new addressbase table within the os_address schema:

addressbase Table

If you can’t see the schema / table you probably need to refresh the schemas / tables views in pgAdminIII’s Object browser panel by hitting F5.

-- Create the destination schema if required
CREATE SCHEMA IF NOT EXISTS os_address;

-- Create a function which will populate the full_address and geom columns as
-- data are imported
CREATE OR REPLACE FUNCTION create_geom_and_address()
RETURNS trigger AS $$
BEGIN
  -- The geometry
  -- Set it based on the x_coord and y_coord fields
  NEW.geom = ST_SetSRID(ST_MakePoint(NEW.x_coordinate, NEW.y_coordinate), 27700);
  -- The full address
  -- Initialise it
  NEW.full_address = '';
  -- Build the full address by only including optional address components if they
  -- exist
  IF NEW.organisation_name IS NOT NULL AND length(NEW.organisation_name) > 0 THEN
	NEW.full_address = NEW.full_address || NEW.organisation_name || ', ';
  END IF;
  IF NEW.department_name IS NOT NULL AND length(NEW.department_name) > 0 THEN
	NEW.full_address = NEW.full_address || NEW.department_name || ', ';
  END IF;
  IF NEW.po_box_number IS NOT NULL AND length(NEW.po_box_number) > 0 THEN
	NEW.full_address = NEW.full_address || NEW.po_box_number || ', ';
  END IF;
  IF NEW.sub_building_name IS NOT NULL AND length(NEW.sub_building_name) > 0 THEN
	NEW.full_address = NEW.full_address || NEW.sub_building_name || ', ';
  END IF;
  IF NEW.building_name IS NOT NULL AND length(NEW.building_name) > 0 THEN
	NEW.full_address = NEW.full_address || NEW.building_name || ', ';
  END IF;
  IF NEW.building_number IS NOT NULL THEN
	NEW.full_address = NEW.full_address || NEW.building_number || ', ';
  END IF;
  IF NEW.dependent_thoroughfare IS NOT NULL AND length(NEW.dependent_thoroughfare) > 0 THEN
	NEW.full_address = NEW.full_address || NEW.dependent_thoroughfare || ', ';
  END IF;
  IF NEW.thoroughfare IS NOT NULL AND length(NEW.thoroughfare) > 0 THEN
	NEW.full_address = NEW.full_address || NEW.thoroughfare || ', ';
  END IF;

  NEW.full_address = NEW.full_address || NEW.post_town || ', ';

  IF NEW.double_dependent_locality IS NOT NULL AND length(NEW.double_dependent_locality) > 0 THEN
	NEW.full_address = NEW.full_address || NEW.double_dependent_locality || ', ';
  END IF;
  IF NEW.dependent_locality IS NOT NULL AND length(NEW.dependent_locality) > 0 THEN
	NEW.full_address = NEW.full_address || NEW.dependent_locality || ', ';
  END IF;

  NEW.full_address = NEW.full_address || NEW.postcode;

  RETURN NEW;
END;
$$ LANGUAGE 'plpgsql';

-- Drop any existing addressbase table
DROP TABLE IF EXISTS os_address.addressbase CASCADE;
CREATE TABLE os_address.addressbase
(
  -- id will be the primary key, populated automatically
  id serial NOT NULL,
  uprn bigint NOT NULL,
  os_address_toid varchar(24) NOT NULL,
  -- os_address_toid bigint NOT NULL,
  udprn integer NOT NULL,
  organisation_name varchar(60),
  department_name varchar(60),
  po_box_number varchar(6),
  sub_building_name varchar(30),
  building_name varchar(50),
  building_number smallint,
  dependent_thoroughfare varchar(80),
  thoroughfare varchar(80),
  post_town varchar(30) NOT NULL,
  double_dependent_locality varchar(35),
  dependent_locality varchar(35),
  postcode varchar(8) NOT NULL,
  postcode_type char(1) NOT NULL,
  x_coordinate numeric(8,2) NOT NULL,
  y_coordinate numeric(9,2) NOT NULL,
  latitude numeric(9,7) NOT NULL,
  longitude numeric(8,7) NOT NULL,
  rpc char(1) NOT NULL,
  country char(1) NOT NULL,
  change_type char(1) NOT NULL,
  la_start_date date NOT NULL,
  rm_start_date date NOT NULL,
  last_update_date date NOT NULL,
  class char(1) NOT NULL,
  -- the next two fields are populated automatically on insert
  full_address text NOT NULL,
  geom geometry(Point,27700) NOT NULL,
  CONSTRAINT addressbase_pkey PRIMARY KEY (id)
)
WITH (
  OIDS=FALSE
);

-- Create a pg_trgm index on the full_address column
-- This will allow super-fast, case-insensitive search on the column
CREATE EXTENSION IF NOT EXISTS pg_trgm;
CREATE INDEX addressbase_full_address_gin_trgm
  ON os_address.addressbase
  USING gin
  ("full_address" gin_trgm_ops);

-- Spatial index for the geometry column
CREATE INDEX addressbase_geom_gist
  ON os_address.addressbase
  USING gist
  (geom);

-- trigger to create points and addresses
-- This trigger will be executed on each row inserted, calling the function defined above
CREATE TRIGGER tr_create_geom_and_address BEFORE INSERT
  ON os_address.addressbase
  FOR EACH ROW
  EXECUTE PROCEDURE create_geom_and_address();

The script above has:

  • Created a table
  • Added any necessary indices
  • Created two additional, derived columns, full_address and geom

full_address will be used to store various address components into a sensible, human readable address. geom will be used to store point geometry based on address eastings/northings.

See the script comments for more information / detail.

Loading AddressBase

At this point we have an empty table ready to accept our AddressBase data. We will now import the data using pgAdminIII. Extract the CSV files for the addresses, you should end up seeing one or more CSV files, for example AddressBase_FULL_2016-03-19_001.csv

In pgAdminIII:

  1. Locate the addressbase table
  2. Right click it, select Import

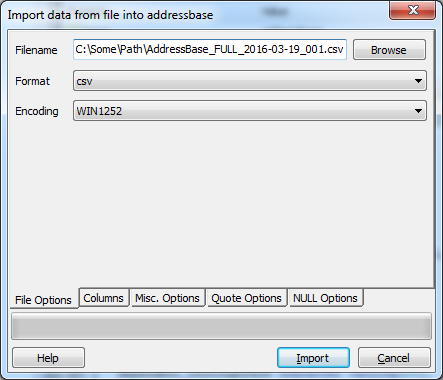
An import dialog should appear. Select the first CSV file and set the settings in the File Options tab as shown here:

AddressBase Import Options 1

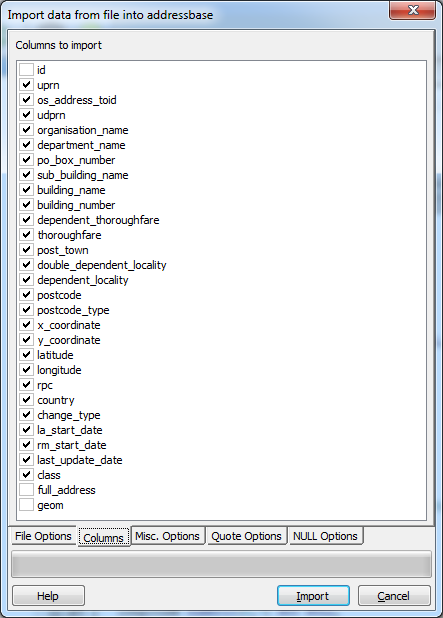
Uncheck the id, full_address and geom columns in the Columns tab as shown here:

AddressBase Import Options 2

Click Import. After a few seconds the dialog may report (Not Responding). This is nothing to worry about, be patient.

When the import process completes, close the import dialog and repeat the above steps with any remaining CSV files.

At this stage the data has been imported and the full_address field should contain sensible, human-readable addresses.

Configuring Discovery

With the data loaded in QGIS, we can now configure Discovery to make use of it.

  1. Install the Discovery plugin if not already installed
  2. Open Discovery’s settings using the button
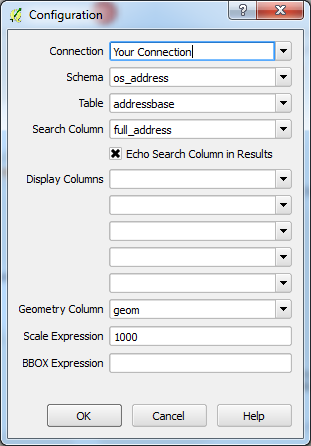
  3. Set the settings as follows, changing the Scale Expression if required

Discovery Settings for OS AddressBase

Congratulations! QGIS should now be set up to search your AddressBase data.

You may also like...

Mergin Maps, a field data collection app based on QGIS. Mergin Maps makes field work easy with its simple interface and cloud-based sync. Available on Android, iOS and Windows. Screenshots of the Mergin Maps mobile app for Field Data Collection
Get it on Google Play Get it on Apple store

Speeding up QGIS build times with Ninja

As a developer, feedback is important when you are working.  The quicker you have the feedback the quicker you can fix the issues.  This doesn’t just apply to feedback from users/clients but also from your tooling.

Finding a new tool that increases my productivity is one of the best feelings, and this is one of those cases.   I was told about using Ninja for building instead Make, Visual Studio, Jom (Qt Build Tool).

If you are not a developer and don’t know what those tools are, they are what we use to build and compile all the code in QGIS.  If this step is slow the feedback loop is slow and it becomes annoying.  Improving this feedback loop greatly increases your workflow and happiness, and by happiness I really do mean that.

Ninja is one of these tools that did this. It’s optimized to be fast.  It does very little work in order to be faster any time it can.  Ninja was built by a developer on the Google Chrome team in order to improve their build times (read the history here)

Building QGIS with Ninja is super easy:

Install Ninja from package manager or using the ninja.exe (the whole tool is a single exe) if you are on windows

cd qgis-src
mkdir ninja-build
cd ninja-build
ccmake -GNinja ..
ninja

Done

You can build just the targets you need using

ninja qgis
ninja pycore

etc

The ccmake setup generates the ninja.build file that ninja uses. Myself and Matthias Kuhn have already patched our QGIS cmake files to handle any odd things that got generated – only a handful of things which was nice

The best thing I find about Ninja is how smart it is on knowing if it needs to build something or not, and this is the point that I find other tools fail on. They spend ages wasting time looking for what to do. Ninja knows it in a instant.

When running Ninja with no code changes I get this (on Windows):

21:18:54: Running steps for project qgis2.15.0...
21:18:54: Starting: "C:\QtCreator\bin\ninja.exe" qgis
ninja: no work to do.
21:18:54: The process "C:\QtCreator\bin\ninja.exe" exited normally.
21:18:54: Elapsed time: 00:00. 

Not even a second. If I did the same with VS or JOM I could have written this post before it finished working out what to do.

Here is what happens changing a single file:

21:19:48: Running steps for project qgis2.15.0...
21:19:48: Starting: "C:\QtCreator\bin\ninja.exe" qgis
[1/6] Building CXX object src\core\CMakeFiles\qgis_core.dir\raster\qgshillshaderenderer.cpp.obj
[2/6] Linking CXX shared library output\bin\qgis_core.dll
21:19:51: The process "C:\QtCreator\bin\ninja.exe" exited normally.
21:19:51: Elapsed time: 00:03.

It’s super impressive. Even a cold build on Windows is shorter now. On Linux it’s even faster due to faster disk access in Linux vs Windows

If you build QGIS form source I would highly recommend giving it a crack because I know you will love it.

QGIS Report Plugin Release

Issue Reporting

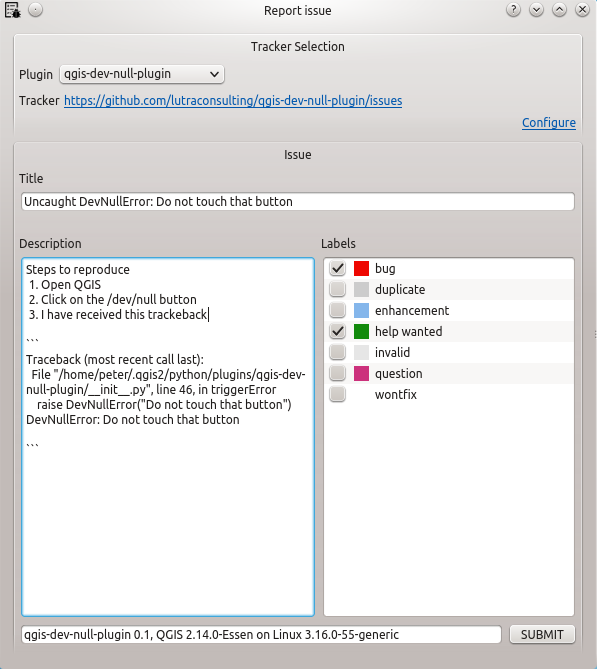
We develop several public and private plugins for QGIS users and our clients. During the testing phase, they often come across some bugs. To enable them to report the issues and include the right type of information, we have developed The Report plugin to simplify the process Report plugin.

The Report plugin helps developers get better bug reports from users, by auto-populating the relevant information. It also simplifies the bug reporting process for users.

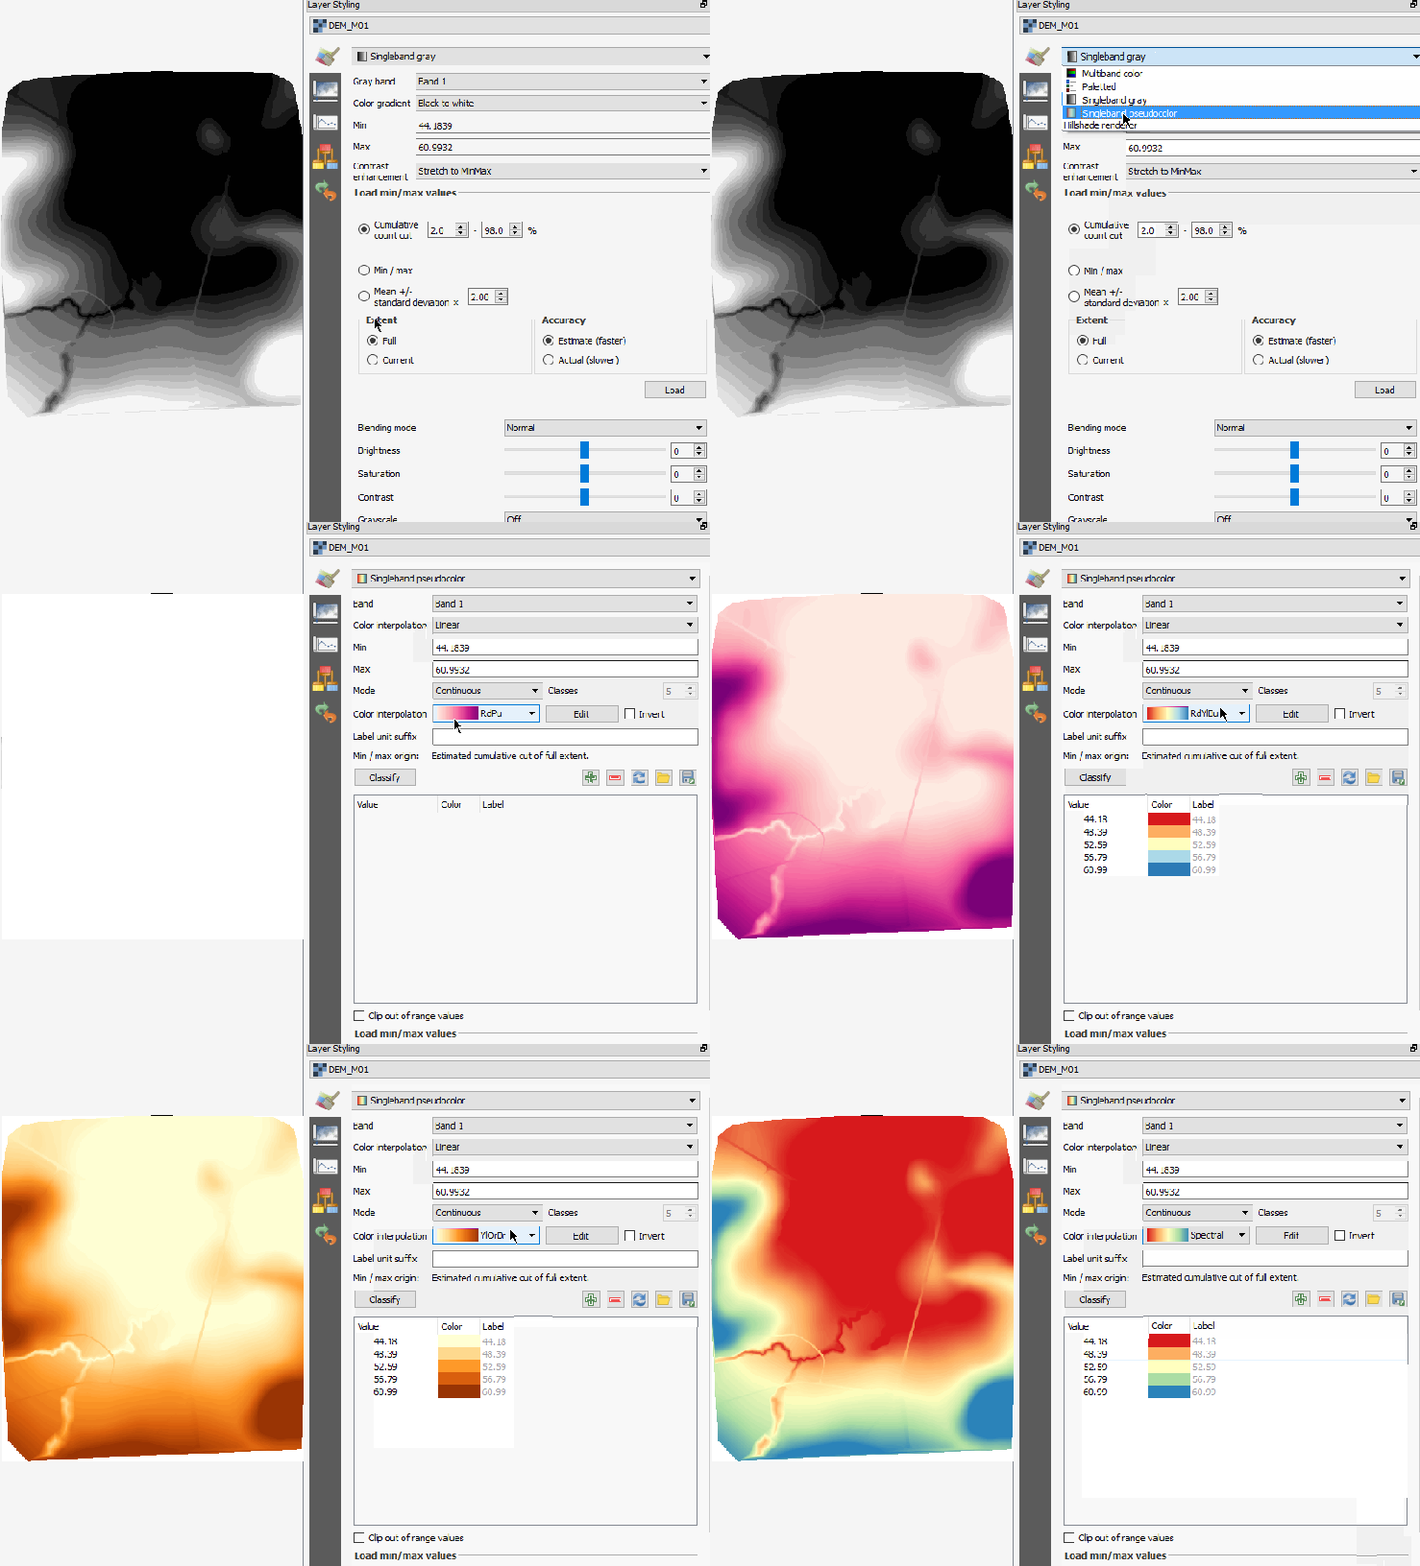
The Report plugin can automatically extract information from the plugin crash as well as other important information for developers. With just one click you can report the issue to the official plugin issue tracker. No need of searching for a plugin’s tracker on the internet or copy-pasting long tracebacks to your browser.
bug report plugin

Installation

  • Install Report plugin from QGIS plugin offical repository
  • Create a GitHub account if you do not have any existing
  • Create a public access token GitHub with public_repo scope
  • Click on the Report plugin toolbar button, Configure link and copy generated GitHub access token to the configuration dialog.
  • Wait for next error and report the problem to the developers

Testing

  • Feel free to download DevNull plugin from QGIS plugin offical repository to be able to test Report plugin
  • After installation fo DevNull plugin, click on the new button /dev/null in your toolbar and watch how report plugin catches the exception
  • Report any number of testing issues to DevNull Issue tracker, they are going to be deleted anyway!
<iframe width="420" height="315" src="https://www.youtube.com/embed/40aiJ793mjs"; frameborder="0" allowfullscreen></iframe>

Notes

  • Report plugin works only with GitHub issue trackers
  • Plugins must have “tracker” metadata filled in, so the Report plugin can detect the plugin issue tracker correctly

When/if QGIS issue tracker moves to GitHub, a similar tool can be added to the core to automatically report bugs and crashes.

You may also like...

Mergin Maps, a field data collection app based on QGIS. Mergin Maps makes field work easy with its simple interface and cloud-based sync. Available on Android, iOS and Windows. Screenshots of the Mergin Maps mobile app for Field Data Collection
Get it on Google Play Get it on Apple store

Call for nominations for voting members of the QGIS.org board.

Dear QGIS Community members
As many of you will be aware, in this last year we have been embarking on the process to transition from a loose-knit community organisation to a more formal organisation. This new organisation ‘QGIS.org’ will be a legal entity and will afford us a greater amount of flexibility in how we manage funds, legal agreements and so forth. You can read the statutes for the QGIS.org organisation for more info.
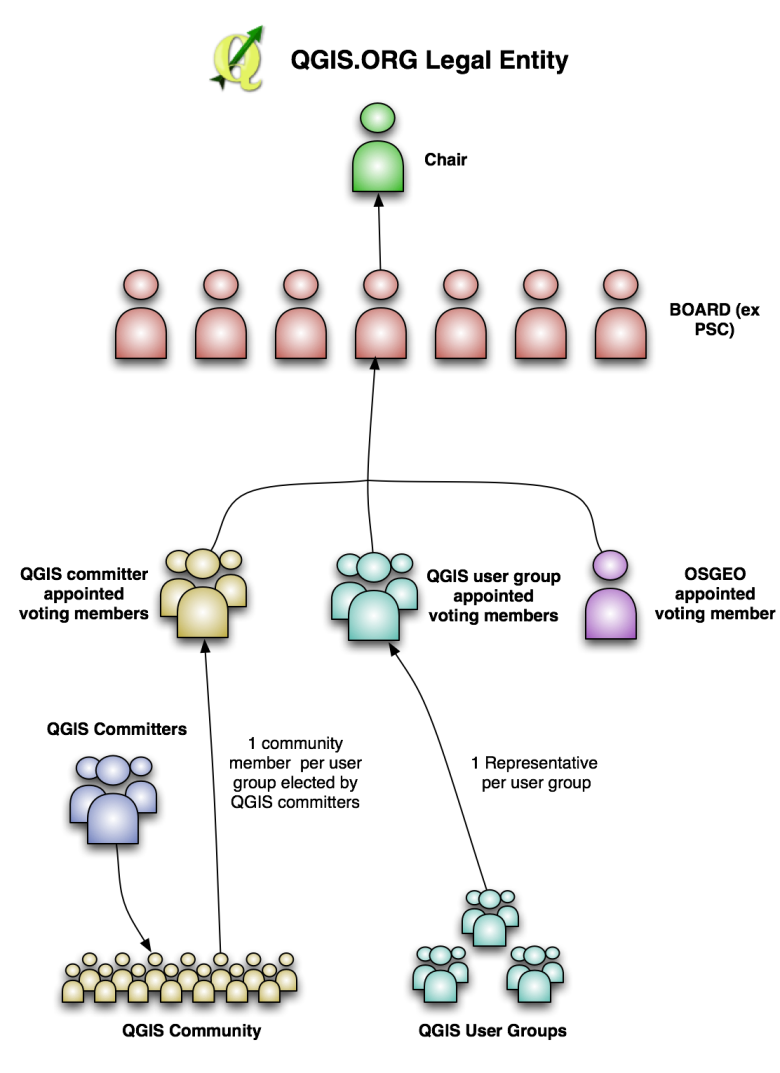
Under the statutes of the new organisation, there will be one user group voting member put forward for each registered user group (user group registration page is here). For each user group voting member we will have a community voting member elected. In addition there will be one voting member from the OSGEO leadership. It is probably best explained by way of a simple (contrived) example:

1) The Martian user group puts forward Joe Alien to be their QGIS User Group Voting Member.
2) QGIS committers put forward nominations for a matching Community Voting Member from within the community. Community member with the highest number of nominations is elected. Only people with git commit rights to an official QGIS repository or write access to the QGIS translation platform on transifex can put forward nominations. The nominated person can be any person from within the QGIS community who is willing to serve as a voting QGIS community member.
3)  The Moon user group puts forward Janet Luna to be their QGIS User Group Voting Member.
4) QGIS committers again nominate a matching Community Voting Member
5) OSGEO puts forward one person to act as the OSGEO voting member.

Voting members will elect the QGIS Board, Board Chairman and approve budgets and the annual report. Once elected, the board will make day to day decisions on behalf of the project as needed. The OSGEO voting member will also serve to ensure that there are always an odd number of voting members to avoid deadlocks. Voting members will have their continued membership confirmed on a 3 yearly basis.
Since we are bootstrapping the QGIS.org organisation, we have not yet elected any voting members. Currently there are 10 QGIS User Groups registered (this number may be different when you read this due to new registrations), thus we would like to invite all people who have Git commit access to any official QGIS repo, or transifex write access to make their nominations for their community voting members. The 10 consenting nominees with the highest number of nominations will be appointed as community voting members.
We will close the nomination period on Wed 11 May if at least 10 unique persons have been nominated, otherwise as soon as 10 unique persons have been nominated.
We will maintain a list of the QGIS Voting Members on the web site for public viewing.
After all of the voting members have been elected they will be asked to elect the members of the board. Board members need not be voting members, any QGIS community member can be elected to the board. For formation of the new board, existing PSC members will automatically be nominated and the community voting members can also put up additional nominations. We would then put the election of the board members to a vote (maintaining the same number of members as are currently in the PSC for now). Once the board has officially been elected, the voting members can then select a chair for the board. Note that all voting will be done electronically via an online form.
By this process we will have a democratically elected board entrusted with stewardship of the new QGIS.org Organisation.
Each year we will hold an annual general meeting and voting members can elect a new chair, or re-elect the existing chair. Similarly on a rotational basis, board members will be up for re-election each year. If things are a little unclear above, I have made a simple diagram which hopefully clarifies things (see below).
QGIS.orgStructure.png
Note that Gary Sherman (QGIS project founder) is board member emeritus and this will not be up for re-election as he has life long tenure on the board.
So if you are eligible to nominate voting members (i.e. you are a committer on any official QGIS repo or a Transifex author), please head over to the form provided to  make your nomination!
timsutton
Tim Sutton
Current QGIS Project Steering Committee Chair

How to create round maps in Print Composer

If you follow me on Twitter, you’ve probably seen previews of my experiments with round maps. These experiments were motivated by a recent question on GIS.stackexchange whether this type of map can be created in QGIS and while it’s not very convenient right now, it is definitely possible:

http://www.quantarctica.org

All maps in this post are created using data from the Quantarctica project.

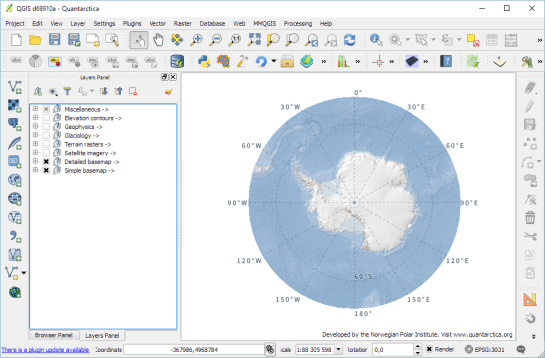
I’ve been planing to try the Quantarctica datasets for a long time and this use case is just perfect. When you download and open their project, you’ll see that they have already clipped all datasets to a circle around Antarctica:

Quantarctica project with some custom styling

Quantarctica project with some custom styling

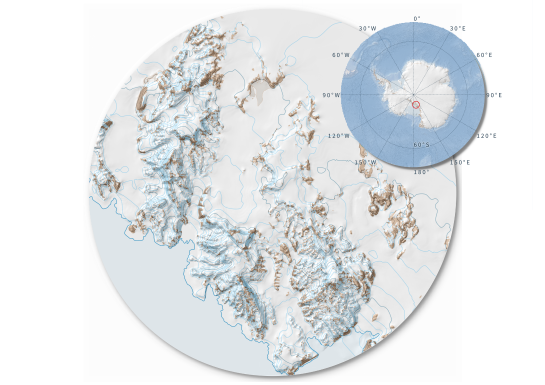
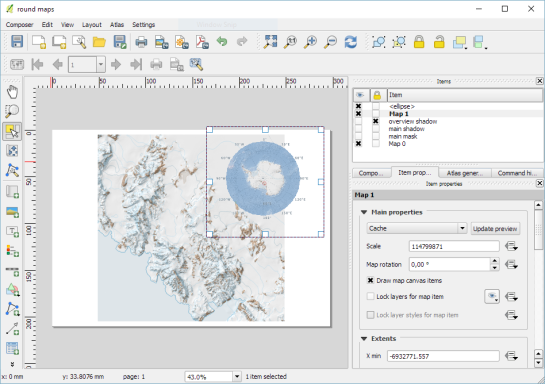
Since the map of the full extent of the dataset is already clipped to a circle, the overview map is easy to deal with. The detail map on the other hand is rectangular by default:

circle_maps_start

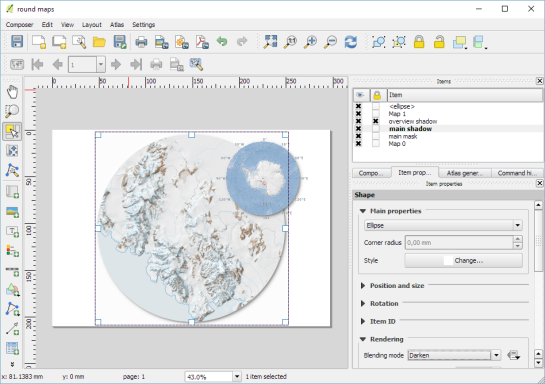
Since we cannot change the shape of the map item, we have to use a mask instead. To create a circular mask, we can add an ellipse shape:

circle_maps_addellipse

The main challenge when creating the mask is that there is no inverted polygon renderer for shapes in print composer. I’ve evaluated to workarounds: First, I created a style with a wide white outline that would cover all map parts outside the circle shape. But this solution slowed the print composer down a lot. An alternative, which doesn’t suffer from this slowdown is using draw effects:

circle_maps_mask_style

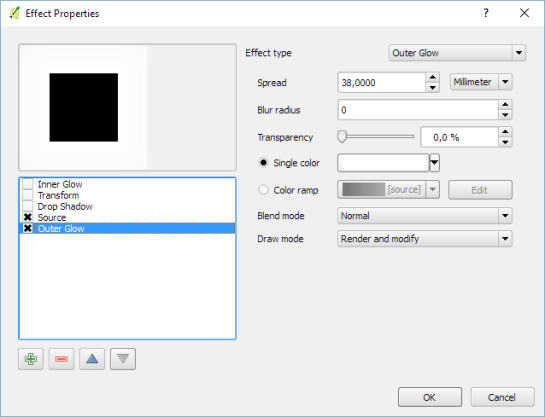
In particular, I created a big outer glow effect:

circle_maps_mask_style_effect

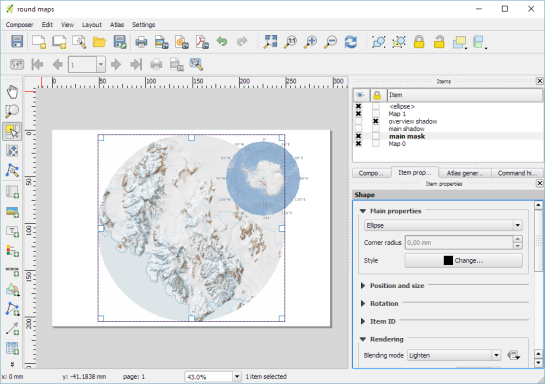
Note that the effect only works if the symbol itself is not transparent. That’s why I set the symbol fill to black and used the Lighten blending mode:

circle_maps_mask

Voilà! Both maps appear are nicely circular.

It is worth noting though that this workaround has a downside: it is not possible to create automatic grids/graticules for these maps. The graticule in the overview map only works because it is a layer in the main project that was already clipped to the circular shape.

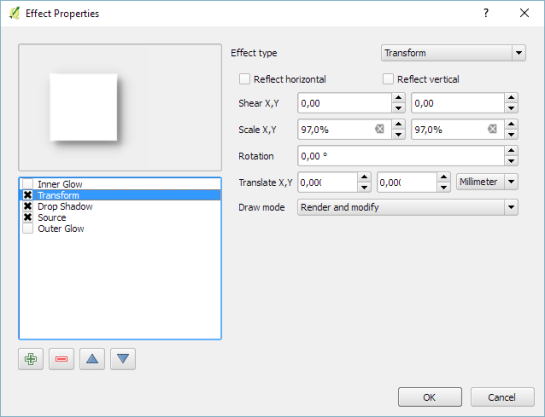
Finally, you can add more depth to your map by adding shadows. To create the shadow effect, I added additional ellipse items which are styled with a drop shadow draw effect. If you only enable the drop shadow effect, you will notice that the shadow is cut off at the ellipse bounding box. To avoid this undesired effect, you can add a transform effect, which reduces the size of the drawn shape and it’s shadow so that the shadow fits into the bounding box:

circle_maps_mask_shadow_effect

It requires some manual adjustments to place the shadow at the optimal location on top of the mask:

circle_maps_mask_shadow

Add another ellipse to create the shadow for the overview map.

For more cartography tips and tricks check my new book QGIS Map Design or join my QGIS training courses.


Setting up and Configuring Discovery plugin for QGIS

As a part of migrating to Open Source GIS, the Newcastle City Council has commissioned us to create a user friendly gazetteer plugin.

In this post, we will import the OS Open Names and configure the Discovery plugin to use the data.

In the following sections, we are going to set up a PostGIS database and import the OS Open Names, freely available from here.

To use the data with the Discovery plugin, we need to first set up a PostGIS database and load the data inside the geo-databases.

If you have an existing Postgresql/PostGIS server, you can skip the next section.

Postgresql/PostGIS installation and configuration

Installation

For MS Windows users, download and install Postgresql from here (32-bit) or here (64-bit) install the software.

During the installation, select the StackBuilder to install PostGIS, under Spatial Extensions.

If your StackBuilder fails to download PostGIS (in case your proxy server blocks it), you can download and install it manually.

Preparing the database

Now that installation is successful, create a new database as osdata. Make sure you add PostGIS extension to your database. You can do that by simply running the following command in the Query editor:

CREATE EXTENSION postgis;

Create osopennames as a new schema under osdata.

Preparing data

In this example, we are focusing on the OS Open Names comes (for Great Britain only) which comes in a zip file containing several CSV files.

If you’d like to use address data for your part of the world, you can visit the OpenAddress website for the global coverage. Note that the CSV files for this dataset come with the vrt files, so you can skip the vrt creation and directly use ogr2ogr.

Once the zip file extracted, there are 2 folders, one containing the header file (DOC) and the other containing the csv files (DATA).

To be able to import all the csv files in PostGIS, we can merge all the files including the header file.

You can move the header file (OS_Open_Names_Header.csv) from the DOC folder. To ensure, the file will appear first during the merge process you can rename it to 1_OS_Open_Names_Header.csv.

You can use Windows command prompt to merge the files. The following command merges all csv files to all_open_names.csv:

 copy /b \*.csv all_open_names.csv

Loading data in PostGIS

There are several methods to import all_open_names.csv in PostGIS:

  1. Adding it as a delimited text layer in QGIS and then load it in PostGIS
  2. Importing it in PostGIS as a CSV and then using PostGIS’ geometry to create points
  3. Using virtual layer and OGR2OGR library

In the example below, we explore the third option.

To create a virtual vector layer from your csv file, open a text editor, copy and paste the following lines and save it as all_open_names.vrt under DATA folder along with your csv file.


	<OGRVRTDataSource>
    	<OGRVRTLayer name="all_open_names">
        	<SrcDataSource relativeToVRT="1">all_open_names.csv</SrcDataSource>
        	<GeometryType>wkbPoint</GeometryType>
        	<LayerSRS>EPSG:27700</LayerSRS>
        	<GeometryField encoding="PointFromColumns" x="GEOMETRY_X" y="GEOMETRY_y"/>
    	</OGRVRTLayer>
	</OGRVRTDataSource>

In fact, you can use the virtual vector layer to merge all your csv files and skip the previous section!

You can then use ogr2ogr command from the OSGeo4W shell to import it to your PostGIS:

    ogr2ogr -append  -a_srs EPSG:27700 -f "PostgreSQL" PG:"host=127.0.0.1 user=postgres dbname=osdata password=postgres active_schema=osopennames" -nln osnames all_open_names.vrt

Note: if you are using the OpenAdress data make sure you assign the right EPSG (4326) in the above command.

Configuring Discovery plugin

First you need to install the plugin from the QGIS plugin repository.

Once the plugin installed, you should have a new toolbar. Click on discovery from the toolbar to open the configuration:

  1. For Connection, select OS Data
  2. For Shema, select opennames
  3. For Table, select osnames
  4. For Search Column, select Name1
  5. Select the option to Echo Search Column in Results
  6. For Display Columns select the followings:
    1. Name2
    2. DISTRICT_BOROUGH
    3. POSTCODE_DISTRICT
    4. COUNTRY
  7. For Geometry Column, select geom (or other columns depending on your QGIS or OGR versions)
  8. For BBOX Expresssion, type the following:
CASE
	WHEN "MBR_XMIN" IS NOT NULL
THEN
	MBR_XMIN || ',' ||
	MBR_YMIN || ',' ||
	MBR_XMAX || ',' ||
	MBR_YMAX
END

And you should be able to start using the gazetteer plugin after pressing OK.

For performance enhancement and other tips visit this page.

You may also like...

Mergin Maps, a field data collection app based on QGIS. Mergin Maps makes field work easy with its simple interface and cloud-based sync. Available on Android, iOS and Windows. Screenshots of the Mergin Maps mobile app for Field Data Collection
Get it on Google Play Get it on Apple store

Promoting and using QGIS for the enterprise

Over the years, QGIS has gained more functionality, more users and more people and organisations who make their livelihood from it. As an Open Source project, there are two things that we value most highly (and equally):

  • Our community of users
  • Our community of project contributors

The two groups are intermingled, co-dependent and indispensable to the project. As both these groups have grown, our reach has grown. Now as a project we touch the lives of (by best estimation) hundreds of thousands of users and contributors around the world.

It is a natural consequence of such reach that QGIS has become an attractive platform for companies on which to build service based business models to their customers. From this rises the advent of ‘enterprise’ offerings – service packages tailored for large corporate and government institutions which need service level agreements, guaranteed turn around times, helpdesk support and so on. As a volunteer driven, grass roots project we are not in the position to, and do not have the interest in catering to this class of user base via support agreements etc. Commercial support is far better taken care of through third party service providers that have the infrastructure and legal means to set up such service offerings.

As the momentum grows around such enterprise services it is probably an inevitable consequence that tension may arise between third party service providers and the QGIS core project. In simplistic terms this tension can be seen as the dichotomy between those of us who view our work on QGIS as a labour of love versus those who see their work around QGIS as a labour of commercial enterprise. Of course there are many cases where the people providing such support do come from the community, do see their work as a labour of love, but as the stakes get higher and the size of support companies grows (to the point where they are also recruiting staff from outside the QGIS community), there is more opportunity for this dichotomy to realise itself.

The reality is that much like the relationship between project contributors and our community of users, there is a huge amount of potential symbiosis between the QGIS developer community and the growing number of value added resellers providing services around QGIS: many of the improvements, bug fixes and other enhancements produced by value added resellers make their way back into the core QGIS offering, whilst the body of work produced by the community of QGIS project contributors becomes the basis around which value added resellers build their marketplace offering.

Over the years we have tried to be sensitive to the fact that many people rely on QGIS for their livelihood – initiatives such as our Long Term Release programme, the creation of test suites and heavy investment of donated project funds into bug fixing (among many other similar initiatives) have all gone a long way to making QGIS a viable platform for value added resellers. We would like to ask that resellers give the QGIS project similar consideration in their marketing and work endeavours. As such I would like to present a few simple guidelines below that you should use as guiding principles in your interaction with the QGIS project. I will use a hypothetical company ‘ACME Corp.’ in my examples below:


Respect the license

QGIS is published under the GPL v2 or greater license. The letter of the license states that if you extend the source code  of QGIS, and publish those changes (for example by making it available on a download site for your users), you need to publish the source code changes too, making them available to your users. In the spirit of the license, you should share your improvements to QGIS with the greater project (e.g. by making your code tree publicly accessible).

Similarly when publishing a plugin, don’t ship it with proprietary binary ‘blobs’, or only with .pyc (compiled python files) leaving out the original python sources. If you do absolutely have to ship it with a binary (for example you need a c-compiled python module for your plugin), make sure to provide a clear trail to the upstream sources for those binary elements.

I personally find discussions of licensing get quickly tedious and I prefer to emphasise the spirit of open source rather than getting stuck in legalese: “We share our work with you, you share your work with us and we all benefit“. It’s really that simple for me. When you stray from this maxim, you are very likely to, at best, ruffle feathers and, at worst, create a really bad impression about your company and the people that work for it.


Don’t present your work as our work

It seems obvious, but many miss the nuance here. If you wrote a marvellous plugin to count sheep in farm fields because it will add great value to your customers, call it ‘ACME. Corp sheep counter’, not ‘QGIS Sheep Counter’. Also bear in mind that the word ‘QGIS’ is trademarked (the trademark is owned by the QGIS.org community). If you want to name your project, you should read our trademark guidelines. Contact us at [email protected] if you have any uncertainty about how you are using the word ‘QGIS’ in your brand.

Don’t present our work as your work

This is the corollary to the above. Our community works incredibly hard to make QGIS, the web site, the documentation, triage bugs, provide help on the mailing lists and forums. All that effort can be disregarded in a single line of careless copy like ‘QGIS by ACME Corp. is the next best thing since sliced cheese‘. Show a little love to the people that built the platform for your service offering and refer back to the parent QGIS project and its community as the progenitor of all the goodness you are sharing with your clients. That does not denigrate the valuable service that you provide your customers and it lets them know that you represent your company and work fairly and contribute back to the source project that you are basing your services on.

Friends don’t fork

Forking in Open Source is the process by which you create your own divergent copy of the  software and maintain it independently, often resulting in two incompatible versions (at the source code level) of the same project. Nobody really wins from that. Your customers lose the ability to migrate projects, workflows and knowledge between the community maintained version of QGIS and your modified one. In reality forking is normal (its the standard workflow in GitHub for example), but I really am referring to the process whereby you create an heavily diverged copy of the source code. When you create a divergent fork, your developers get stuck in a one directional highway which takes them further and further away from the original code base and any opportunity to capitalise on the work of other contributors from the QGIS community. There is also an economic imperative not to make a divergent fork – to quote community member Vincent Picavet:

“… forking a project is not a good idea in terms of economics. Maintaining software is more than half of the TCO [Total Cost of Ownership], and on the medium-long term, maintaining a fork of QGIS will cost much more than integrating the specific code into the master codebase, even if initial costs are higher for master integration.”

Don’t rebrand

Every few months I get an email from a value added service provider asking me if I can help them produce a version of QGIS which is rebranded as ‘ACME Corp. GIS’. By rebranding here I mean deep rebranding – not just replacing the splash screen (which I am generally OK with), but changing the word ‘QGIS’ everywhere in the source code and user interface to ‘ACME Corp. GIS’.  Beyond the fact that you instantly break all sorts of things like QGIS project file support, you also create a fork that will require massive amounts of maintenance  to keep in sync with the upstream project.

Integrate your team with the QGIS community

One great way to give your clients a good service and to ensure that your work is well accepted is to integrate your developers with the QGIS community. By that I mean let them subscribe to our mailing lists, participate in architecture and other discussions, fix issues, contribute code, attend our 6 monthly hackfests and generally be part of the ebb and flow of the project. There are so many benefits to doing this – both to QGIS and yourself – which is probably evidenced by the fact that the most well known QGIS value added service providers each have a number of developers participating in the community. My main motivation above all other reasons is that they will gain the sensitivity to know how to get your improvements integrated into the code base, and the trust and camaraderie of the other community members which is great when the time comes that they need help solving problems.


Integrate your work with the QGIS code base

Whereas above we ask you not to fork, how can you be sure your changes will be acceptable so that you do not need to maintain a fork? Whenever you are thinking about new features for your clients, I encourage you to think about how to make them generic enough that they can be incorporated into the main code base. Once you do that, you have an automatic delivery platform of your work to your users. QGIS has a well established release routine and the features shipped with QGIS get tested and used by many thousands of users. Besides you are benefitting from the features others are funding, why not pay the same compliment back by designing your features in a way that everyone can use them, not only your clients?

Keep us in the loop

There is so much going on around the QGIS project we often get surprised by things people do. More often than not it is a pleasant surprise but sometimes it isn’t. If you are planning some big new feature or creating a new service around QGIS, I highly recommend that you share it with the community early in your planning process. In particular for the case of new features that you would like to see in the main code base, coming along with an ACME Corp. 10,000 line code contribution with no prior consultation creates ample room for friction. If you want to know that a larger feature you are planning will be accepted, check out our QEP (QGIS Enhancement Proposal) process.

Don’t only contribute code

For some reason coders are treated as the main heros in the story of an Open Source project. Many people overlook the fact that there is a far larger team of translators, document writers, sys admins, authors, artists, testers and enthusiasts who contribute a massive amount of effort into the project. When you are thinking about how to contribute back to the project, take a moment to think about all the infrastructure around the project and how you might help that along – as well as the cool new features you plan to contribute to the code base.


There are many other things that you can do to integrate yourself into the community, but my real point in this article is that although QGIS is Free Software, it is not made for free. Take a look at the QGIS page on Ohloh if you want to get a feel for just how much effort has gone into QGIS. Many people have put a lot of sweat equity into QGIS and the only reward they get for their work (if they are lucky) is recognition and appreciation. Think of them when you build services on top of QGIS and find ways to acknowledge and motivate them!

Here’s looking forward to seeing many thousands of people making their livelihood by offering services around QGIS!

timsutton

Tim Sutton

(QGIS Project Chair)


  • <<
  • Page 59 of 141 ( 2820 posts )
  • >>

Back to Top

Sustaining Members