Related Plugins and Tags

QGIS Planet

Oslandia is baking some awesome QGIS 3 new features

QGIS 3.0 is now getting closer and closer, it’s the right moment to write about some major refactor and new features we have been baking at Oslandia.

A quick word about the release calendar, you probably felt like QGIS 3 freeze was expected for the end of August, didn’t you?

In fact, we have so many new major changes in the queue that the steering committee (PSC), advised by the core developers, decided to push twice the release date up up to the 27 of October. Release date has not be been pushed (yet).

At Oslandia we got involved in a dark list of hidden features of QGIS3.

They mostly aren’t easy to advertised visually, but you’ll appreciate them for sure!

  • Add  capabilities to store data in the project
    • add a new .qgz zipped file format container
    • have editable joins, with upsert capabilities (Insert Or Update)
    • Transparently store  and maintain in sync data in a sqlite database. Now custom labeling is pretty easy!
  • Coordinating work and tests on new node tool for data editing
  • Improving Z / m handling in edit tools and layer creation dialogs
  • Ticket reviewing and cleaning

Next articles will describe some of those tasks soon.

This work was a great opportunity to ramp up a new talented developer with commit rights on the repository! Welcome and congratulations to Paul our new core committer !

All this was possible with the support of many actors, but also thanks to the fundings of QGIS.org via Grant Applications or direct funding of QGIS server!

A last word, please help us in testing QGIS3, it’s the perfect moment to stress it, bugfix period is about to start !


Refresh your maps FROM postgreSQL !

Continuing our love story with PostgreSQL and QGIS, we asked QGIS.org a grant application during early 2017 spring.

The idea was to take benefit of very advanced PostgreSQL features, that probably never were used in a Desktop GIS client before.

Today, let’s see what we can do with the PostgreSQL NOTIFY feature!

Ever dreamt of being able to trigger things from outside QGIS? Ever wanted a magic stick to trigger actions in some clients from a database action?

X All The Y Meme | REFRESH QGIS FROM THE DATABASE !!! | image tagged in memes,x all the y | made w/ Imgflip meme maker


NOTIFY is a PostgreSQL specific feature allowing to generate notifications on a channel and optionally send a message — a payload in PG’s dialect .

In short, from within a transaction, we can raise a signal in a PostgreSQL queue and listen to it from a client.

In action

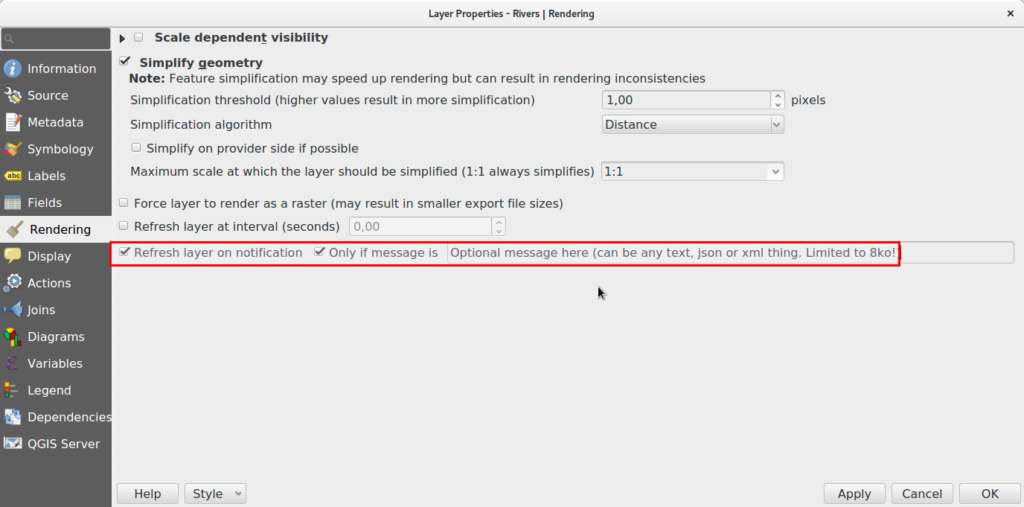
We hardcoded a channel named “qgis” and made QGIS able to LISTEN to NOTIFY events and transform them into Qt’s signals. The signals are connected to layer refresh when you switch on this rendering option.

Optionnally, adding a message filter will only redraw the layer for some specific events.

This mechanism is really versatile and we now can imagine many possibilities, maybe like trigger a notification message to your users from the database, interact with plugins, or even code a chat between users of the same database  (ok, this is stupid) !


More than just refresh layers?

The first implementation we chose was to trigger a layer refresh because we believe this is a good way for users to discover this new feature.

But QGIS rocks hey, doing crazy things for limited uses is not the way.

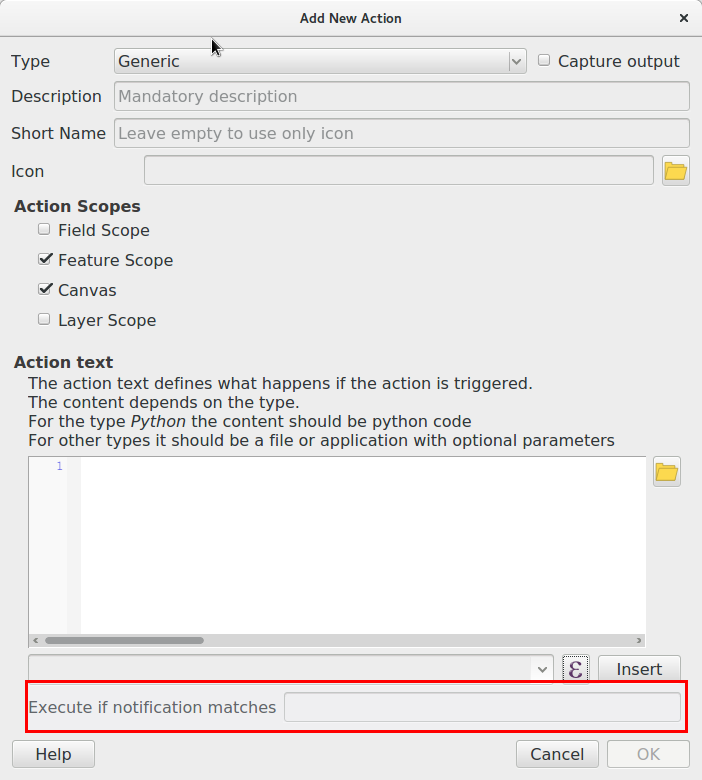
Thanks to feedback on the Pull Request, we added the possibility to trigger layer actions on notification.

That should be pretty versatile since you can do almost anything with those actions now.

Caveats

QGIS will open a permanent connection to PostgreSQL to watch the notify signals. Please keep that in mind if you have several clients and a limited number of connections.

Notify signals are only transmitted with the transaction, so when the COMMIT is raised. So be aware that this might not help you if users are inside an edit session.

QGIS has a lot of different caches, for attribute table for instance. We currently have no specific way to invalidate a specific cache, and then order QGIS to refresh it’s attribute table.

There is no way in PG to list all channels of a database session, that’s why we couldn’t propose a combobox list of available signals in the renderer option dialog. Anyway, to avoid too many issues, we decided to hardcode the channel name in QGIS with the name “qgis”. If this is somehow not enough for your needs, please contact us!

Conclusion

The github pull request is here : https://github.com/qgis/QGIS/pull/5179

We are convinced this would be really useful for real time application, let us know if that makes some bells ring on your side!

More to come soon, stay tuned!


Undo Redo stack is back QGIS Transaction groups

Let’s keep on looking at what we did in QGIS.org grant application of early 2017 spring.

At Oslandia, we use a lot the transaction groups option of QGIS. It was an experimental feature in QGIS 2.X allowing to open only one common Postgres transaction for all layers sharing the same connection string.

Transaction group option

When activated, that option will bring many killer features:

  • Users can switch all the layers in edit mode at once. A real time saver.
  • Every INSERT, UPDATE or DELETE is forwarded immediately to the database, which is nice for:
    • Evaluating on the fly if database constraints are satisfied or not. Without transaction groups this is only done when saving the edits and this can be frustrating to create dozens of features and having one of them rejected because of a foreign key constraint…
    • Having triggers evaluated on the fly.  QGIS is so powerful when dealing with “thick database” concepts that I would never go back to a pure GIS ignoring how powerful databases can be !
    • Playing with QgsTransaction.ExecuteSQL allows to trigger stored procedures in PostgreSQL in a beautiful API style interface. Something like
SELECT invert_pipe_direction('pipe1');
  • However, the implementation was flagged “experimental” because some caveats where still causing issues:
    • Committing on the fly was breaking the logic of the undo/redo stack. So there was no way to do a local edit. No Ctrl+Z!  The only way to rollback was to stop the edit session and loose all the work. Ouch.. Bad!
    • Playing with ExecuteSQL did not dirty the QGIS edit buffer. So, if during an edit session no edit action was made using QGIS native tools, there was no clean way to activate the “save edits” icon.
    • When having some failures in the triggers, QGIS may loose DB connection and thus create a silent ROLLBACK.

We decided to try to restore the undo/redo stack by saving the history edits in PostgreSQL SAVEPOINTS and see if we could restore the original feature in QGIS.

And.. it worked!

Let’s see that in action:


Potential caveats ?

At start, we worried about how heavy all those savepoints would be for the database. It turns out that maybe for really massive geometries, and heavy editing sessions, this could start to weight a bit, but honestly far away from PostgreSQL capabilities.


Up to now, we didn’t really find any issue with that..

And we didn’t address the silent ROLLBACK that occurs sometimes, because it is generated by buggy stored procedures, easy to solve.

Some new ideas came to us when working in that area. For instance, if a transaction locks a feature, QGIS just… wait for the lock to be released. I think we should find a way to advertise those locks to the users, that would be great! If you’re interested in making that happen, please contact us.


More to come soon, stay tuned!


Drive-time Isochrones from a single Shapefile using QGIS, PostGIS, and Pgrouting

This is a guest post by Chris Kohler .

Introduction:

This guide provides step-by-step instructions to produce drive-time isochrones using a single vector shapefile. The method described here involves building a routing network using a single vector shapefile of your roads data within a Virtual Box. Furthermore, the network is built by creating start and end nodes (source and target nodes) on each road segment. We will use Postgresql, with PostGIS and Pgrouting extensions, as our database. Please consider this type of routing to be fair, regarding accuracy, as the routing algorithms are based off the nodes locations and not specific addresses. I am currently working on an improved workflow to have site address points serve as nodes to optimize results. One of the many benefits of this workflow is no financial cost to produce (outside collecting your roads data). I will provide instructions for creating, and using your virtual machine within this guide.

Steps:–Getting Virtual Box(begin)–

Intro 1. Download/Install Oracle VM(https://www.virtualbox.org/wiki/Downloads)

Intro 2. Start the download/install OSGeo-Live 11(https://live.osgeo.org/en/overview/overview.html).

Pictures used in this workflow will show 10.5, though version 11 can be applied similarly. Make sure you download the version: osgeo-live-11-amd64.iso. If you have trouble finding it, here is the direct link to the download (https://sourceforge.net/projects/osgeo-live/files/10.5/osgeo-live-10.5-amd64.iso/download)
Intro 3. Ready for virtual machine creation: We will utilize the downloaded OSGeo-Live 11 suite with a virtual machine we create to begin our workflow. The steps to create your virtual machine are listed below. Also, here are steps from an earlier workshop with additional details with setting up your virtual machine with osgeo live(http://workshop.pgrouting.org/2.2.10/en/chapters/installation.html).

1.  Create Virutal Machine: In this step we begin creating the virtual machine housing our database.

Open Oracle VM VirtualBox Manager and select “New” located at the top left of the window.

VBstep1

Then fill out name, operating system, memory, etc. to create your first VM.

vbstep1.2

2. Add IDE Controller:  The purpose of this step is to create a placeholder for the osgeo 11 suite to be implemented. In the virtual box main window, right-click your newly-created vm and open the settings.

vbstep2

In the settings window, on the left side select the storage tab.

Find “adds new storage controller button located at the bottom of the tab. Be careful of other buttons labeled “adds new storage attachment”! Select “adds new storage controller button and a drop-down menu will appear. From the top of the drop-down select “Add IDE Controller”.

vbstep2.2

vbstep2.3

You will see a new item appear in the center of the window under the “Storage Tree”.

3.  Add Optical Drive: The osgeo 11 suite will be implemented into the virtual machine via an optical drive. Highlight the new controller IDE you created and select “add optical drive”.

vbstep3

A new window will pop-up and select “Choose Disk”.

vbstep3.2

Locate your downloaded file “osgeo-live 11 amd64.iso” and click open. A new object should appear in the middle window under your new controller displaying “osgeo-live-11.0-amd64.iso”.

vbstep3.3

Finally your virtual machine is ready for use.
Start your new Virtual Box, then wait and follow the onscreen prompts to begin using your virtual machine.
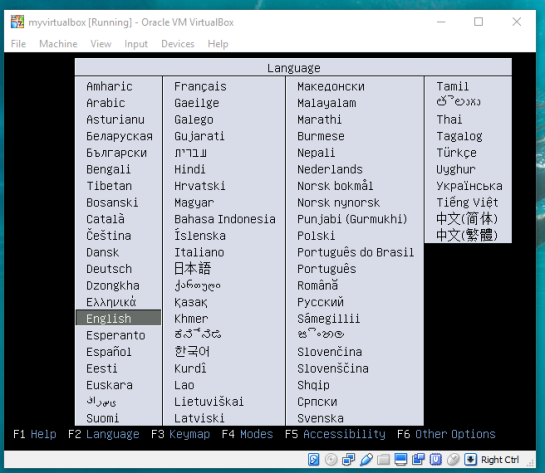
vbstep3.4

–Getting Virtual Box(end)—

4. Creating the routing database, and both extensions (postgis, pgrouting): The database we create and both extensions we add will provide the functions capable of producing isochrones.

To begin, start by opening the command line tool (hold control+left-alt+T) then log in to postgresql by typing “psql -U user;” into the command line and then press Enter. For the purpose of clear instruction I will refer to database name in this guide as “routing”, feel free to choose your own database name. Please input the command, seen in the figure below, to create the database:

CREATE DATABASE routing;

You can use “\c routing” to connect to the database after creation.

step4

The next step after creating and connecting to your new database is to create both extensions. I find it easier to take two-birds-with-one-stone typing “psql -U user routing;” this will simultaneously log you into postgresql and your routing database.

When your logged into your database, apply the commands below to add both extensions

CREATE EXTENSION postgis;
CREATE EXTENSION pgrouting;
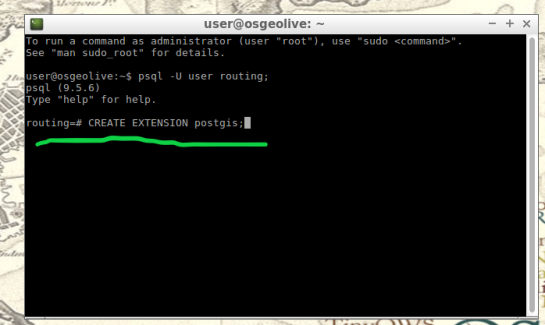
step4.2

step4.3

5. Load shapefile to database: In this next step, the shapefile of your roads data must be placed into your virtual machine and further into your database.

My method is using email to send myself the roads shapefile then download and copy it from within my virtual machines web browser. From the desktop of your Virtual Machine, open the folder named “Databases” and select the application “shape2pgsql”.

step5

Follow the UI of shp2pgsql to connect to your routing database you created in Step 4.

step5.2

Next, select “Add File” and find your roads shapefile (in this guide we will call our shapefile “roads_table”) you want to use for your isochrones and click Open.

step5.3

Finally, click “Import” to place your shapefile into your routing database.

6. Add source & target columns: The purpose of this step is to create columns which will serve as placeholders for our nodes data we create later.

There are multiple ways to add these columns into the roads_table. The most important part of this step is which table you choose to edit, the names of the columns you create, and the format of the columns. Take time to ensure the source & target columns are integer format. Below are the commands used in your command line for these functions.

ALTER TABLE roads_table ADD COLUMN "source" integer;
ALTER TABLE roads_table ADD COLUMN "target" integer;

step6

step6.2

7. Create topology: Next, we will use a function to attach a node to each end of every road segment in the roads_table. The function in this step will create these nodes. These newly-created nodes will be stored in the source and target columns we created earlier in step 6.

As well as creating nodes, this function will also create a new table which will contain all these nodes. The suffix “_vertices_pgr” is added to the name of your shapefile to create this new table. For example, using our guide’s shapefile name , “roads_table”, the nodes table will be named accordingly: roads_table_vertices_pgr. However, we will not use the new table created from this function (roads_table_vertices_pgr). Below is the function, and a second simplified version, to be used in the command line for populating our source and target columns, in other words creating our network topology. Note the input format, the “geom” column in my case was called “the_geom” within my shapefile:

pgr_createTopology('roads_table', 0.001, 'geom', 'id',
 'source', 'target', rows_where := 'true', clean := f)

step7

Here is a direct link for more information on this function: http://docs.pgrouting.org/2.3/en/src/topology/doc/pgr_createTopology.html#pgr-create-topology

Below is an example(simplified) function for my roads shapefile:

SELECT pgr_createTopology('roads_table', 0.001, 'the_geom', 'id')

8. Create a second nodes table: A second nodes table will be created for later use. This second node table will contain the node data generated from pgr_createtopology function and be named “node”. Below is the command function for this process. Fill in your appropriate source and target fields following the manner seen in the command below, as well as your shapefile name.

To begin, find the folder on the Virtual Machines desktop named “Databases” and open the program “pgAdmin lll” located within.

step8

Connect to your routing database in pgAdmin window. Then highlight your routing database, and find “SQL” tool at the top of the pgAdmin window. The tool resembles a small magnifying glass.
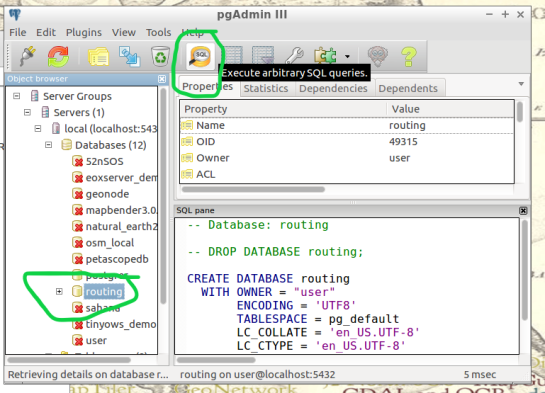
step8.2

We input the below function into the SQL window of pgAdmin. Feel free to refer to this link for further information: (https://anitagraser.com/2011/02/07/a-beginners-guide-to-pgrouting/)

CREATE TABLE node AS
   SELECT row_number() OVER (ORDER BY foo.p)::integer AS id,
          foo.p AS the_geom
   FROM (     
      SELECT DISTINCT roads_table.source AS p FROM roads_table
      UNION
      SELECT DISTINCT roads_table.target AS p FROM roads_table
   ) foo
   GROUP BY foo.p;

step8.3

  1.  Create a routable network: After creating the second node table from step 8,  we will combine this node table(node) with our shapefile(roads_table) into one, new, table(network) that will be used as the routing network. This table will be called “network” and will be capable of processing routing queries.  Please input this command and execute in SQL pgAdmin tool as we did in step 8. Here is a reference for more information:(https://anitagraser.com/2011/02/07/a-beginners-guide-to-pgrouting/)   

step8.2


CREATE TABLE network AS
   SELECT a.*, b.id as start_id, c.id as end_id
   FROM roads_table AS a
      JOIN node AS b ON a.source = b.the_geom
      JOIN node AS c ON a.target = c.the_geom;
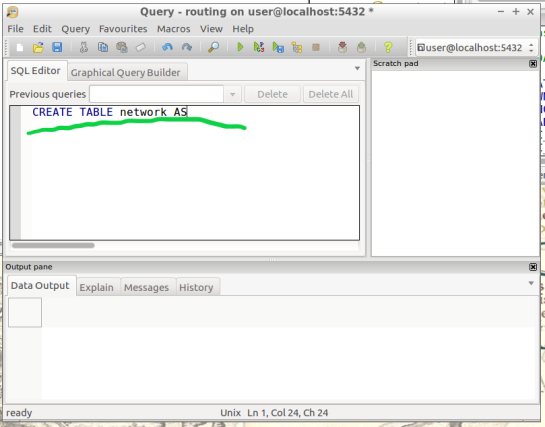
step9.2

10. Create a “noded” view of the network:  This new view will later be used to calculate the visual isochrones in later steps. Input this command and execute in SQL pgAdmin tool.

CREATE OR REPLACE VIEW network_nodes AS 
SELECT foo.id,
 st_centroid(st_collect(foo.pt)) AS geom 
FROM ( 
  SELECT network.source AS id,
         st_geometryn (st_multi(network.geom),1) AS pt 
  FROM network
  UNION 
  SELECT network.target AS id, 
         st_boundary(st_multi(network.geom)) AS pt 
  FROM network) foo 
GROUP BY foo.id;

step10

11.​ Add column for speed:​ This step may, or may not, apply if your original shapefile contained a field of values for road speeds.

In reality a network of roads will typically contain multiple speed limits. The shapefile you choose may have a speed field, otherwise the discrimination for the following steps will not allow varying speeds to be applied to your routing network respectfully.

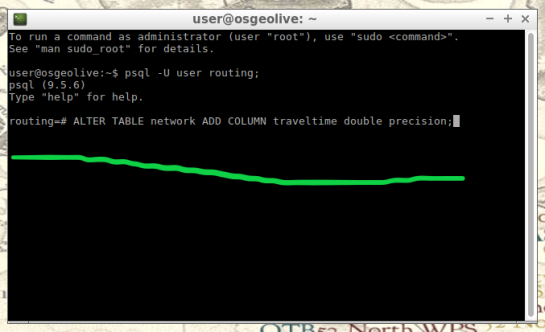
If values of speed exists in your shapefile we will implement these values into a new field, “traveltime“, that will show rate of travel for every road segment in our network based off their geometry. Firstly, we will need to create a column to store individual traveling speeds. The name of our column will be “traveltime” using the format: ​double precision.​ Input this command and execute in the command line tool as seen below.

ALTER TABLE network ADD COLUMN traveltime double precision;
step11

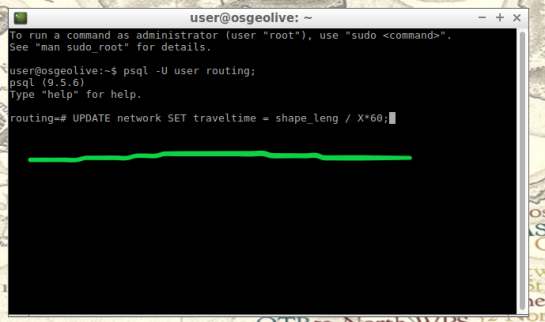
Next, we will populate the new column “traveltime” by calculating traveling speeds using an equation. This equation will take each road segments geometry(shape_leng) and divide by the rate of travel(either mph or kph). The sample command I’m using below utilizes mph as the rate while our geometry(shape_leng) units for my roads_table is in feet​. If you are using either mph or kph, input this command and execute in SQL pgAdmin tool. Below further details explain the variable “X”.

UPDATE network SET traveltime = shape_leng / X*60
step11.2

How to find X​, ​here is an example​: Using example 30 mph as rate. To find X, we convert 30 miles to feet, we know 5280 ft = 1 mile, so we multiply 30 by 5280 and this gives us 158400 ft. Our rate has been converted from 30 miles per hour to 158400 feet per hour. For a rate of 30 mph, our equation for the field “traveltime”  equates to “shape_leng / 158400*60″. To discriminate this calculations output, we will insert additional details such as “where speed = 30;”. What this additional detail does is apply our calculated output to features with a “30” value in our “speed” field. Note: your “speed” field may be named differently.

UPDATE network SET traveltime = shape_leng / 158400*60 where speed = 30;

Repeat this step for each speed value in your shapefile examples:

UPDATE network SET traveltime = shape_leng / X*60 where speed = 45;
UPDATE network SET traveltime = shape_leng / X*60 where speed = 55;

The back end is done. Great Job!

Our next step will be visualizing our data in QGIS. Open and connect QGIS to your routing database by right-clicking “PostGIS” in the Browser Panel within QGIS main window. Confirm the checkbox “Also list tables with no geometry” is checked to allow you to see the interior of your database more clearly. Fill out the name or your routing database and click “OK”.

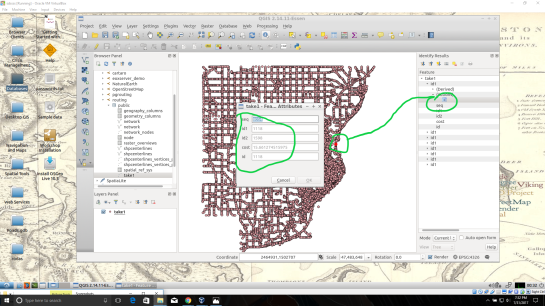
If done correctly, from QGIS you will have access to tables and views created in your routing database. Feel free to visualize your network by drag-and-drop the network table into your QGIS Layers Panel. From here you can use the identify tool to select each road segment, and see the source and target nodes contained within that road segment. The node you choose will be used in the next step to create the views of drive-time.

12.Create views​: In this step, we create views from a function designed to determine the travel time cost. Transforming these views with tools will visualize the travel time costs as isochrones.

The command below will be how you start querying your database to create drive-time isochrones. Begin in QGIS by draging your network table into the contents. The visual will show your network as vector(lines). Simply select the road segment closest to your point of interest you would like to build your isochrone around. Then identify the road segment using the identify tool and locate the source and target fields.

step12

step12.2

Place the source or target field value in the below command where you see ​VALUE​, in all caps​.

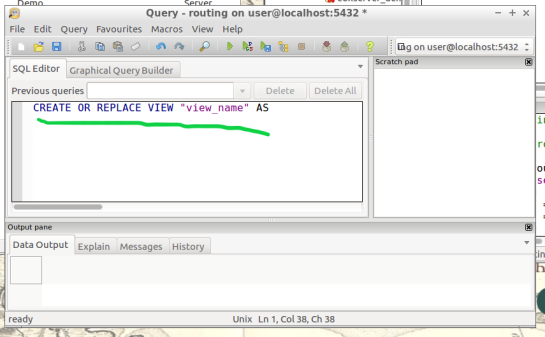
This will serve you now as an isochrone catchment function for this workflow. Please feel free to use this command repeatedly for creating new isochrones by substituting the source value. Please input this command and execute in SQL pgAdmin tool.

*AT THE BOTTOM OF THIS WORKFLOW I PROVIDED AN EXAMPLE USING SOURCE VALUE “2022”

CREATE OR REPLACE VIEW "​view_name" AS 
SELECT di.seq, 
       di.id1, 
       di.id2, 
       di.cost, 
       pt.id, 
       pt.geom 
FROM pgr_drivingdistance('SELECT
     gid::integer AS id, 
     Source::integer AS source, 
     Target::integer AS target,                                    
     Traveltime::double precision AS cost 
       FROM network'::text, ​VALUE::bigint, 
    100000::double precision, false, false)
    di(seq, id1, id2, cost)
JOIN network_nodes pt ON di.id1 = pt.id;
step12.3

13.Visualize Isochrone: Applying tools to the view will allow us to adjust the visual aspect to a more suitable isochrone overlay.

​After creating your view, a new item in your routing database is created, using the “view_name” you chose. Drag-and-drop this item into your QGIS LayersPanel. You will see lots of small dots which represent the nodes.

In the figure below, I named my view “take1“.

step13

Each node you see contains a drive-time value, “cost”, which represents the time used to travel from the node you input in step 12’s function.
step13.2

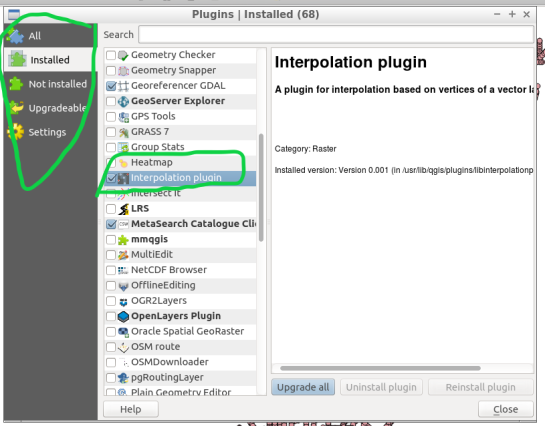
Start by installing the QGIS plug-in Interpolation” by opening the Plugin Manager in QGIS interface.
step13.3

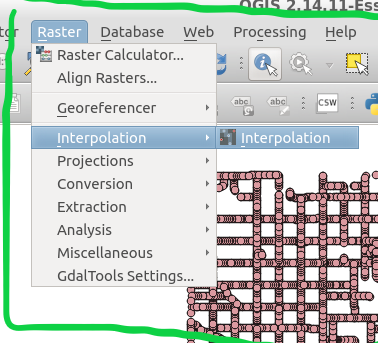
Next, at the top of QGIS window select “Raster” and a drop-down will appear, select “Interpolation”.
step13.4


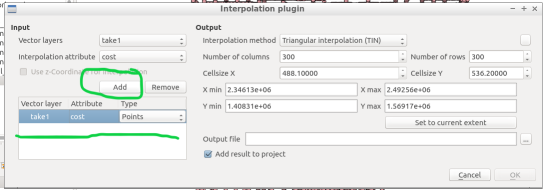
A new window pops up and asks you for input.

step13.5

Select your “​view”​ as the​ vector layer​, select ​”cost​” as your ​interpolation attribute​, and then click “Add”.

step13.6

A new vector layer will show up in the bottom of the window, take care the type is Points. For output, on the other half of the window, keep the interpolation method as “TIN”, edit the ​output file​ location and name. Check the box “​Add result to project​”.

Note: decreasing the cellsize of X and Y will increase the resolution but at the cost of performance.

Click “OK” on the bottom right of the window.

step13.7

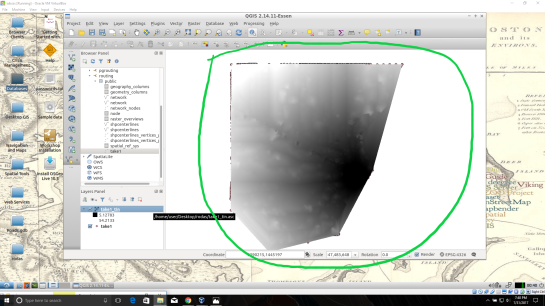
A black and white raster will appear in QGIS, also in the Layers Panel a new item was created.
step13.8

Take some time to visualize the raster by coloring and adjusting values in symbology until you are comfortable with the look.

step13.9

step13.10

14. ​Create contours of our isochrone:​ Contours can be calculated from the isochrone as well.

Find near the top of QGIS window, open the “Raster” menu drop-down and select Extraction → Contour.

step14

Fill out the appropriate interval between contour lines but leave the check box “Attribute name” unchecked. Click “OK”.

step14.2

step14.3

15.​ Zip and Share:​ Find where you saved your TIN and contours, compress them in a zip folder by highlighting them both and right-click to select “compress”. Email the compressed folder to yourself to export out of your virtual machine.

Example Isochrone catchment for this workflow:

CREATE OR REPLACE VIEW "2022" AS 
SELECT di.seq, Di.id1, Di.id2, Di.cost,                           
       Pt.id, Pt.geom 
FROM pgr_drivingdistance('SELECT gid::integer AS id,                                       
     Source::integer AS source, Target::integer AS target, 
     Traveltime::double precision AS cost FROM network'::text, 
     2022::bigint, 100000::double precision, false, false) 
   di(seq, id1, id2, cost) 
JOIN netowrk_nodes pt 
ON di.id1 = pt.id;

References: Virtual Box ORACLE VM, OSGeo-Live 11  amd64 iso, Workshop FOSS4G Bonn(​http://workshop.pgrouting.org/2.2.10/en/index.html​),

Do you want to host a QGIS developer meeting?

Each year the QGIS.ORG community holds two developer meetings. These events are an important part of  our project – they provide an invaluable opportunity for us all to meet face to face and share ideas, discuss issues and plan the future of QGIS.

The host of the developer meeting gets a special bonus for hosting the meeting: One of our releases will be named after the town / village / city etc. where the event was held – like this:

Screen Shot 2017-09-02 at 11.11.31 PM.png

We want to have a better idea of which venues we will be using for future events to help with out planning. So I am putting out a call for venue proposals:

If you would like to host a QGIS developer meeting (estimated 50 people per event) or a QGIS Conference (estimated 100-150 people per event) please contact us!

Please don’t submit proposals unless you have the authority to make such a proposal and are willing to act as the local organiser for the event. To make a proposal, fill out this form and tell us about your great venue!


Adding ESRI’s World Hillshade layer to QGIS

You may have seen my earlier tutorial where I described how to make nice looking hillshaded maps in QGIS using SRTM elevation data. Well, we don’t have to stop with just one hillshade layer on a map, it is possible to overlay multiple hillshades; a procedure that can increase the visual quality and detail. The following image is the hillshade we made before. Once you re-create a hillshade, following the previous tutorial, you can head to the next step (note that brightness and contrast settings may be different due to changes in how QGIS generates and displays hillshades).

We can improve the SRTM hillshade further by adding ESRI’s World Hillshade layer, which uses multi-directional illumination (also called a Swiss Hillshade in tribute to the celebrated Swiss cartographer Eduard Imhof). In addition, World Hillshade has a much higher resolution than SRTM 30m data in some regions of the world, it is 2m for most of the England and Wales, 10m for most of the US, 5m for Spain and 3m for Holland etc. The only drawback is that the style of this layer is somewhat controversial, some love it, some hate it, it looks like it’s illuminated from above, but mixing it with the SRTM hillshade obviates some of it criticised flaws.

To add the World Hillshade layer in QGIS go to the Layer Menu – Add Layer – Add ArcGIS MapServer Layer – click New and add the following URL:

https://services.arcgisonline.com/arcgis/rest/services/Elevation/World_Hillshade/MapServer

Notice QGIS 2.18 no longer needs a plugin to add ESRI layers, it new has this functionality built in. Also, open the url in a browser such as Firefox, it brings up a webpage that describes the layer. We also see links to other other layers. Yes, they can all be added to QGIS by simply taking the URL of the webpage that describe the layer and connecting to it via the ArcGIS MapServer Layer connector.

Name the layer World Hillshade and click Connect, then click and highlight the layer it connects to. Finally, click the Add button to add the layer to the canvas.

Next, we need to adjust the properties of the World Hillshade layer to properly overlay it above the SRTM hillshade layer. Make sure the World hillshade layer is the topmost layer. In the Layers Panel, right click Layer properties and in the window that opens up, click Style (if not visible). Next, change the Layer Blending mode (under color rendering) to Overlay. Adjust the layer’s brightness to around -20 and leave contrast at 0. If you find the scene is still too dark, brighten the SRTM Hillshade by increasing the layer’s brightness. You may also have to change (lower) the Min value of the Min – Max value boxes. Leave the contrast at 0 for the SRTM hillshade. Also, don’t brighten it too much as it might become washed out, loose detail, especially in bright areas. Play around the controls, settings may vary depending on the SRTM data you download and the version of QGIS you use.

Here’s a comparison in Ireland, a ring like structure of hills with a central peak. No, it’s not a meteorite crater. It’s a different kind of geological marvel, the Slieve Gullion Complex and its ring dyke; the deeply eroded remains of a 410 million year old Caledonian volcano. The SRTM hillshade is on the left and World Hillshade + SRTM hillshade is on the right (click on the image, it’s best appreciated full size):

We can see the World Hillshade + SRTM Hillshade layer shows much finer detail. We see a parallel array of roughly north-south orientated lines, these are fractures and faults that cut the Slieve Gullion Complex that were perhaps enhanced by glacial erosion. Also, look carefully, there seems to be some roads meandering across the landscape (hint, bottom of the map and right of the scale bar). You should get even better results with higher resolution World Hillshade data. We also notice that bending SRTM derived hillshade with World Hillshade adds a naturalistic illumination not apparent in multi-directional hillshading. So we have the best of both worlds, a high resolution hillshade and realistic looking illumination.

Hope you found this tutorial helpful.

References:

Baxter, S., 2008. A Geological Field Guide to Cooley Gullion, Mourne & Slieve Croob [pdf]. Geological Survey of Ireland, Dublin. p. 43-53.

Imhof, E. 1982. Cartographic Relief Presentation. Walter de Gruyter GmbH & Co KG.

blog:i_spotkanie_uzytkownikow_qgis

Zapraszamy na I spotkanie użytkowników QGIS. Mamy nadzieję, że każdy znajdzie coś dla siebie - zarówno osoby zaczynające przygodę z systemami informacji przestrzennej, jak i programiści zajmujący się zawodowo geoinformacją. Postaramy się zaprezentować praktyczne zagadnienia związane z wykorzystaniem programu QGIS oraz przedstawić nowości z wersji 3, która pojawi się niebawem. Jeśli w swojej pracy wykorzystujesz QGIS - ta impreza jest dla Ciebie!

Fixing invalid polygon geometries

Invalid geometries can cause a lot of headache: from missing features to odd analysis results.

This post aims to illustrate one of the most common issues and presents an approach that can help with these errors.

The dataset used for this example is the Alaska Shapefile from the QGIS sample data:

This dataset has a couple of issues. One way to find out if a dataset contains errors is the Check Validity tool in the Processing toolbox:

If there are errors, a layer called Error output will be loaded. In our case, there are multiple issues:

If we try to use this dataset for spatial analysis, there will likely be errors. For example, using the Fixed distance buffer tool results in missing features:

Note the errors in the Processing log message panel:

Feature ### has invalid geometry. Skipping ...

So what can we do?

In my experience, GRASS can work wonders for fixing these kind of issues. The idea is to run v.buffer.distance with the distance set to zero:

This will import the dataset into GRASS and run the buffer algorithm without actually growing the polygons. Finally, it should export a fixed version of the geometries:

A quick validity check with the Check validity tool confirms that there are no issues left.


Getting started with GeoMesa using Geodocker

In a previous post, I showed how to use docker to run a single application (GeoServer) in a container and connect to it from your local QGIS install. Today’s post is about running a whole bunch of containers that interact with each other. More specifically, I’m using the images provided by Geodocker. The Geodocker repository provides a setup containing Accumulo, GeoMesa, and GeoServer. If you are not familiar with GeoMesa yet:

GeoMesa is an open-source, distributed, spatio-temporal database built on a number of distributed cloud data storage systems … GeoMesa aims to provide as much of the spatial querying and data manipulation to Accumulo as PostGIS does to Postgres.

The following sections show how to load data into GeoMesa, perform basic queries via command line, and finally publish data to GeoServer. The content is based largely on two GeoMesa tutorials: Geodocker: Bootstrapping GeoMesa Accumulo and Spark on AWS and Map-Reduce Ingest of GDELT, as well as Diethard Steiner’s post on Accumulo basics. The key difference is that this tutorial is written to be run locally (rather than on AWS or similar infrastructure) and that it spells out all user names and passwords preconfigured in Geodocker.

This guide was tested on Ubuntu and assumes that Docker is already installed. If you haven’t yet, you can install Docker as described in Install using the repository.

To get Geodocker set up, we need to get the code from Github and run the docker-compose command:

$ git clone https://github.com/geodocker/geodocker-geomesa.git
$ cd geodocker-geomesa/geodocker-accumulo-geomesa/
$ docker-compose up

This will take a while.

When docker-compose is finished, use a second console to check the status of all containers:

$ docker ps
CONTAINER ID        IMAGE                                     COMMAND                  CREATED             STATUS              PORTS                                        NAMES
4a238494e15f        quay.io/geomesa/accumulo-geomesa:latest   "/sbin/entrypoint...."   19 hours ago        Up 23 seconds                                                    geodockeraccumulogeomesa_accumulo-tserver_1
e2e0df3cae98        quay.io/geomesa/accumulo-geomesa:latest   "/sbin/entrypoint...."   19 hours ago        Up 22 seconds       0.0.0.0:50095->50095/tcp                     geodockeraccumulogeomesa_accumulo-monitor_1
e7056f552ef0        quay.io/geomesa/accumulo-geomesa:latest   "/sbin/entrypoint...."   19 hours ago        Up 24 seconds                                                    geodockeraccumulogeomesa_accumulo-master_1
dbc0ffa6c39c        quay.io/geomesa/hdfs:latest               "/sbin/entrypoint...."   19 hours ago        Up 23 seconds                                                    geodockeraccumulogeomesa_hdfs-data_1
20e90a847c5b        quay.io/geomesa/zookeeper:latest          "/sbin/entrypoint...."   19 hours ago        Up 24 seconds       2888/tcp, 0.0.0.0:2181->2181/tcp, 3888/tcp   geodockeraccumulogeomesa_zookeeper_1
997b0e5d6699        quay.io/geomesa/geoserver:latest          "/opt/tomcat/bin/c..."   19 hours ago        Up 22 seconds       0.0.0.0:9090->9090/tcp                       geodockeraccumulogeomesa_geoserver_1
c17e149cda50        quay.io/geomesa/hdfs:latest               "/sbin/entrypoint...."   19 hours ago        Up 23 seconds       0.0.0.0:50070->50070/tcp                     geodockeraccumulogeomesa_hdfs-name_1

At the time of writing this post, the Geomesa version installed in this way is 1.3.2:

$ docker exec geodockeraccumulogeomesa_accumulo-master_1 geomesa version
GeoMesa tools version: 1.3.2
Commit ID: 2b66489e3d1dbe9464a9860925cca745198c637c
Branch: 2b66489e3d1dbe9464a9860925cca745198c637c
Build date: 2017-07-21T19:56:41+0000

Loading data

First we need to get some data. The available tutorials often refer to data published by the GDELT project. Let’s download data for three days, unzip it and copy it to the geodockeraccumulogeomesa_accumulo-master_1 container for further processing:

$ wget http://data.gdeltproject.org/events/20170710.export.CSV.zip
$ wget http://data.gdeltproject.org/events/20170711.export.CSV.zip
$ wget http://data.gdeltproject.org/events/20170712.export.CSV.zip
$ unzip 20170710.export.CSV.zip
$ unzip 20170711.export.CSV.zip
$ unzip 20170712.export.CSV.zip
$ docker cp ~/Downloads/geomesa/gdelt/20170710.export.CSV geodockeraccumulogeomesa_accumulo-master_1:/tmp/20170710.export.CSV
$ docker cp ~/Downloads/geomesa/gdelt/20170711.export.CSV geodockeraccumulogeomesa_accumulo-master_1:/tmp/20170711.export.CSV
$ docker cp ~/Downloads/geomesa/gdelt/20170712.export.CSV geodockeraccumulogeomesa_accumulo-master_1:/tmp/20170712.export.CSV

Loading or importing data is called “ingesting” in Geomesa parlance. Since the format of GDELT data is already predefined (the CSV mapping is defined in geomesa-tools/conf/sfts/gdelt/reference.conf), we can ingest the data:

$ docker exec geodockeraccumulogeomesa_accumulo-master_1 geomesa ingest -c geomesa.gdelt -C gdelt -f gdelt -s gdelt -u root -p GisPwd /tmp/20170710.export.CSV
$ docker exec geodockeraccumulogeomesa_accumulo-master_1 geomesa ingest -c geomesa.gdelt -C gdelt -f gdelt -s gdelt -u root -p GisPwd /tmp/20170711.export.CSV
$ docker exec geodockeraccumulogeomesa_accumulo-master_1 geomesa ingest -c geomesa.gdelt -C gdelt -f gdelt -s gdelt -u root -p GisPwd /tmp/20170712.export.CSV

Once the data is ingested, we can have a look at the the created table by asking GeoMesa to describe the created schema:

$ docker exec geodockeraccumulogeomesa_accumulo-master_1 geomesa describe-schema -c geomesa.gdelt -f gdelt -u root -p GisPwd
INFO  Describing attributes of feature 'gdelt'
globalEventId       | String
eventCode           | String
eventBaseCode       | String
eventRootCode       | String
isRootEvent         | Integer
actor1Name          | String
actor1Code          | String
actor1CountryCode   | String
actor1GroupCode     | String
actor1EthnicCode    | String
actor1Religion1Code | String
actor1Religion2Code | String
actor2Name          | String
actor2Code          | String
actor2CountryCode   | String
actor2GroupCode     | String
actor2EthnicCode    | String
actor2Religion1Code | String
actor2Religion2Code | String
quadClass           | Integer
goldsteinScale      | Double
numMentions         | Integer
numSources          | Integer
numArticles         | Integer
avgTone             | Double
dtg                 | Date    (Spatio-temporally indexed)
geom                | Point   (Spatially indexed)

User data:
  geomesa.index.dtg     | dtg
  geomesa.indices       | z3:4:3,z2:3:3,records:2:3
  geomesa.table.sharing | false

In the background, our data is stored in Accumulo tables. For a closer look, open an interactive terminal in the Accumulo master image:

$ docker exec -i -t geodockeraccumulogeomesa_accumulo-master_1 /bin/bash

and open the Accumulo shell:

# accumulo shell -u root -p GisPwd

When we store data in GeoMesa, there is not only one table but several. Each table has a specific purpose: storing metadata, records, or indexes. All tables get prefixed with the catalog table name:

root@accumulo> tables
accumulo.metadata
accumulo.replication
accumulo.root
geomesa.gdelt
geomesa.gdelt_gdelt_records_v2
geomesa.gdelt_gdelt_z2_v3
geomesa.gdelt_gdelt_z3_v4
geomesa.gdelt_queries
geomesa.gdelt_stats

By default, GeoMesa creates three indices:
Z2: for queries with a spatial component but no temporal component.
Z3: for queries with both a spatial and temporal component.
Record: for queries by feature ID.

But let’s get back to GeoMesa …

Querying data

Now we are ready to query the data. Let’s perform a simple attribute query first. Make sure that you are in the interactive terminal in the Accumulo master image:

$ docker exec -i -t geodockeraccumulogeomesa_accumulo-master_1 /bin/bash

This query filters for a certain event id:

# geomesa export -c geomesa.gdelt -f gdelt -u root -p GisPwd -q "globalEventId='671867776'"
Using GEOMESA_ACCUMULO_HOME = /opt/geomesa
id,globalEventId:String,eventCode:String,eventBaseCode:String,eventRootCode:String,isRootEvent:Integer,actor1Name:String,actor1Code:String,actor1CountryCode:String,actor1GroupCode:String,actor1EthnicCode:String,actor1Religion1Code:String,actor1Religion2Code:String,actor2Name:String,actor2Code:String,actor2CountryCode:String,actor2GroupCode:String,actor2EthnicCode:String,actor2Religion1Code:String,actor2Religion2Code:String,quadClass:Integer,goldsteinScale:Double,numMentions:Integer,numSources:Integer,numArticles:Integer,avgTone:Double,dtg:Date,*geom:Point:srid=4326
d9e6ab555785827f4e5f03d6810bbf05,671867776,120,120,12,1,UNITED STATES,USA,USA,,,,,,,,,,,,3,-4.0,20,2,20,8.77192982456137,2007-07-13T00:00:00.000Z,POINT (-97 38)
INFO  Feature export complete to standard out in 2290ms for 1 features

If the attribute query runs successfully, we can advance to some geo goodness … that’s why we are interested in GeoMesa after all … and perform a spatial query:

# geomesa export -c geomesa.gdelt -f gdelt -u root -p GisPwd -q "CONTAINS(POLYGON ((0 0, 0 90, 90 90, 90 0, 0 0)),geom)" -m 3
Using GEOMESA_ACCUMULO_HOME = /opt/geomesa
id,globalEventId:String,eventCode:String,eventBaseCode:String,eventRootCode:String,isRootEvent:Integer,actor1Name:String,actor1Code:String,actor1CountryCode:String,actor1GroupCode:String,actor1EthnicCode:String,actor1Religion1Code:String,actor1Religion2Code:String,actor2Name:String,actor2Code:String,actor2CountryCode:String,actor2GroupCode:String,actor2EthnicCode:String,actor2Religion1Code:String,actor2Religion2Code:String,quadClass:Integer,goldsteinScale:Double,numMentions:Integer,numSources:Integer,numArticles:Integer,avgTone:Double,dtg:Date,*geom:Point:srid=4326
139346754923c07e4f6a3ee01a3f7d83,671713129,030,030,03,1,NIGERIA,NGA,NGA,,,,,LIBYA,LBY,LBY,,,,,1,4.0,16,2,16,-1.4060533085217,2017-07-10T00:00:00.000Z,POINT (5.43827 5.35886)
9e8e885e63116253956e40132c62c139,671928676,042,042,04,1,NIGERIA,NGA,NGA,,,,,OPEC,IGOBUSOPC,,OPC,,,,1,1.9,5,1,5,-0.90909090909091,2017-07-10T00:00:00.000Z,POINT (5.43827 5.35886)
d6c6162d83c72bc369f68bcb4b992e2d,671817380,043,043,04,0,OPEC,IGOBUSOPC,,OPC,,,,RUSSIA,RUS,RUS,,,,,1,2.8,2,1,2,-1.59453302961275,2017-07-09T00:00:00.000Z,POINT (5.43827 5.35886)
INFO  Feature export complete to standard out in 2127ms for 3 features

Functions that can be used in export command queries/filters are (E)CQL functions from geotools for the most part. More sophisticated queries require SparkSQL.

Publishing GeoMesa tables with GeoServer

To view data in GeoServer, go to http://localhost:9090/geoserver/web. Login with admin:geoserver.

First, we create a new workspace called “geomesa”.

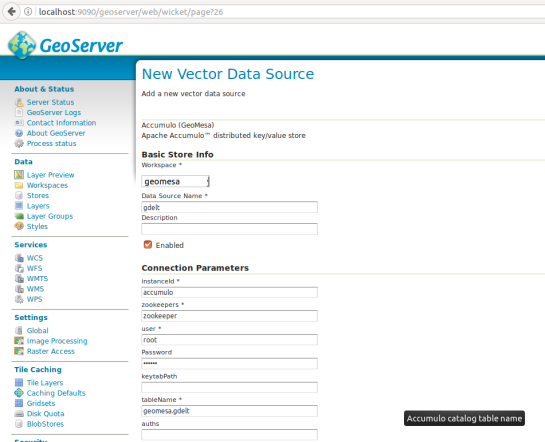
Then, we can create a new store of type Accumulo (GeoMesa) called “gdelt”. Use the following parameters:

instanceId = accumulo
zookeepers = zookeeper
user = root
password = GisPwd
tableName = geomesa.gdelt

Geodocker

Then we can configure a Layer that publishes the content of our new data store. It is good to check the coordinate reference system settings and insert the bounding box information:

Geodocker2

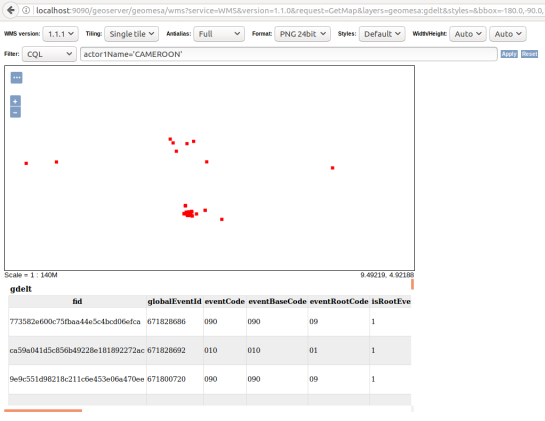
To preview the WMS, go to GeoServer’s preview:

http://localhost:9090/geoserver/geomesa/wms?service=WMS&version=1.1.0&request=GetMap&layers=geomesa:gdelt&styles=&bbox=-180.0,-90.0,180.0,90.0&width=768&height=384&srs=EPSG:4326&format=application/openlayers&TIME=2017-07-10T00:00:00.000Z/2017-07-10T01:00:00.000Z#

Which will look something like this:

Geodocker3

GeoMesa data filtered using CQL in GeoServer preview

For more display options, check the official GeoMesa tutorial.

If you check the preview URL more closely, you will notice that it specifies a time window:

&TIME=2017-07-10T00:00:00.000Z/2017-07-10T01:00:00.000Z

This is exactly where QGIS TimeManager could come in: Using TimeManager for WMS-T layers. Interoperatbility for the win!


Plotting the future of QGIS

During the developer hackfest at our recent QGIS Conference in Nødebo, the developers present had a discussion session about the future (post 3.0) road map for QGIS. Note that the ideas laid out here do no necessarily represent a consensus between all the QGIS developers and community members since those present at the hackfest were only a subset of the great QGIS community. However the discussion probably provides a good idea of the kind of things on our minds as we move forward to QGIS 3.0 and beyond. Just a note before you get too excited reading the article below: This was a future looking session of great ideas that will take QGIS forward, but there may not be anybody actively working on these ideas (if you are looking for something to fund it would be a great start!). Here are twelve ideas that were raised (in no particular order)…

1. We need to beef up the analytical capabilities in QGIS

There was a general feeling that we should have stronger analytical capabilities in QGIS. Somewhere along the line we lost ManageR (the R integration with QGIS) and we have missed the boat in having something like Pandas / Jupyter Notebooks, embedded into QGIS (with iface available to the console). Whilst many data scientists are using R, going the python route with Pandas and Jupyter Notebooks might be a better fit in terms of being harmonious with the other work that has been done to provide python bindings for QGIS. But hey, why not provide both a Jupyter Notebook that supports both Python and R out of the box? Technically curious may want to look here for some hints on how we might go about integrating Jupyter into the QGIS application…

2. We need to improve our ‘first open’ experience

Especially for new users and novice GIS users, starting a QGIS project with a blank white canvas and many buttons and menus can be quite intimidating. We want to provide some basic projects (e.g. based on OpenStreetmap tiles) that can appear as a default layer when you open the QGIS application so that you can immediately get a sense of place and space – much like you would get in Google maps or any web mapping application. Naturally we will provide the option to disable this for those who are not interested in this functionality, but we would make it a default behaviour for new users…

3. We need a better way of communicating with our users

We do not even know simple things like how many users we have (I estimate broadly between 500 000 and 1 000 000 users based on downloads). Most users are silent users – they never communicate with the upstream project via our mailing lists or other communication mechanisms. Not knowing stuff about our users makes it hard to build a better product for them, and not having a communication channel with our users makes it hard for us to let them know about important updates, bug fixes, events etc. and it is a bit silly to be in this situation because every time a user opens QGIS, we have an opportunity to share this kind of information with them. So in the future it would be nice to have a way to provide timed and targeted messages to our users (for example letting them know when we have made a new blog post on the official QGIS blog). It would be nice to have the notification system scriptable by plugin. Of course it should be easy to opt out of or filter the messages by category (e.g. don’t show me event announcements) we share with our users. Imagine on the projects list view you see when you first open QGIS that we have a panel to the right of the projects list which just lists the headlines of the latest announcements. Perhaps there are other ways we can communicate with our users, but we should really make it a priority to get to know our users and this seems like a good start. By seeing how many times a given article gets read after it as been posted in the QGIS announcement area, we might get a better indication of how many users we have. Another example – when a new LTR bug fix comes out, we can publicise it better to make sure users are aware of the important fixes.

4. We need to focus on Quality Assurance (QA)

Especially as relates to reducing the incidence of side effects, QA is going to be critical as the project grows and gains a user base that uses it for critical functions. Side effects happen when e.g. a developer implements one feature that (probably unbeknownst to him) breaks another feature. Side effects are bad because they are hard to test for and hard to trace back to the root cause. The development of QGIS happens in a largely ad hoc manner – developers get contracts to build features their clients need, there is no top-down approach to how we roll out new features. This makes it difficult for us to ensure that side effects do not happen. We are not only concerned with side effects, but QA in general and would like to have the time and resources to spend on really taking the work that has already been put in place (automated testing on Travis for example) to the next level.

5. We need more dedicated (paid) effort to take care of the project

QGIS has become too big of a project to rely entirely on volunteers to take care of all aspects of the project. Many of us still contribute many hours of unpaid volunteer time to the project and will continue to do so. It has long been my vision that we eventually recruited a corps of professional (i.e. paid) contributors to work on QGIS, especially to take care of things that contract work will never cover. For example triaging the pull request queue (which is extremely time consuming), managing the issues in the issue tracker, expanding our test suite coverage, writing documentation, fixing bugs and building ‘cross cutting functionality that typically would not be funded by client work but that everyone will derive benefit from. Our project revenue (from sponsorships and donations) has been steadily growing (thank you to all of those that have contributed!) and if we can increase the revenue a little more we will reach the point where we can start to recruit some of our community members to work for QGIS.org on a professional basis – maybe on a part time basis in the beginning, but eventually building a corps of full time paid staff. This has long been a vision of mine for QGIS and if it is the one thing we achieve while I am project chair, I will be a happy chappie!

6. We need to automate trace captures

This relates somewhat to 3. above – when a user experiences a crash in QGIS, we have no automated way to get that crash information (and no Apple / Microsoft do not pass along the tracebacks to us when they offer to let you post them to their domain 🙂 ). Services like Sentry can aggregate crash data and help us understand the impact of different issues – and thus how to prioritise fixes.

7. We need to find ways to include a more diverse range of people in the project

In this particular brain storming session, we had one lady (hi Sophie!) in a room full of maybe 40 men.

We also have little representation from Africa, Asia, Latin America. A few years ago we added a diversity statement and a code of conduct to our web site, but  we need to ‘get out there’ and be more active about ensuring that people of all ages, genders, races, religions and cultures feel welcomed into our project and start actively participating as ‘makers’ not just consumers. We are a friendly and welcoming project and we should take the effort to let everyone know they are welcome in our community. Some ideas were aired about e.g. having scholarships to fund people from developing nations who would like to attend our conferences and hackfests, and scholarships to fund new developers to port plugins to QGIS 3.0 or similar more entry level tasks. It would be great to have users out there in the commercial world reach out to us to help make this happen (e.g. by offering to fund the travel and expenses of a developer who would normally not be able to attend due to costs).

8. We need to work on maintaining good relations with providers

QGIS sports a growing list of independent commercial support providers – some with very large user bases. I’ve written before here on the blog about some things providers should do to be ‘QGIS friendly’. We really want to encourage providers to use the QGIS LTR’s (Long Term Releases) as the basis for their support services, upstream their fixes to the QGIS project and avoid providing forked copies of QGIS to their clients. Why? It will improve the quality of the LTR QGIS packages and clients of every support provider will benefit. We would also really like to appeal to our commercial support providers to refer to QGIS upstream LTR builds as the ‘Official’ QGIS releases and not some lesser adjective like the ‘Community’ QGIS Release. There was the sentiment in the meeting that  calling it a community release implies that the vendor’s packaged copy is the ‘good one’ and the QGIS.org is the ‘not so good one’ and we would like to reverse that perception. It may seem like splitting hairs to some but we would like to see that there is not fragmentation in the user base of QGIS so we think that it is important to set the right tone from the get-go.

9. We need to promote that QGIS is now a legal entity

It has taken a lot of work, planning and hoop jumping, but QGIS.org is now a legal entity – a Swiss Association / Verein. We are VAT registered, have our own bank account and can now hold our own trademarks and IP instead of working through a proxy. We hope this will open a new chapter in the future growth of QGIS – in particular in our ability to attract much more substantial funding and to make formal agreements with entities where needed. A huge thank you to Andreas Neumann (QGIS PSC Member and project treasurer) for making the whole process happen!

10. We should establish credibility by code signing our products

There was some discussion about the fact that QGIS installers don’t always get recognised by operating systems as a ‘good’ application – virus checkers might flag it or system preferences my reject applications that are not code signed. The good news is that since the meeting Jürgen Fischer has added code signing for the Windows binaries (if that makes you happy please buy him a beer or something :-)) and there is work in progress by Larry Shaffer (who might also be motivated by beer :-)) to have code signed MacOS installers. Of course Linux users are probably scoffing here since they have a nice package distribution mechanism in place and they are already signed.

11. We need a smoother path to integration of code contributions

There was an extended discussion in our meeting about how we should manage contributions to QGIS as we move forward. Some were in favour of forcing everyone to use Pull Requests (PR’s) with a peer review. Others were in favour of also being able to push directly to the code base. Various other permutations were discussed. For now we are going to continue on with our current approach more or less which is to not prevent direct pushes to the code tree, but to discourage it – and of course non-core users will be required to use PR’s since they don’t have direct push rights to the official repo. Suffice to say we are aware of the fact that we have a large backlog of PR’s that are not merged and that it can sometimes be difficult to get your work merged. Hopefully in the future the ideas outlined in point 5. above will help to alleviate this situation….

12. Intergalactic domination

This was a late addition to our meeting notes, but still a worthwhile cause. Martin Dobias  felt strongly that we should include in our roadmap (thus not pictured below), plans for intergalactic domination and hey, if we are going to do something like that, we will need a good GIS to help us find our way around right? 🙂

Thanks to Nyall Dawson for prompting the discussion, it was great to once again experience how convivial and constructive our community discussions are, even when the topics can sometimes get difficult or technically involved!

Screen Shot 2017-08-25 at 12.20.05 PM


Slides FOSS4G 2017

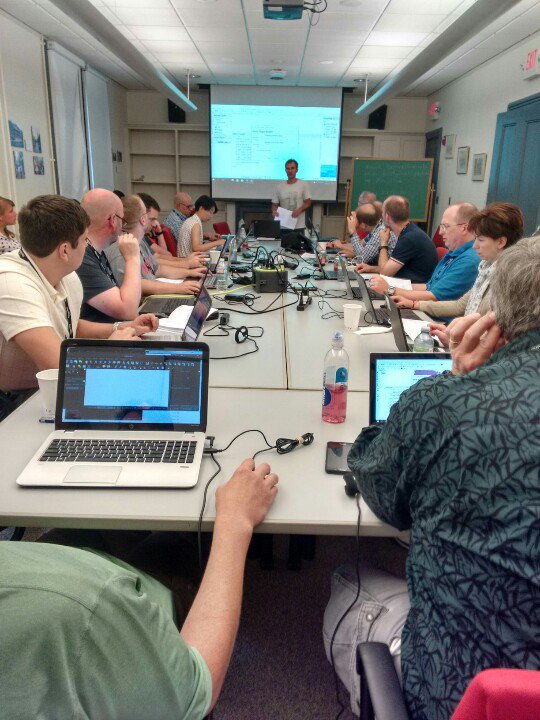
Reporting back from FOSS4G 2017 in Boston, which started with the usual QGIS plugin programming workshop, this time at the Harvard University campus.

image

QGIS Web Client 2

t-rex, a vector tile server for your own data

Sharing and Migrating GIS Projects with OGC GeoPackage

Thanks to the LOC for organizing another great FOSS4G!

Pirmin Kalberer (@implgeo)

Report back on the 3rd QGIS Conference in Nødebo, Denmark

We just wrapped up the 3rd QGIS User Conference at the University of Copenhagen’s “Skovskolen” Forestry and Landscape College, just outside of Copenhagen. The conference programme was split into three parts:

  1. A general user conference of three days
  2. The a QGIS hackfest – where many developers brought their families along
  3. A week of workshops where attendees can learn in-depth topics such as expressions or the new QGIS Web Client version 2

We are extremely grateful to the event sponsors (you can find links to our sponsors at the bottom of this page):

Click to view slideshow.


Here are some of the highlights from the conference presentations:

Search – a cool unifiedsearch tool for QGIS

Klavs Pihlkjaer (from Septima) showed off the QGIS (version 2) search plugin. The plugin provides a unified search interface for datasets loaded in QGIS. You can also search external OGC services. If you are still using QGIS 2.x releases, run, don’t walk to try the search plugin. The Search Plugin also allows you to create third party plugins (via a simple python API) that integrate with it by adding new search sources to the list. If you are using QGIS 3, check out the ability to write plugins for the new locator bar! Klavs is still looking at porting his work over to work with the upcoming QGIS 3 release.

Impact Analysis plugin

Bo Victor Thomsen showed off the plugin he has built to support searching through many layers in multiple databases and database tables in a fast an efficient way. The layers do not need to be loaded in QGIS and the system uses a centralized configuration management approach so that adding new searchable sources is done once and is then immediately available for all users (e.g. in an enterprise environment) of the plugin. The plugin is currently used when searching municipal databases to see if there is any impact assessment needed or inspection needed in a given place.

Danish National Data Search

Mie Winstrup and Tom Weber showed off the national data search plugins they have developed for Denmark that allow you to easily search for local and national data. They want to be an example for other countries to show how easy it is to make national data searchable and available.

Casper Bertelsen on registering urban green areas

Casper showed the system he has developed for managing a cadaster of green spaces. The system includes versioning so that you can see changes over time. It also implements topology rules to ensure that areas do not overlap. He also provides tools for administrations to e.g. see what the maintenance cost for a given area will be.

QGIS as a digitizing platfom

Saber Razmjooei from Lutra Consulting showed off QGIS as a digitizing platform. He also showed us new digitizing coming in QGIS 3. He showed off some of the great tools coming in QGIS 3 for node editing.

QGIS Web Client – Version 2

Andreas Neumann showed of the new generation of QGIS Web Client (QWC2). The new web client is really nice – responsive design and takes advantage of open layers 3 including rotating maps, permalink for any map view / set of layers, map tools for measure, draw, export etc.

Future plans include improved redlining tools including text, polygons, user authentication via LDAP or oauth, support QGIS ‘drag and drop’ forms, clip and ship and a QGIS plugin for the configuration so you do not need to edit JSON files. Also thinking about supporting vector tiles for the base maps.

I bet you didn’t know you could do this with QGIS

Nyall Dawson gave an awesome demo of the power and capabilities of QGIS’ labelling, symbology and expression features. His demo took us through an adventure story where each scene in the story was rendered using QGIS (based on the upcoming version 3 release). This included animated clouds floating by, lightning effects, electrical effects, smoke effects and many more cool and interesting ideas that really showed off the power and versatility of QGIS.

Screen Shot 2017-08-09 at 10.42.51 AM

QGIS 3D

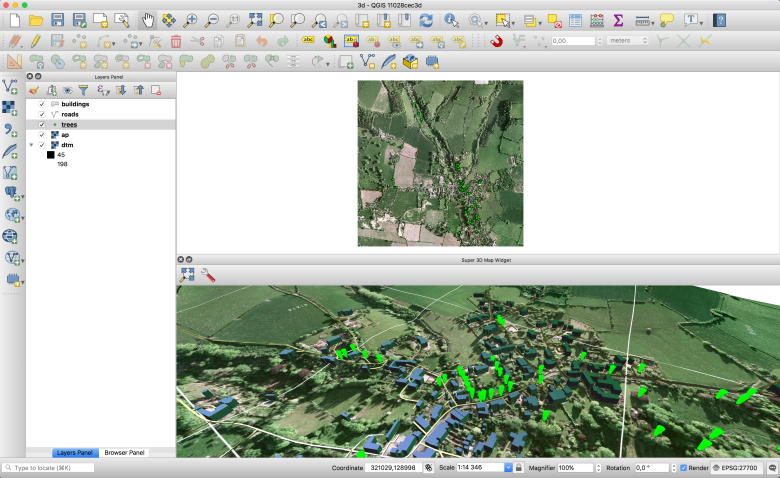
Martin Dobias (Lutra Consulting) gave a presentation on the QGIS grant proposal  work he has been doing to support 3D visualizations natively in QGIS 3.  His work leverages the new Qt 3D framework provided in Qt5 (the toolkit used to develop QGIS) and allows you to use an elevation model to model a 3D terrain and use a new tab in the vector style properties dock to extrude features out from the landscape. We have had a number of 3D  tools in QGIS in the paste but none has ever been a mainstream component of QGIS, enabled and ready to use ‘out of the box’. Expect Martin’s work to change that. There were many ideas passed around about how the 3D support in QGIS could be extended but the grant proposal only supports the first-pass implementation, so please do fund Martin’s work if you would like to see him add specific features in the future.


QIGS as a cadastral management platform

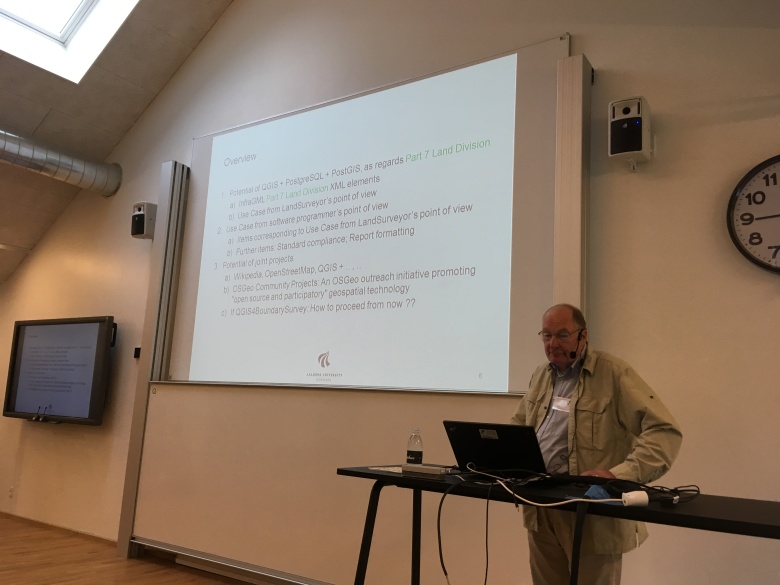
Prof. Erik Stubkjaer gave two presentations – one as a call for interest in those interested in building land parcel / cadastral management tools. He also gave an overview of the state of domain models for managing and recording property rights, including LADM (Land Administration Domain Model) and STDM (Standard Tenure Domain Model). He outlined that world aid organizations are increasingly putting an emphasis on enabling better tax revenue as a path to economic and social stability, and having a cadaster is a key element to the enablement. There are already a number of cadastral management tools out there for QGIS – it would be great to heed Prof. Stubkjaer’s clarion call and build a generic toolset for cadastral management in QGIS.

The future of coordinate reference system support in QGIS

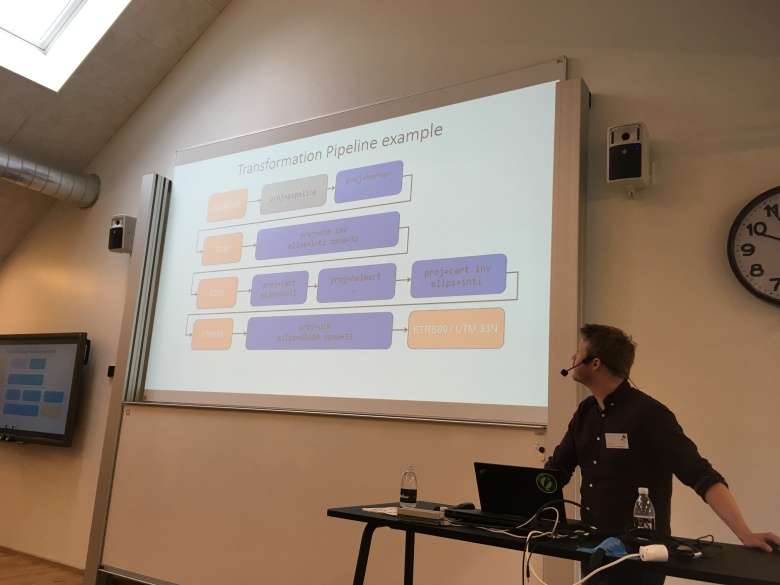
Kristian Evers from the Danish Agency for Data Supply and Efficiency spoke about the use of Coordinate Reference Systems in QGIS and the use of WGS84. He pointed out the fact that there are 6 different versions of WGS84 and they vary by up to a meter. He also highlighted the issue that e.g. ETRS89 drifts more out of sync each year. In addition the earth is dynamic with plates shifting and different regions moving with different velocities. He showed a really nice video made in Australia highlighting the issue (see here: http://www.icsm.gov.au/gda2020/ for details and the video). They use a plate fixed datum (which moves with the plates) together with a global datum (fixed to the center of the earth). This new approach is being planned / used in other places too (e.g. Iceland) and are called “dynamic datums”.  The dynamic datums will rely on a time stamp too as well as coordinates.

To address this they are introducing the concept of transformation pipelines in Proj.4 (the library used by QGIS to support projection) – there will be a new release of Project.4 which includes support for this.

InaSAFE

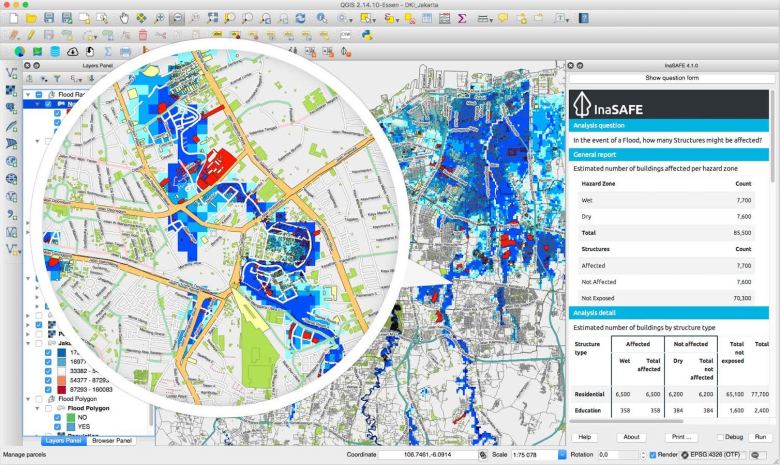
Tim Sutton (your humble blog post author) gave a presentation about InaSAFE – a plugin for QGIS that helps communities prepare for disasters.

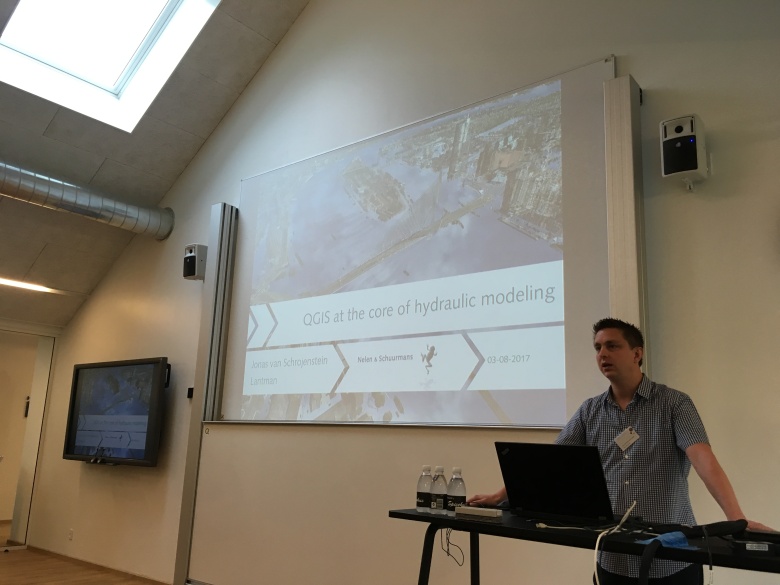
Jonas van Schrojenstein Lantern (from Nelen & Schuurmans)

Jonas’ company built really fast and efficient models for flood models including 3D visualization. They have a really nice plugin for QGIS that lets you view a pipe model and different behaviors based on changed water levels. It requires a specific data model (d3i) in the Postgres backend and then you can visualize water levels in any pipe section. The plugin also lets you do the digitizing of the pipe network etc. The software also requires the use of som 3di services that Jonas will clarify how the licensing etc. should work.

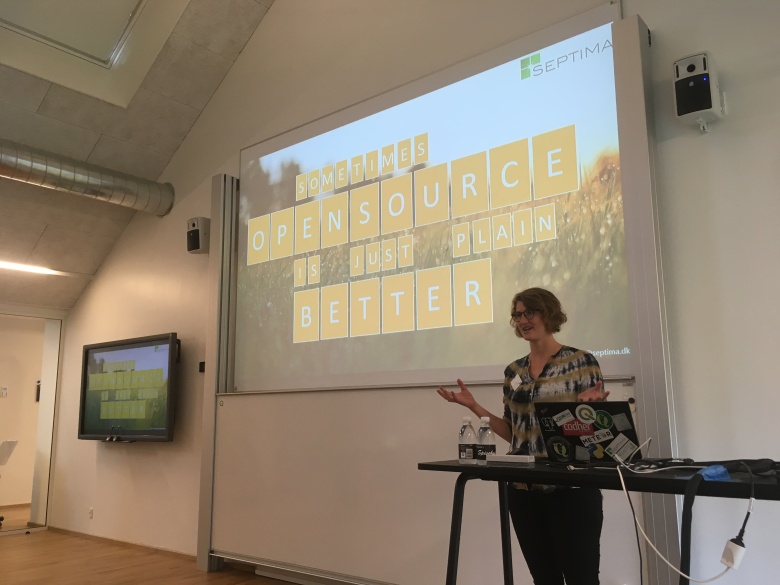
Mie Winstrup – Septima – sometimes Open Source is just plain better

Mie shared a case study about how they used Open Source to replace a tool built with ArcMap + Model Builder for flood modeling. They used malstroem  – a python command line module and also integrated with QGIS. It assumes the terrain is an impermeable surface and that water flows from one cell to another. The tool models where water will accumulate in the landscape and what the depths are at each ‘blue spot’. It also models how much water will flow from the blue spots (based on modeled precipitation amount e.g. 100mm rain). It generates an event layer which shows how many cubic meters of water will spill over to the neighboring watershed.

https://github.com/Septima/qgis-malstroem

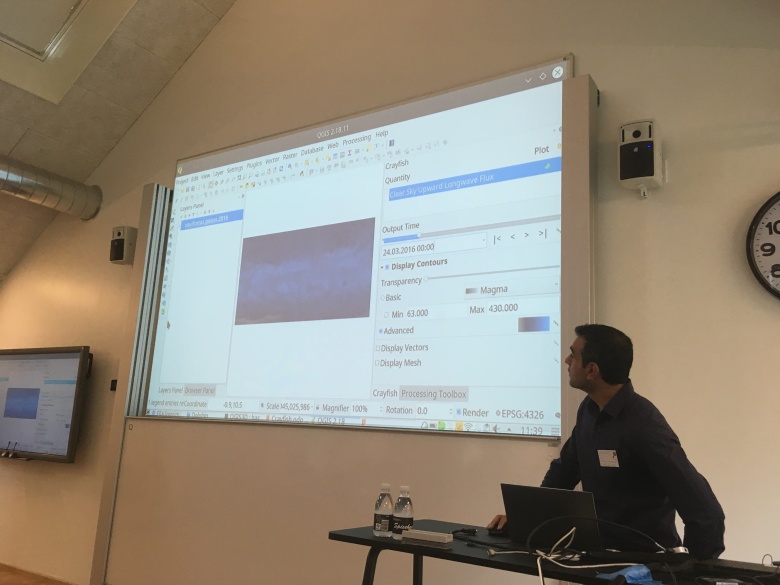
Saber Razmjooei – Lutra consulting – Crayfish plugin

Crayfish C++ plugin for QGIS adds a new renderer for gridded data. Works with HDF, NetCDF and GRIB.

What to watch out for in QGIS 3.

Nyall Dawson (core QGIS developer) gave a talk on what to expect in QGIS 3. The talk was not a feature round up but rather aimed at those concerned about the potential gotchas they will have to take care of when they migrate from QGIS 2 to QGIS 3 in their production environments. I record


Monica Balestrin Nunes & Ana Paula Maciel (National Secretariat for Housing in the Ministry of Cities, Brazil)

Monica and Ann Paula presented a talk on how the Ministry of Cities in Brazil are using QGIS and mapping to manage the roll out of housing projects to support  provision of housing for the poor “My House, My Life”. The project aims to help 4.5 million people get into housing.  They used QGIS to develop a site selection process too. They used a simple process to map urban areas, developed versus undeveloped urban areas, schools. They also used public transport as a parameters to further constrain the available areas. These data were used to produce a synthesis map which shows high, medium and low suitability of areas for housing development. They used a digital coding system to classify each area (which can be mapped back to the high, medium and low assessment ratings). They also used GeoServer, GeoKettle, PostgreSQL/PostGIS.

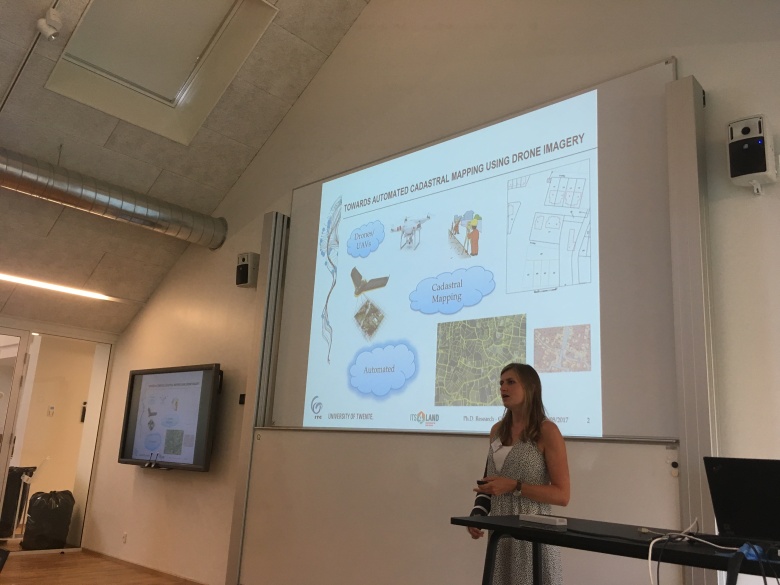
Sophie Commelinck – University of Twente

Automated cadastral mapping using UAVs. Sophie showed workflows she is building for automatic extraction of parcel boundaries from UAV imagery. She showed some interesting work in doing boundary line detection using the SLIC algorithm which creates smoothed lines along boundaries. See http://github.com/scrommelinck/boundarylinedelineation for more details.

Sophie.JPG

Kimberley Briscoe, Abingdon School, UK

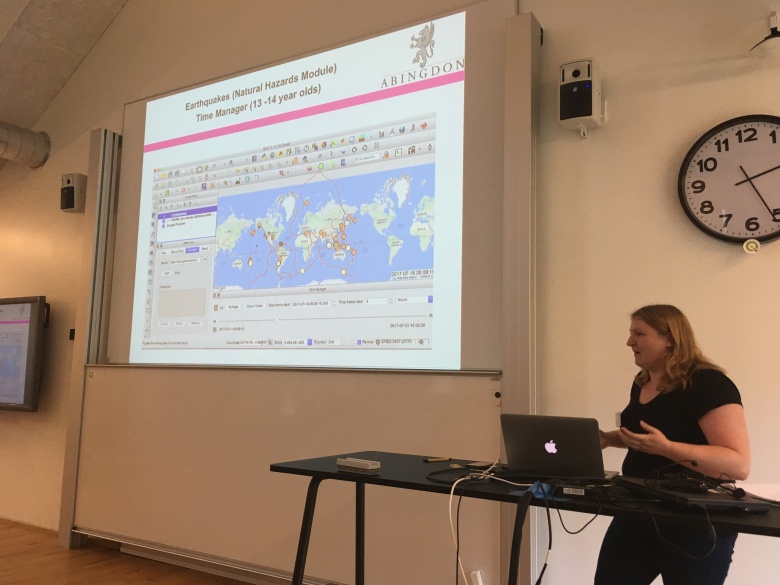
Kimberley has been doing interesting things with high school kids learning GIS via QGIS. This work included using the time manager plugin to visualize global earthquakes and using r.lake.coordinates to do flood modeling. They also use ‘field trip gb’ mobile app to do field data collection. Many other plugins were used like EVIS, QGIS2Threejs. They also use interesting national datasets like crime etc. and data from http://data.gov.uk for their classroom work.

Kimberly.JPG

Badri Basnet – The University of Southern Queensland

Badri is a lecturer and has 90% online students in many different locations worldwide and with varying levels of internet access.  Badri has made many open content QGIS training videos and worksheets that he uses for his courses (which are based on QGIS). His videos are all on YouTube.

Badri.JPG

QField – Matthias Kuhn and Marco Bernasocchi (opengis.ch)

Matthias and Marco gave presentations on QField – an Android field data collection app based on QGIS (but with a mobile centric user interface). Matthias showed us many of the cool features QField has, whilst Marco outlined strategies for integrating field work, web publishing and desktop GIS work in a seamless workflow. I made some videos with my phone – audio and video quality is not brilliant but should be enough to follow along for those interested:

Lene Fischer (Skovskolen)

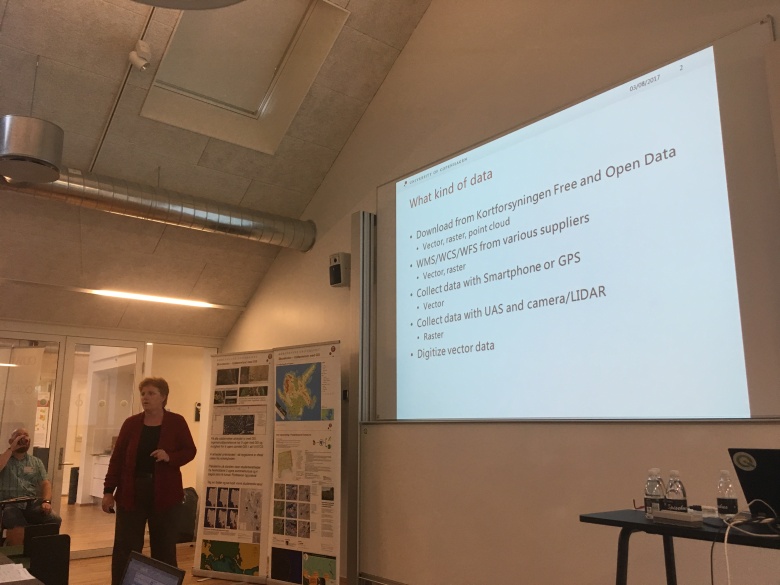
Lene (who also happens to be the event organizer – hurrah for the great job she did along with her team of volunteers!) showed how they approach teaching GIS and QGIS using ‘flipped learning’ where users first need to self study content on their own, and then use the lecturer as a consultant.

Lene.JPG

Tim Sutton – Cadasta

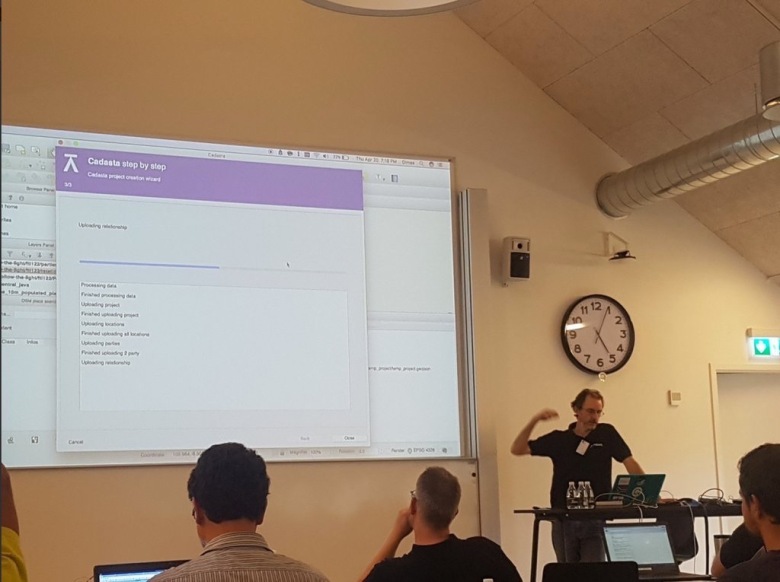
Your trusty author again – I presented work we have been doing to support mapping land rights of people in developing nations using the Standard Tenure Domain Model style approach where tenure is treated as a continuum rather than an absolute. You can find out more about this project at Cadasta.org

tim-cadasta

Workshops

The event was also filled with great workshops – two during the main conference, and then a week of post conference workshops. Most of the workshops were presented by developers or QGIS project members and represented a fantastic opportunity for attendees to learn straight from the experts!

Town hall meeting

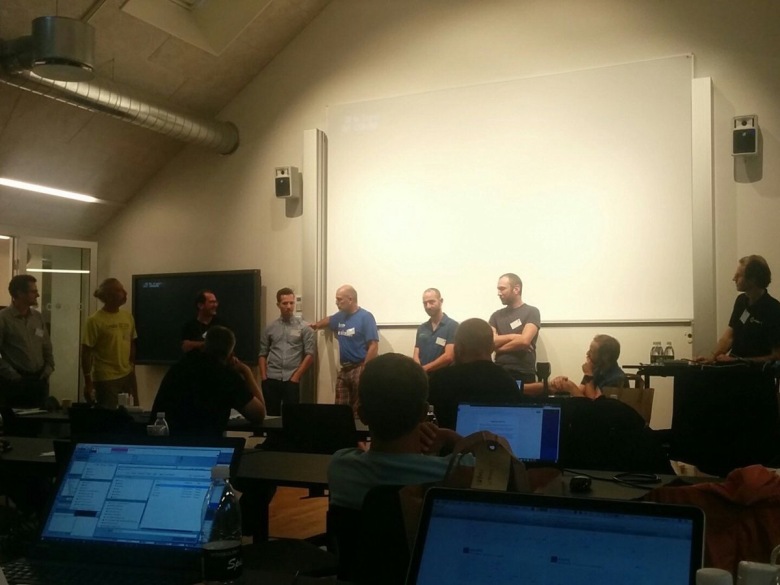
At the end of the user conference, we held a town hall meeting where developers and active QGIS community members fielded a range of questions from the audience. It is always a please to hold these sessions – we get a direct channel of communication with our users and they get to speak directly to the people making the software they use and find out why we make the choices we make!

town-hall.jpg

Hackfest

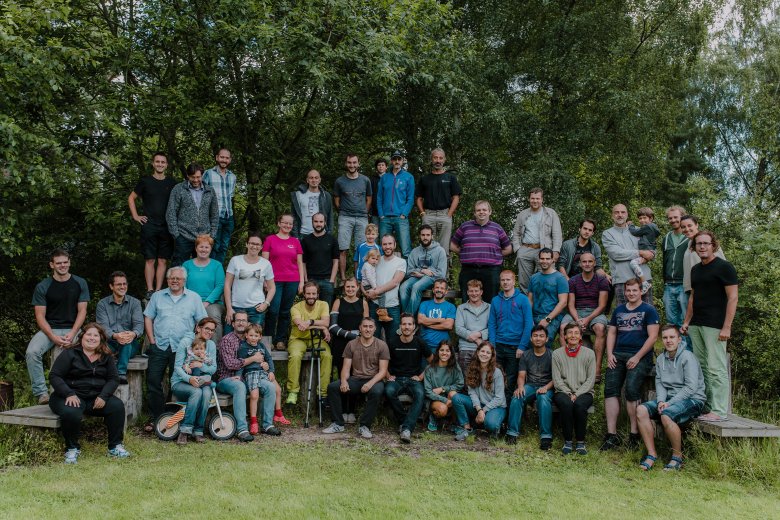
The “hackfest” (developer meeting – we use ‘hack’ in the positive sense of the word) was a chance for the QGIS community members to roll up their sleeves and work on new features, bug fixes, documentation and general polish of QGIS and related resources. It is always great to be able to work side by side for a few days – compared to our very geographically dispersed nature over the rest of the year. It was especially nice this event that many developers brought their families along to enjoy the beautiful scenery and great facilities at the Skovskolen. Here is a group photo taken by Mary Anne Lister:

IMG_2288

Thanks

On behalf of the whole QGIS community, I would like to extend our heartfelt thanks to Lene Fischer (event organizer), her team of volunteers, all the attendees who took the time to attend the conference – and of course all the developers and QGIS Community Members who attended and made it such a great event!


Event sponsor links:


Visualizing 3D data with expressions

How to visualize point data with Z values? Let’s say: we have data about noise pollution in multi-storey buildings. The point data (apartments) looks like this: The attribute table looks like this: We see X and Y coordinates, and a Z (height) value. The DB column gives the actual noise data, which we want to … Continue reading Visualizing 3D data with expressions

Movement data in GIS #7: animated trajectories with TimeManager

In this post, we use TimeManager to visualize the position of a moving object over time along a trajectory. This is another example of what is possible thanks to QGIS’ geometry generator feature. The result can look like this:

What makes this approach interesting is that the trajectory is stored in PostGIS as a LinestringM instead of storing individual trajectory points. So there is only one line feature loaded in QGIS:

(In part 2 of this series, we already saw how a geometry generator can be used to visualize speed along a trajectory.)

The layer is added to TimeManager using t_start and t_end attributes to define the trajectory’s temporal extent.

TimeManager exposes an animation_datetime() function which returns the current animation timestamp, that is, the timestamp that is also displayed in the TimeManager dock, as well as on the map (if we don’t explicitly disable this option).

Once TimeManager is set up, we can edit the line style to add a point marker to visualize the position of the moving object at the current animation timestamp. To do that, we interpolate the position along the trajectory segments. The first geometry generator expression splits the trajectory in its segments:

The second geometry generator expression interpolates the position on the segment that contains the current TimeManager animation time:

The WHEN statement compares the trajectory segment’s start and end times to the current TimeManager animation time. Afterwards, the line_interpolate_point function is used to draw the point marker at the correct position along the segment:

CASE 
WHEN (
m(end_point(geometry_n($geometry,@geometry_part_num)))
> second(age(animation_datetime(),to_datetime('1970-01-01 00:00')))
AND
m(start_point(geometry_n($geometry,@geometry_part_num)))
<= second(age(animation_datetime(),to_datetime('1970-01-01 00:00')))
)
THEN
line_interpolate_point( 
  geometry_n($geometry,@geometry_part_num),
  1.0 * (
    second(age(animation_datetime(),to_datetime('1970-01-01 00:00')))
	- m(start_point(geometry_n($geometry,@geometry_part_num)))
  ) / (
    m(end_point(geometry_n($geometry,@geometry_part_num)))
	- m(start_point(geometry_n($geometry,@geometry_part_num)))
  ) 
  * length(geometry_n($geometry,@geometry_part_num))
)
END

Here is the animation result for a part of the trajectory between 08:00 and 09:00:


Read more:


OSM data quality assessment: producing map to illustrate data quality

At Oslandia, we like working with Open Source tool projects and handling Open (geospatial) Data. In this article series, we will play with the OpenStreetMap (OSM) map and subsequent data. Here comes the eighth article of this series, dedicated to the OSM data quality evaluation, through production of new maps.

1 Description of OSM element

 1.1 Element metadata extraction

As mentionned in a previous article dedicated to metadata extraction, we have to focus on element metadata itself if we want to produce valuable information about quality. The first questions to answer here are straightforward: what is an OSM element? and how to extract its associated metadata?. This part is relatively similar to the job already done with users.

We know from previous analysis that an element is created during a changeset by a given contributor, may be modified several times by whoever, and may be deleted as well. This kind of object may be either a “node”, a “way” or a “relation”. We also know that there may be a set of different tags associated with the element. Of course the list of every operations associated to each element is recorded in the OSM data history. Let’s consider data around Bordeaux, as in previous blog posts:

import pandas as pd
elements = pd.read_table('../src/data/output-extracts/bordeaux-metropole/bordeaux-metropole-elements.csv', parse_dates=['ts'], index_col=0, sep=",")
elements.head().T
   elem        id  version  visible         ts    uid  chgset
0  node  21457126        2    False 2008-01-17  24281  653744
1  node  21457126        3    False 2008-01-17  24281  653744
2  node  21457126        4    False 2008-01-17  24281  653744
3  node  21457126        5    False 2008-01-17  24281  653744
4  node  21457126        6    False 2008-01-17  24281  653744

This short description helps us to identify some basic features, which are built in the following snippets. First we recover the temporal features:

elem_md = (elements.groupby(['elem', 'id'])['ts']
            .agg(["min", "max"])
            .reset_index())
elem_md.columns = ['elem', 'id', 'first_at', 'last_at']
elem_md['lifespan'] = (elem_md.last_at - elem_md.first_at)/pd.Timedelta('1D')
extraction_date = elements.ts.max()
elem_md['n_days_since_creation'] = ((extraction_date - elem_md.first_at)
                                  / pd.Timedelta('1d'))
elem_md['n_days_of_activity'] = (elements
                              .groupby(['elem', 'id'])['ts']
                              .nunique()
                              .reset_index())['ts']
elem_md = elem_md.sort_values(by=['first_at'])
                                    213418
elem                                  node
id                               922827508
first_at               2010-09-23 00:00:00
last_at                2010-09-23 00:00:00
lifespan                                 0
n_days_since_creation                 2341
n_days_of_activity                       1

Then the remainder of the variables, e.g. how many versions, contributors, changesets per elements:

    elem_md['version'] = (elements.groupby(['elem','id'])['version']
                          .max()
                          .reset_index())['version']
    elem_md['n_chgset'] = (elements.groupby(['elem', 'id'])['chgset']
                           .nunique()
                           .reset_index())['chgset']
    elem_md['n_user'] = (elements.groupby(['elem', 'id'])['uid']
                         .nunique()
                         .reset_index())['uid']
    osmelem_last_user = (elements
                         .groupby(['elem','id'])['uid']
                         .last()
                         .reset_index())
    osmelem_last_user = osmelem_last_user.rename(columns={'uid':'last_uid'})
    elements = pd.merge(elements, osmelem_last_user,
                       on=['elem', 'id'])
    elem_md = pd.merge(elem_md,
                       elements[['elem', 'id', 'version', 'visible', 'last_uid']],
                       on=['elem', 'id', 'version'])
    elem_md = elem_md.set_index(['elem', 'id'])
    elem_md.sample().T
elem                                  node
id                              1340445266
first_at               2011-06-26 00:00:00
last_at                2011-06-27 00:00:00
lifespan                                 1
n_days_since_creation                 2065
n_days_of_activity                       2
version                                  2
n_chgset                                 2
n_user                                   1
visible                              False
last_uid                            354363

As an illustration we have above an old two-versionned node, no more visible on the OSM website.

1.2 Characterize OSM elements with user classification

This set of features is only descriptive, we have to add more information to be able to characterize OSM data quality. That is the moment to exploit the user classification produced in the last blog post!

As a recall, we hypothesized that clustering the users permits to evaluate their trustworthiness as OSM contributors. They are either beginners, or intermediate users, or even OSM experts, according to previous classification.

Each OSM entity may have received one or more contributions by users of each group. Let’s say the entity quality is good if its last contributor is experienced. That leads us to classify the OSM entities themselves in return!

How to include this information into element metadata?

We first need to recover the results of our clustering process.

user_groups = pd.read_hdf("../src/data/output-extracts/bordeaux-metropole/bordeaux-metropole-user-kmeans.h5", "/individuals")
user_groups.head()
           PC1       PC2       PC3       PC4       PC5       PC6  Xclust
uid                                                                     
1626 -0.035154  1.607427  0.399929 -0.808851 -0.152308 -0.753506       2
1399 -0.295486 -0.743364  0.149797 -1.252119  0.128276 -0.292328       0
2488  0.003268  1.073443  0.738236 -0.534716 -0.489454 -0.333533       2
5657 -0.889706  0.986024  0.442302 -1.046582 -0.118883 -0.408223       4
3980 -0.115455 -0.373598  0.906908  0.252670  0.207824 -0.575960       5

As a remark, there were several important results to save after the clustering process; we decided to serialize them into a single binary file. Pandas knows how to manage such file, that would be a pity not to take advantage of it!

We recover the individuals groups in the eponym binary file tab (column Xclust), and only have to join it to element metadata as follows:

elem_md = elem_md.join(user_groups.Xclust, on='last_uid')
elem_md = elem_md.rename(columns={'Xclust':'last_uid_group'})
elem_md.reset_index().to_csv("../src/data/output-extracts/bordeaux-metropole/bordeaux-metropole-element-metadata.csv")
elem_md.sample().T
elem                                  node
id                              1530907753
first_at               2011-12-04 00:00:00
last_at                2011-12-04 00:00:00
lifespan                                 0
n_days_since_creation                 1904
n_days_of_activity                       1
version                                  1
n_chgset                                 1
n_user                                   1
visible                               True
last_uid                             37548
last_uid_group                           2

From now, we can use the last contributor cluster as an additional information to generate maps, so as to study data quality…

Wait… There miss another information, isn’t it? Well yes, maybe the most important one, when dealing with geospatial data: the location itself!

1.3 Recover the geometry information

Even if Pyosmium library is able to retrieve OSM element geometries, we realized some tests with an other OSM data parser here: osm2pgsql.

We can recover geometries from standard OSM data with this tool, by assuming the existence of an osm database, owned by user:

osm2pgsql -E 27572 -d osm -U user -p bordeaux_metropole --hstore ../src/data/raw/bordeaux-metropole.osm.pbf

We specify a France-focused SRID (27572), and a prefix for naming output databases point, line, polygon and roads.

We can work with the line subset, that contains the physical roads, among other structures (it roughly corresponds to the OSM ways), and build an enriched version of element metadata, with geometries.

First we can create the table bordeaux_metropole_geomelements, that will contain our metadata…

DROP TABLE IF EXISTS bordeaux_metropole_elements;
DROP TABLE IF EXISTS bordeaux_metropole_geomelements;
CREATE TABLE bordeaux_metropole_elements(
       id int,
       elem varchar,
       osm_id bigint,
       first_at varchar,
       last_at varchar,
       lifespan float,
       n_days_since_creation float,
       n_days_of_activity float,
       version int,
       n_chgsets int,
       n_users int,
       visible boolean,
       last_uid int,
       last_user_group int
);

…then, populate it with the data accurate .csv file…

COPY bordeaux_metropole_elements
FROM '/home/rde/data/osm-history/output-extracts/bordeaux-metropole/bordeaux-metropole-element-metadata.csv'
WITH(FORMAT CSV, HEADER, QUOTE '"');

…and finally, merge the metadata with the data gathered with osm2pgsql, that contains geometries.

SELECT l.osm_id, h.lifespan, h.n_days_since_creation,
h.version, h.visible, h.n_users, h.n_chgsets,
h.last_user_group, l.way AS geom
INTO bordeaux_metropole_geomelements
FROM bordeaux_metropole_elements as h
INNER JOIN bordeaux_metropole_line as l
ON h.osm_id = l.osm_id AND h.version = l.osm_version
WHERE l.highway IS NOT NULL AND h.elem = 'way'
ORDER BY l.osm_id;

Wow, this is wonderful, we have everything we need in order to produce new maps, so let’s do it!

2 Keep it visual, man!

From the last developments and some hypothesis about element quality, we are able to produce some customized maps. If each OSM entities (e.g. roads) can be characterized, then we can draw quality maps by highlighting the most trustworthy entities, as well as those with which we have to stay cautious.

In this post we will continue to focus on roads within the Bordeaux area. The different maps will be produced with the help of Qgis.

2.1 First step: simple metadata plotting

As a first insight on OSM elements, we can plot each OSM ways regarding simple features like the number of users who have contributed, the number of version or the element anteriority.
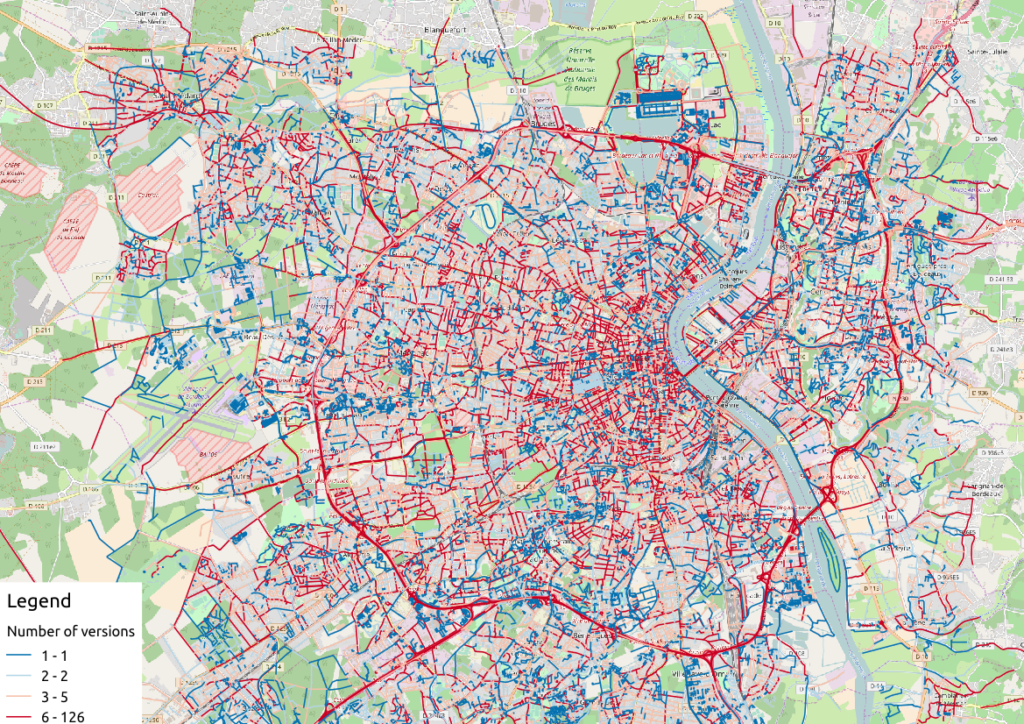
Figure 1: Number of active contributors per OSM way in Bordeaux


Figure 2: Number of versions per OSM way in Bordeaux

With the first two maps, we see that the ring around Bordeaux is the most intensively modified part of the road network: more unique contributors are implied in the way completion, and more versions are designed for each element. Some major roads within the city center present the same characteristics.

Figure 3: Anteriority of each OSM way in Bordeaux, in years

If we consider the anteriority of OSM roads, we have a different but interesting insight of the area. The oldest roads are mainly located within the city center, even if there are some exceptions. It is also interesting to notice that some spatial patterns arise with temporality: entire neighborhoods are mapped within the same anteriority.

2.2 More complex: OSM data merging with alternative geospatial representations

To go deeper into the mapping analysis, we can use the INSEE carroyed data, that divides France into 200-meter squared tiles. As a corollary OSM element statistics may be aggregated into each tile, to produce additional maps. Unfortunately an information loss will occur, as such tiles are only defined where people lives. However it can provides an interesting alternative illustration.

To exploit such new data set, we have to merge the previous table with the accurate INSEE table. Creating indexes on them is of great interest before running such a merging operation:

CREATE INDEX insee_geom_gist
ON open_data.insee_200_carreau USING GIST(wkb_geometry);
CREATE INDEX osm_geom_gist
ON bordeaux_metropole_geomelements USING GIST(geom);

DROP TABLE IF EXISTS bordeaux_metropole_carroyed_ways;
CREATE TABLE bordeaux_metropole_carroyed_ways AS (
SELECT insee.ogc_fid, count(*) AS nb_ways,
avg(bm.version) AS avg_version, avg(bm.lifespan) AS avg_lifespan,
avg(bm.n_days_since_creation) AS avg_anteriority,
avg(bm.n_users) AS avg_n_users, avg(bm.n_chgsets) AS avg_n_chgsets,
insee.wkb_geometry AS geom
FROM open_data.insee_200_carreau AS insee
JOIN bordeaux_metropole_geomelements AS bm
ON ST_Intersects(insee.wkb_geometry, bm.geom)
GROUP BY insee.ogc_fid
);

As a consequence, we get only 5468 individuals (tiles), a quantity that must be compared to the 29427 roads previously handled… This operation will also simplify the map analysis!

We can propose another version of previous maps by using Qgis, let’s consider the average number of contributors per OSM roads, for each tile:

Figure 4: Number of contributors per OSM roads, aggregated by INSEE tile

2.3 The cherry on the cake: representation of OSM elements with respect to quality

Last but not least, the information about last user cluster can shed some light on OSM data quality: by plotting each roads according to the last user who has contributed, we might identify questionable OSM elements!

We simply have to design similar map than in previous section, with user classification information:

Figure 5: OSM roads around Bordeaux, according to the last user cluster (1: C1, relation experts; 2: C0, versatile expert contributors; 3: C4, recent one-shot way contributors; 4: C3, old one-shot way contributors; 5: C5, locally-unexperienced way specialists)

According to the clustering done in the previous article (be careful, the legend is not the same here…), we can make some additional hypothesis:

  • Light-blue roads are OK, they correspond to the most trustful cluster of contributors (91.4% of roads in this example)
  • There is no group-0 road (group 0 corresponds to cluster C2 in the previous article)… And that’s comforting! It seems that “untrustworthy” users do not contribute to roads or -more probably- that their contributions are quickly amended.
  • Other contributions are made by intermediate users: a finer analysis should be undertaken to decide if the corresponding elements are valid. For now, we can consider everything is OK, even if local patterns seem strong. Areas of interest should be verified (they are not necessarily of low quality!)

For sure, it gives a fairly new picture of OSM data quality!

3 Conclusion

In this last article, we have designed new maps on a small area, starting from element metadata. You have seen the conclusion of our analysis: characterizing the OSM data quality starting from the user contribution history.

Of course some works still have to be done, however we detailed a whole methodology to tackle the problem. We hope you will be able to reproduce it, and to design your own maps!

Feel free to contact us if you are interested in this topic!

Building QGIS3D on (K)ubuntu 16.04

QGIS support for 3D canvas is ready for testing. A possible hurdle in getting QGIS compiled with 3D support may be the fact that we require Qt in version at least 5.8 and it is recommended to use Qt 5.9 which introduces further enhancements. The current QGIS master branch (to be 3.0 release) is usually built against earlier versions of Qt. For example in Ubuntu 16.04, the default Qt package version is 5.5.

Continue reading for more detail on how to build QGIS with the latest Qt on Ubuntu …

Build of QGIS

The default Qt (from official repositories) on (K)Ubuntu 16.04 is too old and does not include the new Qt 3D framework. We build QGIS with Qt 5.9.1. We are going to install QT to /opt/Qt5.9.1/ and QGIS dependencies built with Qt5.9 to /opt/qt59_libs, so make sure you have these folders created and ready to use.

Qt 5.9.1

To add Qt 5.9.1, we can use a ppa:

sudo add-apt-repository ppa:beineri/opt-qt591-xenial
sudo apt-get update
sudo apt-get install qt59-meta-full

This will install Qt 5.9.1 side-by-side your current system Qt under /opt folder. You can later remove the package without affecting dependencies in your system.

alternatively you can download QT 5.9.1 installer from http://download.qt.io/official_releases/qt/5.9/5.9.1/qt-opensource-linux-x64-5.9.1.run and install it to the same location.

Qwt 6.1.3

Another dependency is Qwt. You can download the package and build it with Qt 5.9.1. To download the package, click here: https://sourceforge.net/projects/qwt/files/qwt/6.1.3/ Make a new folder and move the zip file there:

mkdir /tmp/qgis_deps
mv ~/Downloads/qwt-6.1.3.zip /tmp/qgis_deps
cd /tmp/qgis_deps
unzip qwt-6.1.3.zip
cd qwt-6.1.3

We need to define the prefix path. To do that, open qwtconfig.pri in a text editor and change the prefix path:

nano qwtconfig.pri

change QWT_INSTALL_PREFIX = /opt/qt59_libs/qwt-6.1.3 (more occurrences in the file!)

You can now compile the project:

/opt/qt59/bin/qmake qwt.pro
make -j4
make install

Check if the library has been installed correctly:

ls /opt/qt59_libs/qwt-6.1.3

QScintilla2 2.10.1

Use the compressed file from here: https://www.riverbankcomputing.com/software/qscintilla/download

Download and copy to /tmp/qgis_deps

mv ~/Downloads/QScintilla_gpl-2.10.1.tar.gz /tmp/qgis_deps/
cd /tmp/qgis_deps
tar xvzf QScintilla_gpl-2.10.1.tar.gz
cd QScintilla_gpl-2.10.1/Qt4Qt5/
/opt/qt59/bin/qmake qscintilla.pro
make -j4
sudo make install

You should now have the compiled qscintilla in the following path:

ls /opt/qt59/lib/libqscintilla2_qt5.so

QGIS

First clone (or add as another remote) QGIS fork wonder-sk/QGIS and change branch to 3d

git clone [email protected]:wonder-sk/QGIS.git
cd QGIS
git checkout 3d

Now you can follow standard instructions on QGIS repo for building the applications: https://raw.githubusercontent.com/qgis/QGIS/master/INSTALL

Once you have created the build directory (after step https://github.com/qgis/QGIS/blob/master/INSTALL#L266) you need to configure the cmake with the following options:

CMAKE_PREFIX_PATH=/opt/qt59/lib/cmake cmake \
   -GNinja \
   -DCMAKE_BUILD_TYPE=Debug \
   -DCMAKE_INSTALL_PREFIX=${HOME}/apps \
   -DWITH_3D=TRUE \
   -DWITH_QTWEBKIT=FALSE \
   -DENABLE_TESTS=FALSE \
   -DWITH_QWTPOLAR=FALSE \
   -DWITH_BINDINGS=FALSE \
   -DQWT_LIBRARY=/opt/qt59_libs/qwt-6.1.3/lib/libqwt.so \
   -DQWT_INCLUDE_DIR=/opt/qt59_libs/qwt-6.1.3/include \
   -DQSCINTILLA_LIBRARY=/opt/qt59/lib/libqscintilla2_qt5.so \
   -QSCINTILLA_INCLUDE_DIR=/opt/qt59/include \
   ..

The new flag is WITH_3D=TRUE.

In the output, make sure it has found built libraries (NOT Qt 5.7 line)

-- Found Qt version: 5.9
-- Found Qwt: /opt/qt59_libs/qwt-6.1.3/lib/libqwt.so (6.1.3)
-- Found QScintilla2: /opt/Qt5.9.1/5.9.1/gcc_64/lib/libqscintilla2_qt5.so (2.10.1)

Note that if you are using your own compiled version of GDAL, you need to define it using this flag: -DGDAL_CONFIG=/PATH/TO/bin/gdal-config

If all dependencies are detected properly, you should be able to build QGIS using ninja:

ninja

To run QGIS from your build folder:

cd output/bin
./qgis

To verify that you are using the right version of QGIS, you can go to Help > About and check which version of Qt your application has been built against.

Loading the data

Now in QGIS, open 3D Canvas in menu: View->New 3D Map View. For 3D styling of vector layers, open Layer Styling dock widget and enable 3D Renderer in the newly added tab with 3D cube icon.

You may also like...

Mergin Maps, a field data collection app based on QGIS. Mergin Maps makes field work easy with its simple interface and cloud-based sync. Available on Android, iOS and Windows. Screenshots of the Mergin Maps mobile app for Field Data Collection
Get it on Google Play Get it on Apple store

A little QGIS3 Server wsgi experiment

Here is a little first experiment for a wsgi wrapper to QGIS 3 Server, not much tested, but basically working:  

#!/usr/bin/env python

# Simple QGIS 3 Server wsgi test

import signal
import sys
from cgi import escape, parse_qs
from urllib.parse import quote
# Python's bundled WSGI server
from wsgiref.simple_server import make_server

from qgis.core import QgsApplication
from qgis.server import *

# Init QGIS
qgs_app = QgsApplication([], False)
# Init server
qgs_server = QgsServer()


def reconstruct_url(environ):
    """Standard algorithm to retrieve the full URL from wsgi request
    From: https://www.python.org/dev/peps/pep-0333/#url-reconstruction
    """
    url = environ['wsgi.url_scheme']+'://'

    if environ.get('HTTP_HOST'):
        url += environ['HTTP_HOST']
    else:
        url += environ['SERVER_NAME']

        if environ['wsgi.url_scheme'] == 'https':
            if environ['SERVER_PORT'] != '443':
                url += ':' + environ['SERVER_PORT']
        else:
            if environ['SERVER_PORT'] != '80':
                url += ':' + environ['SERVER_PORT']

    url += quote(environ.get('SCRIPT_NAME', ''))
    url += quote(environ.get('PATH_INFO', ''))
    if environ.get('QUERY_STRING'):
        url += '?' + environ['QUERY_STRING']
    return url

def application (environ, start_response):

    headers = {} # Parse headers from environ here if needed

    # the environment variable CONTENT_LENGTH may be empty or missing
    # When the method is POST the variable will be sent
    # in the HTTP request body which is passed by the WSGI server
    # in the file like wsgi.input environment variable.
    try:
        request_body_size = int(environ.get('CONTENT_LENGTH', 0))
        request_body = environ['wsgi.input'].read(request_body_size)
    except (ValueError):
        request_body_size = 0
        request_body = None

    request = QgsBufferServerRequest(reconstruct_url(environ), (QgsServerRequest.PostMethod 
        if environ['REQUEST_METHOD'] == 'POST' else QgsServerRequest.GetMethod), {}, request_body)
    response = QgsBufferServerResponse()
    qgs_server.handleRequest(request, response)
    headers_dict = response.headers()
    try:
        status = headers_dict['Status']
    except KeyError:
        status = '200 OK'
    start_response(status, [(k, v) for k, v in headers_dict.items()])
    return [bytes(response.body())]

# Instantiate the server
httpd = make_server (
    'localhost', # The host name
    8051, # A port number where to wait for the request
    application # The application object name, in this case a function
)

print("Listening to http://localhost:8051 press CTRL+C to quit")

def signal_handler(signal, frame):
    """Exit QGIS cleanly"""
    global qgs_app
    print("\nExiting QGIS...")
    qgs_app.exitQgis()
    sys.exit(0)

signal.signal(signal.SIGINT, signal_handler)

httpd.serve_forever()


The post A little QGIS3 Server wsgi experiment first appeared on Open Web Solutions, GIS & Python Development.

QGIS layouts rewrite – progress report #1

Following our recent successful QGIS Layout and Reporting Engine crowdfunding campaign, we’ve been hard at working ripping up the internals of the QGIS 2.x print composer and rebuilding a brand new, shiny QGIS layouts engine. This is exciting work – it’s very satisfying to be able to cleanup a lot of the old composer code in QGIS and take opportunities along the way to fix long standing bugs and add new features.

While it’s not ready for daily use yet, there’s already been a lot of interesting changes which have landed in the layouts work as a result of this campaign. Let’s take a look at what’s been implemented so far…

  • We’ve added support for different measurements units all throughout layouts. While this means it’s now possible to set page sizes using centimeters, inches, pixels, points, etc, it goes much deeper than just that. In layouts, everything which has a size or position can take advantage of this unit support. So you can have page sizes in centimeters, but a map item with a size set in points, and positioned in millimeters! Having pixels as a unit type makes creation of screen-based layouts much easier – even right down to pixel perfect positioning and sizing of items…
  • Page handling has been totally reworked. Instead of the single “number of pages” control available in QGIS 2.x, layouts have complete flexibility in page setup. It’s now possible to have a layout with mixed page sizes and orientations (including data defined page size for different pages in the layout!). 
  • A revised status bar, with improved layout interaction widgets. We’ve also taken the opportunity to add some new features like a zoom level slider and option to zoom to layout width:
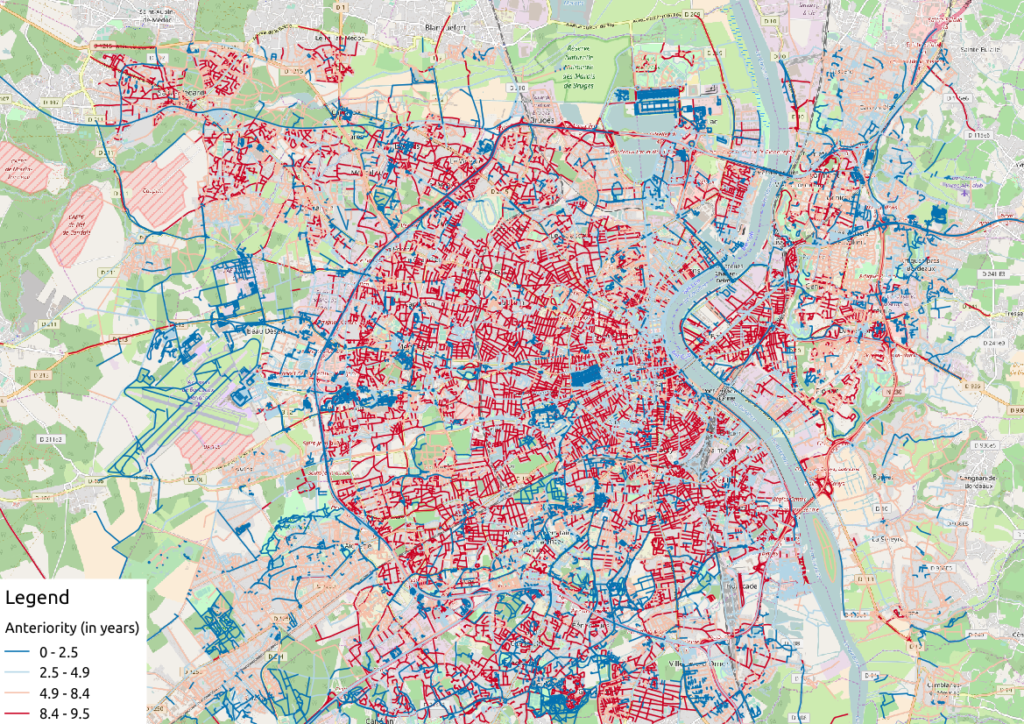
  • Layout interaction tools (such as pan/zoom/insert item/etc) have been reworked. There’s now a much more flexible framework for creation of layout tools (based off the main QGIS map canvas approach), which even allows for plugins to implement their own layout interaction tools! As part of this we’ve addressed a long standing annoyance which meant that creating new items always drew the “preview” shape of the new item as a rectangle – even for non-rectangular items. Now you get a real shape showing exactly how the created item will be sized and positioned:
  • On the topic of plugins – the layout branch has full support for plugin-provided item types. This means that QGIS plugins can create new classes of items which can be added to a layout. This opens the door for plugins allowing charts and visualisations which take advantage of all the mature Python and JS charting libraries! This is a really exciting change – in 2.x there was no way for plugins to extend or interact with composer, so we’re really keen to see where the community takes this when 3.0 is released.
  • We’ve ported another feature commonly found in illustration/DTP applications. Now, when you’re creating a new item and just click in your layout (instead of click-and-drag), you get a handy dialog allowing you to specify the exact position and dimensions for the created item. You can again see in this dialog how layouts have full support for units for both the position and size:
  • Another oft-requested feature which we’ve finally been able to add (thanks to the refactored and cleaned code) is a context menu for layouts! It’s currently quite empty, but will be expanded as this work progresses…
  • Snapping to guides and grids has been reworked. We’ve added a new snapping marker to show exactly were items will be snapped to:
  • Snapping to guides now occurs when creating new layout items (this didn’t happen in Composer in 2.x – only snapping to grids occurred when drawing new items).
  • The snapped cursor position is shown in status bar whenever a snapped point will be used, instead of the unsnapped position.
  • Unlike in Composers in QGIS 2.x, Layouts in 3.0 adopt the standard UX of dragging out rulers to create guide lines (instead of clicking on a ruler position to create a new guide). Creation of a horizontal guide is now done by grabbing the top ruler and dragging it down, and a vertical guide is created by grabbing the left ruler and dragging it out to the layout.
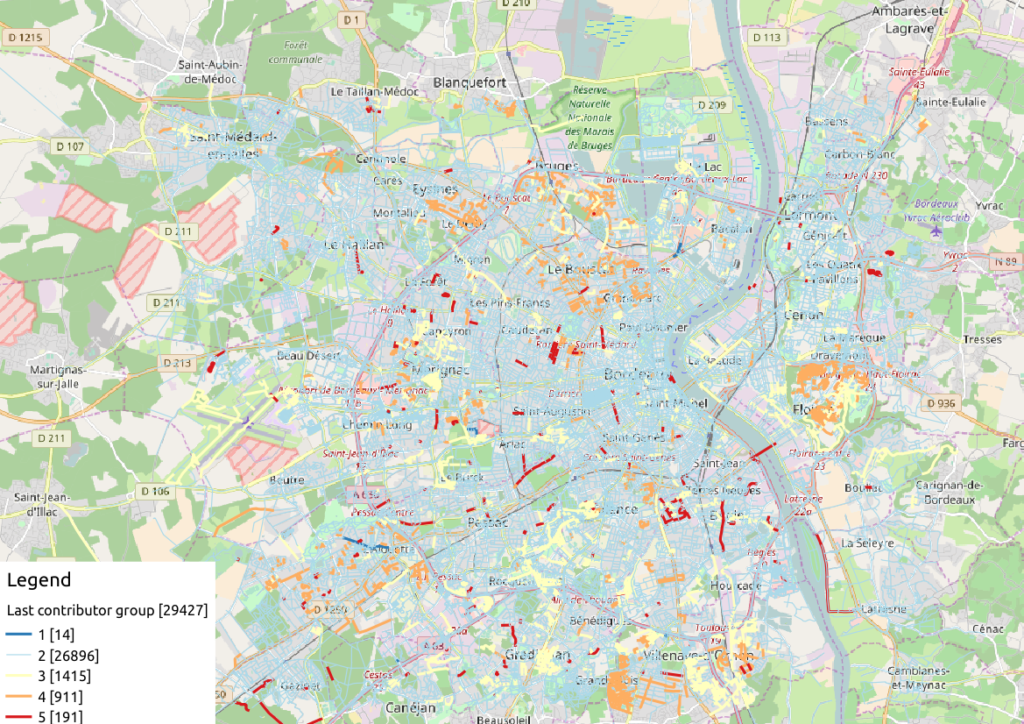
  • Better feedback is given in the ruler when a guide can be dragged. We now show guide positions in the rulers, and give an indication (via mouse cursor change) when these guides can be repositioned by click-and-drag.
  • Another very exciting change is the addition of a new “Guide Manager”. The guide manager allows numeric modification of existing guides and creation of new guides. Finally it’s possible to position guides at exact locations! Again, you can see the full support for layout units in place here – guides can be positioned using any available unit.
  • There’s also a handy new shortcut in the Guide Manager to allow applying the guides from the current page to all other pages in your layout.
  • We’ve refined the snapping logic. In Composer in QGIS 2.x,  grids would always take precedence whenever both a grid and guide were within tolerance of a point. Now, guides will always take precedence – since they have been manually set by users we make the assumption that they have been explicitly placed at highly desirable snapping locations, and should be selected over the general background grid. Additionally, grid snapping was previously only done if BOTH the x and y of the point could be snapped to the grid. We now snap to the nearest grid line for x/y separately. This means if a point is close to a vertical grid line but not a horizontal one it will still snap to that nearby vertical grid line.
  • Lastly, we’ve added a handy context menu to the rulers:

This is just a taster of the great new functionality coming in QGIS 3.0. This is all a direct result of the forward-thinking investments and generosity of the backers in our QGIS Layout and Reporting Engine crowdfunding campaign. Without their contributions, none of this would be possible – so our thanks go out to those organisations and individuals once again!

Stay tuned for more updates as the work continues…


  • <<
  • Page 52 of 141 ( 2819 posts )
  • >>

Back to Top

Sustaining Members