Related Plugins and Tags

QGIS Planet

Report from the Essen dev meeting

From 28th April to 1st May the QGIS project organized another successful developer meeting at the Linuxhotel in Essen, Germany. Here is a quick summary of the key topics I’ve been working on during these days.

New logo rollout

It’s time to get the QGIS 3 logo out there! We’ve started changing our social media profile pictures and Website headers to the new design: 

Resource sharing platform 

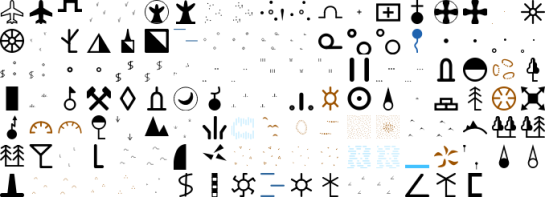
In QGIS 3, the resource sharing platform will be available by default – just like the plugin manager is today in QGIS 2. We are constantly looking for people to share their mapping resources with the community. During this developer meeting Paolo Cavallini and I added two more SVG collections:

Road sign SVGs by Bertrand Bouteilles & Roulex_45 (CC BY-SA 3.0)

SVGs by Yury Ryabov & Pavel Sergeev (CC-BY 3.0)

Unified Add Layer button

We also discussed the unified add layer dialog and are optimistic that it will make its way into 3.0. The required effort for a first version is currently being estimated by the developers at Boundless.

TimeManager

The new TimeManager version 2.4 fixes a couple of issues related to window resizing and display on HiDPI screens. Additionally, it now saves all label settings in the project file. This is the change log:

- Fixed #222: hide label if TimeManager is turned off
- Fixed #156: copy parent style to interpolation layer
- Fixed #109: save label settings in project
- Fixed window resizing issues in label options gui
- Fixed window resizing issues in video export gui
- Fixed HiDPI issues with arch gui

Call for presentations and workshop proposals: QGIS Conference 2017

NOTE: Deadline for proposals is May 15 2017

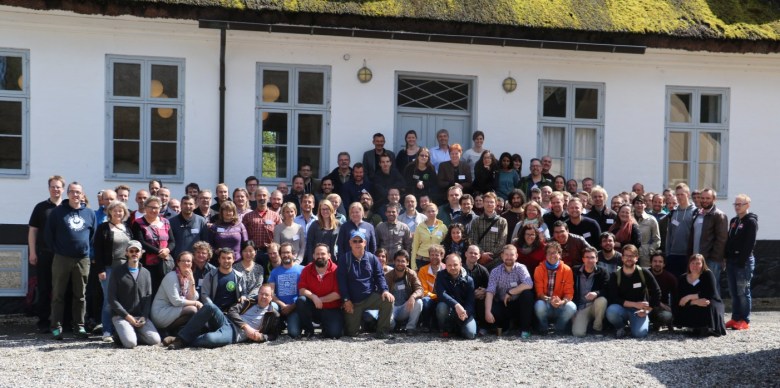
We are going back to Nødebo! Each year we combine one of our QGIS Developer Meetings with a User Conference. The User Conference is a great opportunity for QGIS users to meet developers and share their experiences – both with developers and with other users. Our first ever User Conference was held in Nødebo, Denmark in 2015 and we are thrilled to be going back to the beautiful venue at the University of Denmark’s Forest and Landscape College.

1k0a4924

The user conference will be combined with the QGIS Developer Meeting and a summer school event, with the first week being focussed on the User Conference, the intermediate weekend on the QGIS Hackfest and the second week on the Summer School. The event will run from the 2nd of August through to the 11th of August 2017.

We would like to invite those who are interested in presenting a talk to apply now (NOTE: Deadline for proposals is May 15 2017). There are four kinds of contributions you can make (see the conference website for full details):

  • 20 minute ‘lightning’ talks
  • 1-2 hour short workshops
  • half and full day workshops
  • posters (which should be presented in the form of a map)

We have identified a number of themes for the User Conference:

  • QGIS Software Development
  • New Technology
  • Business
  • Government/Municipality
  • Science
  • Education

Presenters of full day workshops are eligible for a EUR 1000 reimbursement to offset their costs. You can find out more details at the conference web page (as well as registering your talk / presentation):

https://qgis2017.wordpress.com/presentations/

We are looking forward to seeing a great programme come together for the conference!


QGIS Grant Programme #2 Results

We are extremely pleased to announce the winning proposals for our 2017 QGIS.ORG grant programme. Funding for the programme was sourced by you, our project donors and sponsorsNote: For more context surrounding our grant programme, please see:

Our intent with the QGIS.ORG Grant Programme is to support work from community that would typically not be funded by client/contractor agreements, and that contributes to the broadest possible swathe of our community by providing cross-cutting, foundational improvements to the QGIS Project.

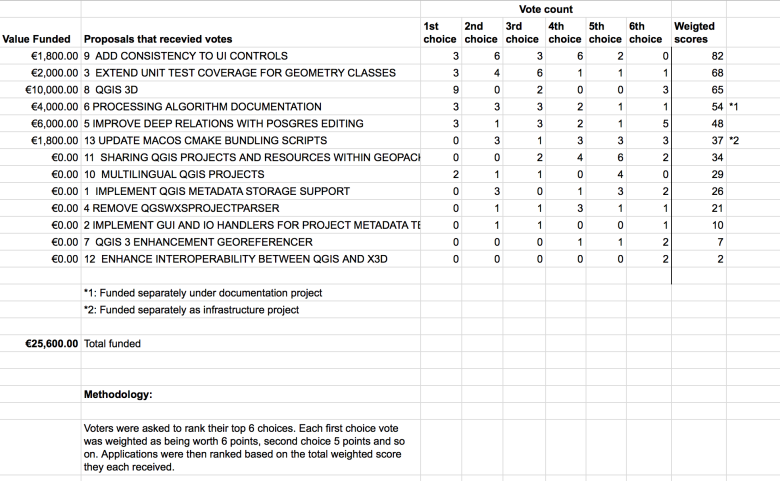
Voting to select the successful projects was carried out by our QGIS Voting Membership. Each voting member was allowed to select up to 6 of the 13 submitted proposals by means of a ranked selection form. The full list of votes are available here (on the first sheet). The second sheet contains the calculations used to determine the winner (for full transparency). The table below summarizes the voting tallies for the proposals:
Screen Shot 2017-04-30 at 3.23.08 PM

A couple of extra notes about the voting process:

  • The PSC has an ongoing program to fund documentation so elected to fund the processing documentation work separately from the grant programme (note *1).
  • Voting was carried out based on the technical merits of the proposals and the competency of the applicants to execute on these proposals.
  • No restrictions were in place in terms of how many proposals could be submitted per person / organization, or how many proposals could be awarded to each proposing person / organization.
  • Because of the importance of having good packaging systems on each of the three major platforms, the PSC elected to additionally fund the work on MacOS bundling scripts (note *2).
  • Although the budget for the grant programme was €20,000.00, the total amount for the four winning proposals is €19,800.00, with an additional €5, 800.00 being made available to support the processing work and and MacOS packaging work.
  • Voting was ‘blind’ (voters could not see the existing votes that had been placed).

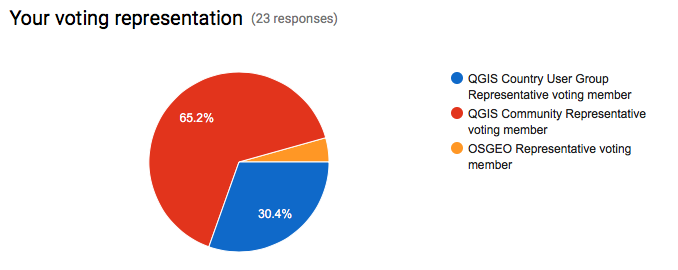
We had great participation in the voting process. Of the 27 voting members, 23 registered their votes.
Screen Shot 2017-04-20 at 4.11.45 PM
On behalf of the QGIS.ORG project, I would really like to thank everyone who submitted proposals for this call. There were many interesting proposals that I believe would be of great benefit to QGIS and I hope others perusing the proposals list will use their initiative and funding interesting proposals independently if they can.

Below you can find the detailed proposals of the successful applications – we look forward to seeing the results of their work land in the code base soon!

Details of the approved grant proposals


9 ADD CONSISTENCY TO UI CONTROLS

Proposer: Nyall Dawson

Amount: €1800

Details: Across the QGIS UI, numerous inconsistencies exist in the way different properties like opacity and rotation are exposed to users. These inconsistencies make QGIS harder to use, as behavior from one dialog differs to the behavior in another dialog. Some examples of this include:

  • Rotation of labels is done in the opposite direction in labeling to symbology. Accordingly, an equal rotation value will result in different rotation between labels and symbols.
  • Scales are inconsistently presented, with use of both the scale numerator and denominator in different dialogs. “Minimum” and “Maximum” scales also vary between dialogs, with some dialogs using “minimum” scale as the largest scale and some using “minimum” as the smallest scale. The labeling scale based visibility controls are the biggest offenders here.
  • Controls vary between specifying “opacity”, “transparency” and “alpha”. While these all have similar results, users must adopt values to map “opacity” to “transparency” in different dialogs. This is further compounded by different ranges used for each (eg 0-100%, or 0-255).

Due to the usual API freeze, it has not been possible to fix these discrepancies. The current API break introduced with version 3.0 allow a window for addressing these issues and standardizing behavior and API.

Despite the benefits in providing a consistent UI, the work involved in standardizing is fiddly (careful attention must be paid to not breaking existing projects) and repetitive, and unlikely to be undertaken by developers on a volunteer basis.  Furthermore it is highly unlikely that a commercial organisation could justify sponsoring UI standardisation efforts. Without grant funding it is unlikely that these issues will be addressed during the 3.0 development cycle, and the inconsistencies would remain for the lifetime of QGIS 3.x.

In this proposal I will:

  • convert all “transparency” controls to “opacity” controls, and consult with the community to determine the ideal value range presented (0-100% or 0-255) before making all opacity controls use the same range.
  • Ensure that rotation always operates in the same direction.
  • Fix the labeling scale ranges to use the same scale range definitions as layer visibility
  • As much as possible, automatically upgrade existing projects so that they open in QGIS 3.0 without any loss of transparency/rotation/scale settings
  • (As much as possible without large refactoring), adapt the PyQGIS API so for consistent naming and use of opacity/rotation and scale setting/getting methods. Making the API consistent makes scripting QGIS and writing plugins easier.

This proposal relates to the issues described at:

History: No work has currently been undertaken in this regard.

Qualifications: I am currently one of the most active QGIS developers, with a long history of quality contributions to the project. I’m passionate about seeing QGIS 3.0 address these kinds of long standing UI issues which detract from QGIS’ otherwise professional image and ease of use.

Implementation Plan:  The work will be undertaken prior to the QGIS 3.0 feature freeze period.

Proposal Link:


3 EXTEND UNIT TEST COVERAGE FOR GEOMETRY CLASSES

Proposer: Nyall Dawson

Amount: €2000

Details: Since QGIS 2.8, there has been an increased focused on creation of quality automated regression (“unit”) tests designed to flag issues in code before the code is introduced to the QGIS codebase. The increase in stability of recent QGIS versions can be directly attributed to this growth in unit testing. Despite this, many areas of the QGIS codebase remain with little or no unit test coverage.

One critical area which has insufficient unit tests is the geometry classes. The geometry classes form the basis of all geometry interpretation, algorithms, and rendering within QGIS. In order to provide stable QGIS releases, it is crucial that these fundamental classes are rock-solid, efficient, and do not suffer regressions between releases.

Some years ago (shortly after the introduction of the new geometry engine, in which support for Z/M values and curved geometries was added) I added full test coverage for the Point and Linestring classes, and partial coverage for the Polygon class. Unfortunately, writing geometry tests is tricky and time consuming. There’s many corner cases with unusual or invalid geometries which need to be tested. The time commitment required prevented me from writing additional tests, and to date the remaining classes (including multi geometries and all curved geometry types) have little or no test coverage.

This proposal covers writing additional unit tests to cover all the remaining geometry classes.

It is important to note that unit tests do NOT ensure bug free software. Unit tests only protect existing logic and avoid regressions when the covered parts of the code base are changed in future releases. Despite this disclaimer, the process of creating unit tests usually stress-tests existing code and in itself CAN reveal existing bugs. This was certainly the case when the existing tests for Point and Linestring classes were added – creation of the tests alone resulted in many fixed bugs and stabler Point and Linestring geometry handling.

History: This work would continue on from work I begun a number of years ago to provide 100% unit test coverage for the base geometry classes.

Qualifications: I have a long history of quality contributions to the QGIS project, and am currently one of the most prolific committers to the QGIS codebase. I have a long history with adding unit tests to QGIS and advocating for their increased usage amongst developers.

Implementation Plan: This work would be targeted to the QGIS 3.0 release, and would be committed to the codebase prior to the feature freeze/bug fixing period leading up to the 3.0 release.

Proposal Link:


8 QGIS 3D

Proposer: Martin Dobias

Amount: €10000

Details: I would like to propose a project that introduces 3D rendering capabilities in QGIS.
To summarize the planned work, the following features can be expected:

  • 2D view of map canvas rendered on the graphics hardware (GPU) allowing smooth zooming and panning of map view
  • 3D perspective view of the map
  • generation of 3D terrain model from DEM (digital elevation model) layers
  • map layers rendered as a texture on top of the 3D terrain
  • support for true 3D rendering of vector layers rather than having just flat appearance
  • map view widget that is dockable in the main window and synchronized with the main map canvas
  • support for picking (identification) of objects in 3D view and X/Y/Z coordinate display
  • support for 3D map view in map composer

The overall target is to introduce an extensible framework for 3D map view within QGIS, so that in the future developers can add various 3D rendering techniques for map data, using custom geometries and materials (which may involve writing own vertex/fragment shaders), possibly even allowing multi-pass rendering for advanced effects (e.g. to render shadows cast by buildings with a particular sun position).
3D support in QGIS is not only about adding the extra dimension to the rendering: it is also about making it possible to use graphics hardware for rendering of map in 2D – making map browsing even more pleasant and faster at the same time. Rendering 2D maps with OpenGL also opens the door to various new graphical effects that would be otherwise very expensive

to achieve by using just CPU for map rendering.
This proposal does not assume addition of new geometry types like polyhedral surface (with read support for those) into QGIS – the aim of the work is to get 3D rendering engine running and new geometry types may be added at some point later.

State of the art

QGIS features very good 2D rendering capabilities, however its 3D support has been very limited. Prior work on 3D in QGIS includes:

  • Globe plugin – a C++ plugin developed by Matthias Kuhn and Sourcepole based on OpenSceneGraph and osgEarth libraries. OpenSceneGraph is a generic toolkit that provides higher-level abstraction on top of OpenGL, making it easier to develop 3D applications than directly using low-level OpenGL interfaces.OsgEarth project then builds on top of OpenSceneGraph and provides a toolkit for working with geographical data: it has a terrain engine that combines elevation layers into a terrain, applies textures from “image” layers and adds feature layers with true 3D objects.The plugin acts as a bridge from QGIS environment and feeds scene data into osgEarth to do the 3D rendering.
  • Qgis2threejs plugin – a Python plugin developed by Minoru Akagi. It is able to export QGIS project (with various configuration options) into a HTML page that uses three.js library to render map in 3D within web browser using WebGL.
  • Horao – developed by Oslandia. It is a standalone 3D viewer based on OpenSceneGraph that may be controlled by a QGIS plugin to display map from QGIS in 3D environment. It has explicit support for true 3D geometries in PostGIS.

While these projects solve some use cases for 3D rendering of map data, each of them have their own limitations. For example, osgEarth library used by Globe plugin has its own data access and rendering of vector features implementation, duplicating QGIS code and not having parity in their capabilities. Moreover it has been difficult over time to keep the build working on all platforms supported by QGIS. The main limitation of Qgis2threejs plugin is the fact that the 3D view is exported to web browser, so the user cannot use benefits of having 3D view tightly integrated with the rest of QGIS. The fact that Horao has a standalone viewer

application results in similar limitations as when using Qgis2threejs (although it has some degree of integration with QGIS application).

Proposed approach
Now that QGIS 3.0 is based on Qt5, we can use some of the great new functionality added recent releases of Qt5. In version 5.5, a new framework for working 3D graphics has been introduced and every major Qt5 release since has been adding more functionality, improving performance, compatibility and stability. The 3D support nicely integrates with the rest of the Qt framework, providing a familiar API and at the same time staying very generic and highly efficient.
The 3D framework provides high level abstractions just like other libraries (e.g. OpenSceneGraph, three.js). 3D scene is built with nodes (called entities) with various components (e.g. transformation, mesh, material).
The idea is to build 3D support in QGIS on top of the Qt 3D framework. From my initial tests of the framework this looks feasible and it will allow us to stick with Qt APIs without requiring extra dependencies.
The work can be divided into the following chunks of work:

  1. Rendering engine core: develop a framework that will do rendering of the map scene in 3D. The engine will have the responsibility of processing raster layers with elevation into a mesh geometry and texturing the mesh with map images rendered by the existing QGIS 2D rendering engine. The engine will support levels of detail (LOD) and tiling in order to be able to display high-resolution data in real time without having to load all the data into memory at the time of scene creation (which may be prohibitively expensive with more complex layers). 3D scene will be dynamically updated as user browses the map, keeping the amount of rendered triangles low while appropriate quality of the terrain for given zoom level.

All of the processing needs to be done in the background, so the user may freely browse the map and the scene will be continuously updated with data (changing between higher/lower detail when zooming, loading more data when moving map).

  1. Handling of user input: controller for camera that will make the camera fly on top of the map. Support for picking will be added to allow identification of objects in the map and display of coordinates at the mouse position.
  1. Integration with QGIS environment: dockable 3D map widget for the main window, synchronization with 2D map canvas, support for printing of 3D views in map compositions.
  1. Advanced 3D rendering techniques: interface that will allow adding new methods for data visualization in 3D and exploration of methods for rendering. By default map layers will be rendered into map image with the existing 2D map renderer – this interface will allow map layers to instead have 3D renderer associated which will provide entities with custom meshes and materials. As a result we will be able to achieve true 3D appearance of objects (e.g. point clouds, trees as 3D models, tesselation of polygons, buildings with extruded geometry and custom texture). Implementation of the advanced techniques is a task with nearly unlimited scope, so the idea is to develop a suitable interface and as the time will allow, implement some techniques.

History: For this proposal I have studied various sources:

  • looked into existing 3D viewer projects related to QGIS
  • explored Qt 3D framework
  • researched some academic papers regarding terrain generation and vector data display

As a proof of concept, I have created a simple prototype in C++ using Qt 3D framework. It displays aerial imagery on top of a terrain model created from a raster layer (DEM) and allows simple camera control. The code is available here: https://github.com/wonder-sk/qgis3d

Qualifications: I have been a core QGIS developer for more than 10 years and I have a very good knowledge of QGIS codebase, especially the existing 2D map rendering pipeline.
Previously when working at the university, on a project for stereo matching (creation of point cloud out of a pair of images) I worked on visualization of 3D data using OpenGL.
Implementation Plan: The plan is to work on the project between May and July 2017. As of now, the plan for QGIS releases (according to the mail from Paolo) is that QGIS 3.0 will have feature freeze in July 2017 and final release in September 2017. If nothing changes in the QGIS release schedule in meanwhile, the 3D support could be integrated into QGIS master branch before the feature freeze and thus released in QGIS 3.0.
If the project would be accepted, the first step will be to develop a prototype of the 3D rendering engine, then prepare a more detailed architecture proposal as a QEP and continue the implementation once the QEP gets accepted by the community. The work progress should be available on a branch in GitHub for anyone interested.
Proposal Link: https://github.com/wonder-sk/qgis3d


6 PROCESSING ALGORITHM DOCUMENTATION

Proposers: Matteo Ghetta, Alexander Bruy

Amount: €4000

Details: This proposal aims to improve the existing Processing algorithms documentation. With the pull request https://github.com/qgis/QGIS/pull/3911 it is possible to add external links for the documentation (both local and remotes). However the effective use of the pull request is not yet included in Processing.

With this proposal the existing code will be incorporated in Processing, allowing to have a Short Help tab (the existing one on the right of the Processing algorithm window) and a Long Help tab (next to the Log tab).

The Short Help tab will be collapsible in order to have a bigger window for the algorithm parameters, while the Long Help tab will point to the on-line existing documentation of Processing for each algorithm (http://docs.qgis.org/testing/en/docs/user_manual/processing_algs/index.html).

The default link of the on-line documentation will be added in the QGIS Settings (thanks to the pull request already merged) in order to have the standard documentation visible but to let the user the choice to overwrite it and load custom paths.

In addition to the code part, this proposal aims also to document the GDAL/OGR provider and the QGIS core algorithms. Existing documentation will be reviewed and pictures will be added when useful, while for algorithm not yet documented, the help will be written from scratch with description and additional pictures.

Currently there are:

  • 49 GDAL/OGR total algorithms, 35 to enhance with pictures, 14 to write from scratch
  • 154 QGIS algorithms, 38 to enhance, 116 to write from scratch

This means a total of 73 algorithm to enhance and 130 to write from scratch.

History: The pull request https://github.com/qgis/QGIS/pull/3911 is already merged and it is worth to make it effective to have nice, rich and translatable documentation for the Processing algorithms.

Qualifications: Matteo Ghetta: working since the release 2.0 on the documentation and made several improvements and pull request to both documentation and Processing code.

Alexander Bruy: core developer since 2010, co-maintainer of the QGIS Processing framework.

Implementation Plan: The code and the documentation will be ready for the QGIS 3 release.

Proposal Link:


5 IMPROVE DEEP RELATIONS WITH POSTGRES EDITING

Proposer: Régis Haubourg

Amount: €6000

Details: QGIS has reached a mature level and offers now a very good framework to create professional applications. One of the main reasons is that QGIS is a very strong client for spatial databases, and in particular with PostgreSQL and postGIS for which it was initially created.

Since version 2.14, QGIS offers the not-so-well-known ability to handle transaction groups, which means it can instantly evaluate triggers on database side, and refresh all layers in the same transaction. This is a big win for usability, but some drawbacks glitches remain, such as the lack of the undo/redo edit buffer, a very raw way of saving (ie quitting edition session) or having the legend cluttered by so many edit symbols (a pen symbol). Current proposal is to go a step beyond to make QGIS even better for PostgreSQL by achieving the following targets:

1 Restore an undo /redo feature by taking advantage of PostgreSQL. If possible we will try to take advantage of PostgreSQL named Savepoints.

2 Allow to have some layers not switching to edit mode in QGIS,  even if they belong to the same connection. These layers will still benefit from the instant refresh, but won’t clutter the legend with the edit pen symbol everywhere, nor risk to load QGIS snapping cache for nothing. A UI for those settings could be an evolution of the current “identify layer” list in the project properties.

3 We would like to submit a mechanism to allow converting error messages raised by the provider, like a RAISE from postgres, into custom user oriented message. Say for instance, instead of a “provider error – duplicate key for… “, QGIS project could be tuned to display first “You tried to insert a feature using the same identifier as another one”.

The error message list and regexp rules would be optionally stored in qgis project or read from a datasource table (for instance when error messages rewrites are shared by other applications). The original error message would be still avaiblable by expanding the details of the messageBar and in the general message log.

4 Cherry on cake point, we wish to have QGIS take advantage of PostgreSQL NOTIFY signals to trigger behavior in QGIS when something changes in the database (see https://www.postgresql.org/docs/9.5/static/sql-notify.html) . A first implementation proposal is to allow a map canvas refresh, but we can imagine really dynamic applications driven by the database events by converting NOTIFY messages into QGIS signals (oh yeah!).

History: In our team, we already use transaction groups for production tools and that is much appreciated. We already use some python logic to catch error message and convert them to more user oriented ones. We frequently develop applications where QGIS is linked with heavy database containing most of the intelligence. Having a really interactive edition process, speaking the same langage as average users, and being able to be triggered from database process will unleashed many possible applications.

Qualifications: Oslandia has three QGIS developers, two of them being core comiters and high  skills with Postgres and Postgis (core comiter too). We believe that developing using thick databases is a major strength of QGIS, and we have great fun getting involved in that area of the code 😉

Implementation Plan:  We currently are quite involved in QGIS 3 server refactoring and major changes such as Auxiliary Storage for project or core solutions for label connectors. We also are involved in applications build on top of QGIS for Water management like QWAT or QGEP. Such changes would benefit immediatly to those project. Our target is to provide those improvements with all necessary unit tests for 3.0 release.

Proposal Link: coming soon..


13 UPDATE MACOS CMAKE BUNDLING SCRIPTS


Proposer: Larry Shaffer


Amount: €1800


Details: Currently, the macOS bundling routines (to create a self-contained QGIS.app application) in CMake scripts where created by William Kyngsburye many years ago. Since then, CMake has added many features for bundling, e.g. BundleUtilities ( https://cmake.org/cmake/help/v3.0/module/BundleUtilities.html), that handle similar functionality to what has been arduously maintained in the CMake scripts. While the current setup does function, it is quite antiquated and adding any new QGIS dependencies to be bundled is an error-prone ordeal. I propose to fully update the bundling routines to leverage modern CMake capabilities, since building on macOS usually uses the latest CMake versions. Once completed, anyone with appropriate dependencies should be able to produce a production-ready QGIS.app bundle, including the QGIS project itself.


History: I will first build upon the existing work to ensure there is a minimal bundled QGIS.app, then completely refactor the same functionality using a modern CMake code workflow.


Qualifications: I have extensive knowledge in CMake and frequently utilize it in my work for my employer, Boundless Spatial. I have already completed a fully bundled QGIS.app distribution by my employer (similar to the first phase of the proposed work here), though Boundless now uses a different installation approach. I have been working for years on the OSGeo4Mac project in anticipation of producing better CMake bundling routines, to ensure the QGIS project can independently produce its own macOS distributions.


Implementation Plan: Basic work will follow these steps:

  • Append minimal bundling to existing CMake setup, so there is a least a functioning bundling routine, regardless of whether the proposed work is accomplished in time for the major next release.
  • Ensure the QGIS.app bundle is code-signed
  • Create a new methodology, based upon CMake’s BundlesUtilities, *in-line* next to the existing CMake routines, so both can be used, until there is a valid replacement.
  • Focus on minimal bundling, then add GRASS
  • Continue extending bundling routines to include major Processing providers, e.g. OTB, Saga, TauDEM, etc.
  • Ensure new method’s QGIS.app is properly code-signed
  • Enable bundling on Travis CI infrastructure, via Travis’ cron jobs, thereby adding the capability for the QGIS project to produce fully bundled nightlies of macOS builds.
  • Once new method represents a full replacement, old method will be removed, not just deprecated


Intended completion is in time for QGIS 3.0 release and packaging efforts.


Since the new method does not affect any existing code, as soon as useable functionality is achieved, it will be merged directly into master, then further code committed as work progresses.

Proposal Link: None at this time. Should I consider a QEP? Not many developers beyond the few existing packagers and experimenters would be involved. I would prefer to write a blog post after the work is completed, though post to the QGIS dev mailing list the intention to do the work, if this proposal is granted.

Logo Evolution – Call to User Groups

With QGIS 3.0 moving closer, it is also time to get the new QGIS logo out there.

QGIS logo evolution

We are therefore asking all our user groups to join the project redesign efforts. Please have a look at your user group logo and bring it in line with the QGIS 3.0 design.

We have compiled a Visual Style Guide which provides all logo materials, including fonts that you can use for your own user group logo. Here is an example of how the Italian user group has updated their logo:

Italian user group redesigned

We are looking forward to seeing all your creative efforts!


Straight and curved arrows with QGIS

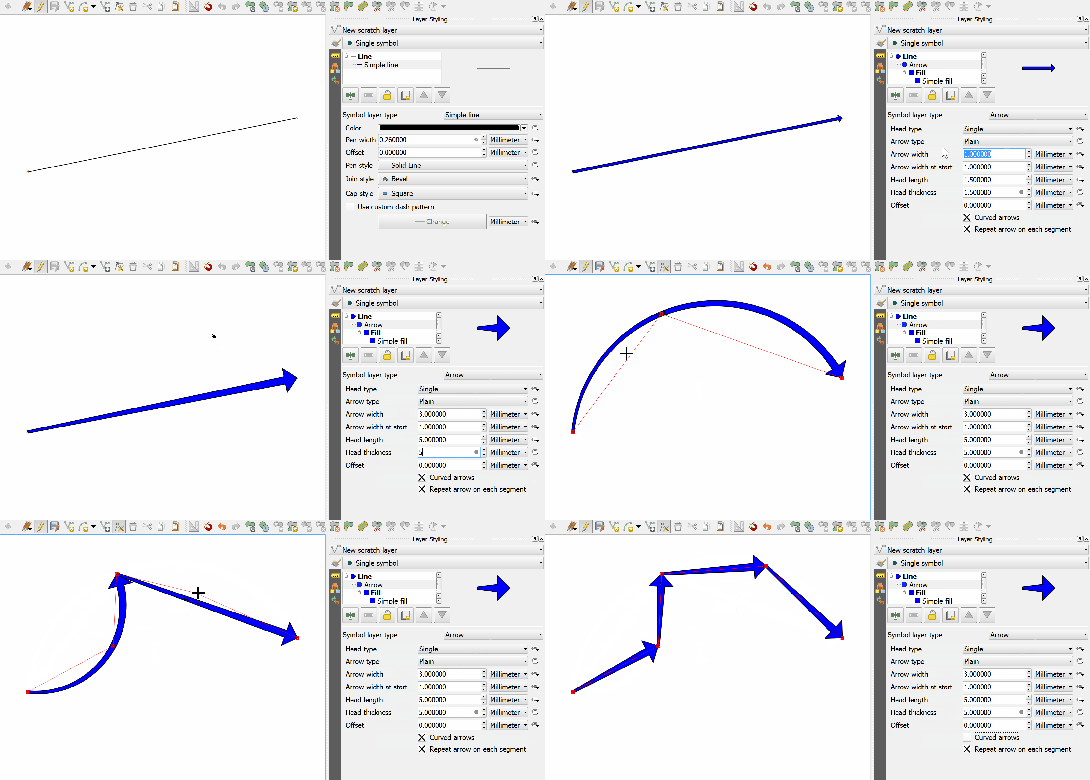
After my previous posts on flow maps, many people asked me how to create the curved arrows that you see in these maps.

Arrow symbol layers were introduced in QGIS 2.16.

The following quick screencast shows how it is done. Note how additional nodes are added to make the curved arrows:


About label halos

A lot of cartographers have a love/hate relationship with label halos. On one hand they can be an essential technique for improving label readability, especially against complex background layers. On the other hand they tend to dominate maps and draw unwanted attention to the map labels.

In this post I’m going to share my preferred techniques for using label halos. I personally find this technique is a good approach which minimises the negative effects of halos, while still providing a good boost to label readability. (I’m also going to share some related QGIS 3.0 news at the end of this post!)

Let’s start with some simple white labels over an aerial image:

These labels aren’t very effective. The complex background makes them hard to read, especially the “Winton Shire” label at the bottom of the image. A quick and nasty way to improve readability is to add a black halo around the labels:

Sure, it’s easy to read the labels now, but they stand out way too much and it’s difficult to see anything here except the labels!

We can improve this somewhat through a better choice of halo colour:

This is much better. We’ve got readable labels which aren’t too domineering. Unfortunately the halo effect is still very prominent, especially where the background image varies a lot. In this case it works well for the labels toward the middle of the map, but not so well for the labels at the top and bottom.

A good way to improve this is to take advantage of blending (or “composition”) modes (which QGIS has native support for). The white labels will be most readable when there’s a good contrast with the background map, i.e. when the background map is dark. That’s why we choose a halo colour which is darker than the text colour (or vice versa if you’ve got dark coloured labels). Unfortunately, by choosing the mid-toned brown colour to make the halos blend in more, we are actually lightening up parts of this background layer and both reducing the contrast with the label and also making the halo more visible. By using the “darken” blend mode, the brown halo will only be drawn for pixels were the brown is darker then the existing background. It will darken light areas of the image, but avoid lightening pixels which are already dark and providing good contrast. Here’s what this looks like:

The most noticeable differences are the labels shown above darker areas – the “Winton Shire” label at the bottom and the “Etheridge Shire” at the top. For both these labels the halo is almost imperceptible whilst still subtly doing it’s part to make the label readable. (If you had dark label text with a lighter halo color, you can use the “lighten” blend mode for the same result).

The only issue with this map is that the halo is still very obvious around “Shire” in “Richmond Shire” and “McKinlay” on the left of the map. This can be reduced by applying a light blur to the halo:

There’s almost no loss of readability by applying this blur, but it’s made those last prominent halos disappear into the map. At first glance you probably wouldn’t even notice that there’s any halos being used here. But if we compare back against the original map (which used no halos) we can see the huge difference in readability:

Compare especially the Winton Shire label at the bottom, and the Richmond Shire label in the middle. These are much clearer on our tweaked map versus the above image.

Now for the good news… when QGIS 3.0 is released you’ll no longer have to rely on an external illustration/editing application to get this effect with your maps. In fact, QGIS 3.0 is bringing native support for applying many types of live layer effects to label buffers and background shapes, including blur. This means it will be possible to reproduce this technique directly inside your GIS, no external editing or tweaking required!

QGIS Composer Rewrite and Layout Engine crowdfund launched!

At North Road we believe that crowdfunding is a sustainable way to maintain and enhance open source software, like the QGIS open source GIS package. We’ve run a number of successful crowdfunding campaigns in the past, including support in QGIS for live layer effects, a point cluster renderer, and a unique value renderer for raster layers.

Now, we’re proud to announce our latest crowd funding endeavour, and our biggest to date, the QGIS Layout and Reporting Engine Campaign.

This campaign covers stage 1 of a large, ongoing project to modernise and expand on QGIS’ print composer and layout facilities. Over time QGIS’ composer functionality has grown extensively and now is capable of creating flexible, high quality cartographic outputs. However, we’ve now hit a limit where the current code architecture is prohibiting further improvements and important fixes. In order to add a reporting framework to QGIS, it is necessary for us to refactor and improve large sections of the composer code.

If this campaign is successful, we’ll be adding flexible report generation features to QGIS and cleaning up all the existing composer code. As part of these clean up, we’ll be taking the opportunity to tackle a number of current limitations which cannot be addressed in the current composition code:

  • Layouts will become unit aware, allowing for item placement and properties using millimetres, inches, pixels, centimetres, points, etc.
  • Layouts will have the ability to include mixed page sizes and orientations.
  • Plugins will be able to create custom composer item types (eg allow utilisation of 3rd party graphing and visualisation libraries!).
  • Individual layout items can be rasterised without affecting the rest of the layout. For instance, a map which requires rasterisation due to its use of blend modes will not require all other layout items (such as headings, legends, etc) to be rasterised. This will greatly benefit PDF outputs for complex map layouts.
  • The code refresh will allow more extensive use of data defined layout item properties.
  • A render caching system will be implemented for items, speeding up use of the layout designer and also paving the way for use of live paint effects on layout items (eg dynamic drop shadows).

Full details on what we have planned are available here: QGIS Layout and Reporting Engine Campaign.

To make it possible we need 30,000€ pledged before 31 May 2017. You can help make this a reality by supporting the campaign or by sharing the campaign page and increasing exposure to the campaign. Updates to follow!

Better river styles with tapered lines

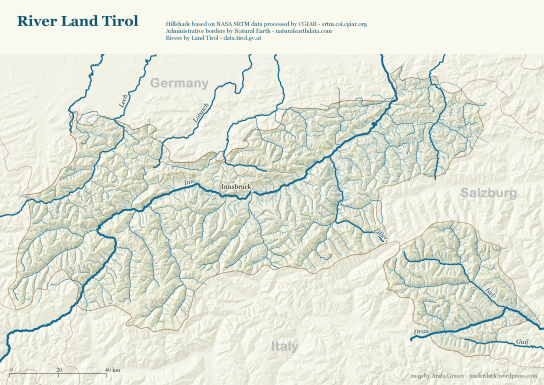
In 2012 I published a post on mapping the then newly released Tirol river dataset.

In the comments, reader Michal Zimmermann asked:

Do you think it would be possible to create a river stream which gains width along its way? I mean rivers are usually much narrower on their beginnings, then their width increases and the estuary should be the widest part, right?

For a long time, this kind of river style, also known as “tapered lines” could only be created in vector graphics software, such as Inkscape and Illustrator.

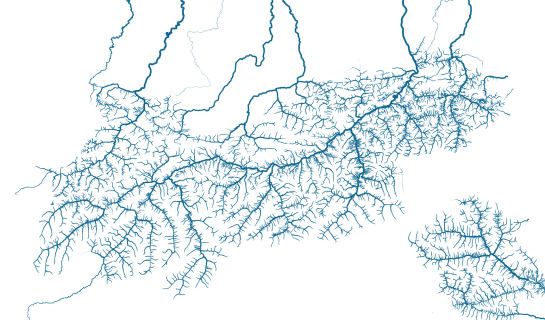
With the help of geometry generators, we can now achieve this look directly in QGIS:

Data cc-by Land Tirol

In the river dataset published by the state of Tirol, all rivers are digitized in upstream direction. For this styling to work, it is necessary that the line direction is consistent throughout the whole dataset.

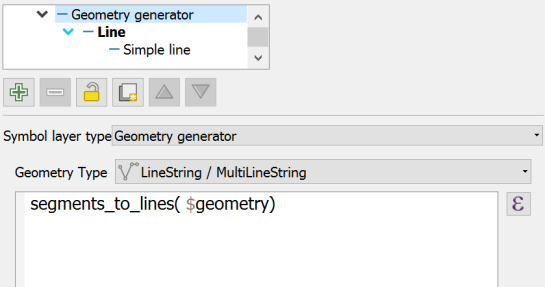
We use a geometry generator symbol layer to split the river geometry into its individual segments:


Then we can use the information about the total number of segments (accessible via the expression variable @geometry_part_count) and the individual segment’s number (@geometry_part_num) to calculate the segment’s line width.

The stroke width expression furthermore uses the river category (GEW_GRKL) to vary the line width depending on the category:

CASE 
WHEN "GEW_GRKL" = '< 10 km2 Fluss' THEN 0.2
WHEN "GEW_GRKL" = '10 km2 Fluss' THEN 0.4
WHEN "GEW_GRKL" = '100 km2 Fluss' THEN 0.6
WHEN "GEW_GRKL" = '1.000 km2 Fluss' THEN 0.8
ELSE 1.0
END 
* ( 1- ( @geometry_part_num /  @geometry_part_count ))

If the rivers are digitized in downstream direction, you can simply remove the 1- term.

Happy mapping!


Quick guide to geometry generator symbol layers

Geometry generator symbol layers are a feature that has been added in QGIS 2.14. They allow using the expression engine to modify geometries or even create new geometries while rendering.

Geometry generator symbol layers make it possible to use expression syntax to generate a geometry on the fly during the rendering process. The resulting geometry does not have to match with the original geometry type and we can add several differently modified symbol layers on top of each other.

The latest version of the QGIS user manual provides some example expressions, which served as a basis for the following examples:

Rendering the centroid of a feature

To add a geometry layer representing feature centroids, we need to set the geometry type to Point / Multipoint and enter the following expression:

centroid( $geometry )

It is worth noting that the correct geometry type has to be set manually. If a wrong type is set, the symbol layer can not be rendered.

Drawing buffers around features

Buffers are an example of a polygon geometry generator layer. The second parameter of the buffer function defines if the buffer is generated outside (for positive values) or inside (for negative values) of the feature. The value has to be provided in the layer’s CRS units, in this case, that means an inner buffer of 0.005 degrees:

buffer( $geometry, -0.005 )

Creating a line between features in different layers

The following expression creates lines from all district centroids (as shown in the first example) and a feature from the Citybike layer where the STATION attribute value is ‘Millennium Tower’:

make_line( 
  centroid( $geometry ),
  geometry( get_feature( 'Citybike', 'STATION', 'Millennium Tower' ) ) 
)

More advanced examples

Using these basic examples as a starting point, geometry generators open a wide field of advanced symbology options. For example, this sector light style presented on GIS.Stackexchange or my recently introduced conveyor belt flow style:


Update on the QGIS Grant Applications

In February this year, we put out a call for applications for the second (yay!) round of the QGIS grant programme. The intent of the programme is to leverage donor and sponsor funding in order to support community members with great ideas to improve the underlying infrastructure of the QGIS project and code base.

We have had a really great response to the call for applications (detailed list of applications is here for your reading pleasure – 231KB download).

Given that we have 13 proposals (down 7 from our last call) and only 20,000 Euros to disburse, the QGIS voting members will need to make some tough, pragmatic choices.The voting for the grant proposals ends at the mid April 2017, and we plan to announce the successful candidates soon after that. The PSC will arbitrate in the case of a dead heat or the proposal amounts of the top voted proposals not adding up to our funding target.

Although the number of proposals submitted is down from last year, the quality and utility of the proposals this year is really top notch and it is sad to know that we will not be able to fun them all through the grant programme. If you have the wherewithal to further support some of the grant proposals that did not make the cut, or the QGIS 3.0 effort in general, please get into contact with our treasurer, Andreas Neumann (finance [at] qgis.org) or head over to our sponsorship or donations page to support their work!

Lastly, I appeal to those QGIS Voting Members who have not yet cast their votes to check your email and head over to the voting form to cast your vote!


Crayfish 2.5: New features

A new release of Crayfish is now available from QGIS plugin repo.

Here are the new features in more detail…

Trace animation

We have added support for live trace animation on QGIS canvas:

Please note that export to trace animation (as an avi file) is not supported yet. To change vector style to traces, please refer to the Crayfish manual.

Support for UGRID

UGRID format for Deltares modelling packages are now supported in Crayfish. In addition to 2D mesh, UGRID also supports 1D mesh. Support for 1D mesh is experimental in this release.

FLO-2D HDF format

In addition to ASCII FLO-2D files, Crayfish can handle binary HDF output from FLO-2D. Several bugs related to FLO-2D file format were also resolved.

XDMF format

We are pleased to merge changes from Furgo GeoConsulting to support XDMF format. The new format supports on-the-fly loading of the data.

Sponsors

The new and improved support for file formats for HDF5 and UGRID have been kindly sponsored by FLO-2D and Deltares. We developed trace animation for fun.

Feedback and bug report

If you have any problem with Crayfish, please do not email us directly and consider filing a bug here: https://github.com/lutraconsulting/qgis-crayfish-plugin/issues

You may also like...

Mergin Maps, a field data collection app based on QGIS. Mergin Maps makes field work easy with its simple interface and cloud-based sync. Available on Android, iOS and Windows. Screenshots of the Mergin Maps mobile app for Field Data Collection
Get it on Google Play Get it on Apple store

Gray is the new Black

Sometimes I prefer to publish my map in gray instead of black. But all newly added QGIS composer items are set to black by default. For changing the colors more easily and rapidly I created the “Turn Gray” plugin. By default it changes all foreground colors (labels and outlines) to gray. But you are free … Continue reading Gray is the new Black

FOSSGIS 2017 in Passau

In zwei Wochen beginnt die alljährliche deutschsprachige FOSSGIS Konferenz zum Theme Open Source GIS und OpenStreetMap in Passau. Vom 22.-25. März 2017 wird die FOSSGIS-Konferenz mit Untersützung der Universität Passau in der Dreiflüssestadt Passau stattfinden. Die FOSSGIS-Konferenz ist die im D-A-CH-Raum führende Konferenz für Freie und Open Source Software für Geoinformationssysteme sowie für die Themen OpenStreetMap und Open Data. An vier Tagen werden in Vorträgen für Einsteiger und Experten, Hands-On Workshops und Anwendertreffen Einblicke in neuste Entwicklungen und Anwendungsmöglichkeiten von Softwareprojekten gegeben.

Photo: Tobias Hobmeier (CC-BY-SA)

Sourcepole ist wieder mit einem Stand vertreten und lädt zu interessanten Workshops und Vorträgen ein:

  • Mittwoch 17:00 - Workshop Entwicklung von QGIS Plugins
  • Donnerstag 14:30 (HS 9) - QGIS Server Projektstatus
  • Donnerstag 14:30 (HS 11) - Von WMS zu WMTS zu Vektor-Tiles
  • Donnerstag 15:00 (HS 9) - QGIS Web Client 2

Das gesamte Programm ist auch als praktische Android App erhältlich und die Online-Anmeldung ist noch bis am 19.3. offen.

Wir freuen uns auf eine interessante Konferenz!

Movement data in GIS #5: current research topics

In the 1st part of this series, I mentioned the Workshop on Analysis of Movement Data at the GIScience 2016 conference. Since the workshop took place in September 2016, 11 abstracts have been published (the website seems to be down currently, see the cached version) covering topics from general concepts for movement data analysis, to transport, health, and ecology specific articles. Here’s a quick overview of what researchers are currently working on:

  • General topics
    • Interpolating trajectories with gaps in the GPS signal while taking into account the context of the gap [Hwang et al., 2016]
    • Adding time and weather context to understand their impact on origin-destination flows [Sila-Nowicka and Fotheringham, 2016]
    • Finding optimal locations for multiple moving objects to meet and still arrive at their destination in time [Gao and Zeng, 2016]
    • Modeling checkpoint-based movement data as sequence of transitions [Tao, 2016]
  • Transport domain
    • Estimating junction locations and traffic regulations using extended floating car data [Kuntzsch et al., 2016]
  • Health domain
    • Clarifying physical activity domain semantics using ontology design patterns [Sinha and Howe, 2016]
    • Recognizing activities based on Pebble Watch sensors and context for eight gestures, including brushing one’s teeth and combing one’s hair [Cherian et al., 2016]
    • Comparing GPS-based indicators of spatial activity with reported data [Fillekes et al., 2016]
  • Ecology domain
    • Linking bird movement with environmental context [Bohrer et al., 2016]
    • Quantifying interaction probabilities for moving and stationary objects using probabilistic space-time prisms [Loraamm et al., 2016]
    • Generating probability density surfaces using time-geographic density estimation [Downs and Hyzer, 2016]

If you are interested in movement data in the context of ecological research, don’t miss the workshop on spatio-temporal analysis, modelling and data visualisation for movement ecology at the Lorentz Center in Leiden in the Netherlands. There’s currently a call for applications for young researchers who want to attend this workshop.

Since I’m mostly working with human and vehicle movement data in outdoor settings, it is interesting to see the bigger picture of movement data analysis in GIScience. It is worth noting that the published texts are only abstracts, therefore there is not much detail about algorithms and whether the code will be available as open source.

For more reading: full papers of the previous workshop in 2014 have been published in the Int. Journal of Geographical Information Science, vol 30(5). More special issues on “Computational Movement Analysis” and “Representation and Analytical Models for Location-based Social Media Data and Tracking Data” have been announced.

References

[Bohrer et al., 2016] Bohrer, G., Davidson, S. C., Mcclain, K. M., Friedemann, G., Weinzierl, R., and Wikelski, M. (2016). Contextual Movement Data of Bird Flight – Direct Observations and Annotation from Remote Sensing.
[Cherian et al., 2016] Cherian, J., Goldberg, D., and Hammond, T. (2016). Sensing Day-to-Day Activities through Wearable Sensors and AI.
[Downs and Hyzer, 2016] Downs, J. A. and Hyzer, G. (2016). Spatial Uncertainty in Animal Tracking Data: Are We Throwing Away Useful Information?
[Fillekes et al., 2016] Fillekes, M., Bereuter, P. S., and Weibel, R. (2016). Comparing GPS-based Indicators of Spatial Activity to the Life-Space Questionnaire (LSQ) in Research on Health and Aging.
[Gao and Zeng, 2016] Gao, S. and Zeng, Y. (2016). Where to Meet: A Context-Based Geoprocessing Framework to Find Optimal Spatiotemporal Interaction Corridor for Multiple Moving Objects.
[Hwang et al., 2016] Hwang, S., Yalla, S., and Crews, R. (2016). Conditional resampling for segmenting GPS trajectory towards exposure assessment.
[Kuntzsch et al., 2016] Kuntzsch, C., Zourlidou, S., and Feuerhake, U. (2016). Learning the Traffic Regulation Context of Intersections from Speed Profile Data.
[Loraamm et al., 2016] Loraamm, R. W., Downs, J. A., and Lamb, D. (2016). A Time-Geographic Approach to Wildlife-Road Interactions.
[Sila-Nowicka and Fotheringham, 2016] Sila-Nowicka, K. and Fotheringham, A. (2016). A route map to calibrate spatial interaction models from GPS movement data.
[Sinha and Howe, 2016] Sinha, G. and Howe, C. (2016). An Ontology Design Pattern for Semantic Modelling of Children’s Physical Activities in School Playgrounds.
[Tao, 2016] Tao, Y. (2016). Data Modeling for Checkpoint-based Movement Data.


A report on QGIS Income 2016

Greetings wonderful QGIS Users, Developers and Supporters! 2016 was quite an  exciting year for QGIS – we released QGIS 2.14LTR which has been a great stable release. We also set the wheels in motion for QGIS 3.0 which we plan to release later this year. QGIS development takes a lot of time and effort – and much of the work is done by volunteers – especially the core project maintenance work which typically does not attract paid-for consulting work like new feature work does.

We are extremely lucky and grateful to have a growing band of sponsors that are helping us to slowly but surely fund more core QGIS project work too. In this post we want to say ‘thank you’ to the many sponsors that have stepped up to the plate when we asked for help and sponsored QGIS. We also want to provide some insight as to what level of funding we receive and hopefully stimulate some friendly enthusiasm to stepping up funding efforts from our users around the world.

Our project treasurer, Andreas Neumann, has been so kind as to compile a very detailed report about the sponsorships and donations received over 2016 which we would like to share with you. Before I share his actual report, let me just clarify that we have two distinct ways of contributing money to the project:

  • Donations: You simply nominate an amount you wish to contribute and pay it to the project. Donations are intended as a way for individual users to show their support for QGIS (although we welcome large donations too).
  • Sponsorships: Sponsorships are aimed at organizations. We have fixed tiers of contribution (see below) and each tier includes some benefits in terms of marketing exposure for your company or organisation.

QGIS sponsorship can be made at one of four levels:

2017-01-30 01_22_27-Projecta_ Sponsorship Levels -.png

Higher tier (silver and up) sponsors are included in the footer of our main web site, http://qgis.org e.g.:

Screen Shot 2017-02-25 at 8.50.22 AM.png

If you want to see your company listed there, why not head over to the QGIS Sponsorship page to find out how to become a sponsor?

Some interesting highlights from Andreas’ report:

Screen Shot 2017-02-25 at 9.00.07 AM.png

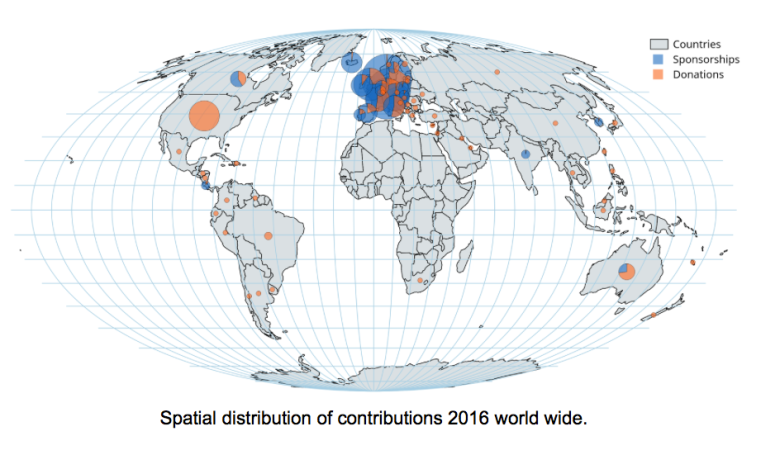
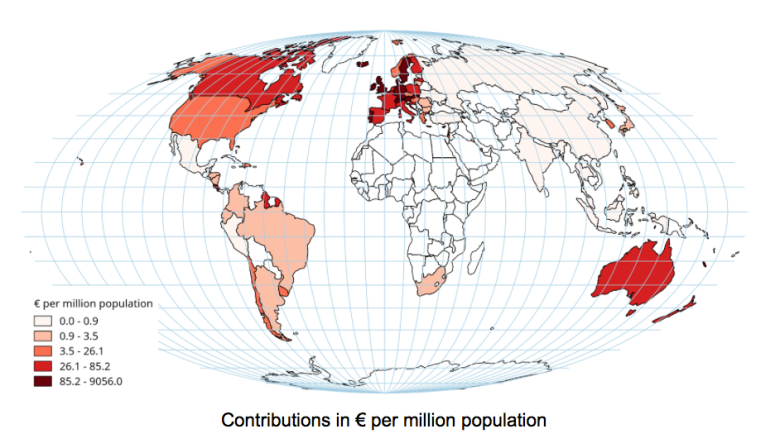
We had  1128 donations in 2016 amounting to a total of  €25108. We had  47 Sponsors in 2016 which raised a total income of  €67921. December is the month that attracts the highest income from donations and sponsors (though that may coincide with additional marketing we did calling for sponsors).  Looking at contributions by country, Denmark was the highest national contributor in 2016, providing a total of  €17795 to the QGIS.ORG project. If you normalize by population,  Iceland provided the largest per capita contribution to QGIS, providing  €9056 per million people.  Iceland also had the highest contribution rate when measured against GDP with  ~€154 per billion GDP.

Screen Shot 2017-02-25 at 9.04.34 AM.png

You can read Andreas’ full report in this PDF – a huge thank you to Andreas for preparing this fascinating report, and of course to everyone out there who shared their hard earned money with us – your funding has become a vital enabler for moving the project forward.

Regards

timsutton

Tim Sutton
(QGIS Project Chair)


New map coloring algorithms in QGIS 3.0

It’s been a long time since I last blogged here. Let’s just blame that on the amount of changes going into QGIS 3.0 and move on…

One new feature which landed in QGIS 3.0 today is a processing algorithm for automatic coloring of a map in such a way that adjoining polygons are all assigned different color indexes. Astute readers may be aware that this was possible in earlier versions of QGIS through the use of either the (QGIS 1.x only!) Topocolor plugin, or the Coloring a map plugin (2.x).

What’s interesting about this new processing algorithm is that it introduces several refinements for cartographically optimising the coloring. The earlier plugins both operated by pure “graph” coloring techniques. What this means is that first a graph consisting of each set of adjoining features is generated. Then, based purely on this abstract graph, the coloring algorithms are applied to optimise the solution so that connected graph nodes are assigned different colors, whilst keeping the total number of colors required minimised.
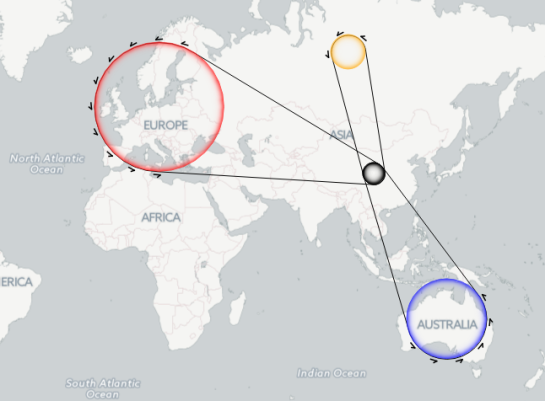
The new QGIS algorithm works in a different way. Whilst the first step is still calculating the graph of adjoining features (now super-fast due to use of spatial indexes and prepared geometry intersection tests!), the colors for the graph are assigned while considering the spatial arrangement of all features. It’s gone from a purely abstract mathematical solution to a context-sensitive cartographic solution.

The “Topological coloring” processing algorithm

Let’s explore the differences. First up, the algorithm has an option for the “minimum distance between features”. It’s often the case that features aren’t really touching, but are instead just very close to each other. Even though they aren’t touching, we still don’t want these features to be assigned the same color. This option allows you to control the minimum distance which two features can be to each other before they can be assigned the same color.

The biggest change comes in the “balancing” techniques available in the new algorithm. By default, the algorithm now tries to assign colors in such a way that the total number of features assigned each color is equalised. This avoids having a color which is only assigned to a couple of features in a large dataset, resulting in an odd looking map coloration.

Balancing color assignment by count – notice how each class has a (almost!) equal count

Another available balancing technique is to balance the color assignment by total area. This technique assigns colors so that the total area of the features assigned to each color is balanced. This mode can be useful to help avoid large features resulting in one of the colors appearing more dominant on a colored map.

Balancing assignment by area – note how only one large feature is assigned the red color

The final technique, and my personal preference, is to balance colors by distance between colors. This mode will assign colors in order to maximize the distance between features of the same color. Maximising the distance helps to create a more uniform distribution of colors across a map, and avoids certain colors clustering in a particular area of the map. It’s my preference as it creates a really nice balanced map – at a glance the colors look “randomly” assigned with no discernible pattern to the arrangement.

Balancing colors by distance

As these examples show, considering the geographic arrangement of features while coloring allows us to optimise the assigned colors for cartographic output.

The other nice thing about having this feature implemented as a processing algorithm is that unlike standalone plugins, processing algorithms can be incorporated as just one step of a larger model (and also reused by other plugins!).

QGIS 3.0 has tons of great new features, speed boosts and stability bumps. This is just a tiny taste of the handy new features which will be available when 3.0 is released!

QGIS Grants #2: Call for Grant Proposals 2017

Dear QGIS Community

Last year we held our first ever call for Grant Proposals and it was a great success. If you are an early adopter using QGIS 3.0 preview builds, you can already try out some of the new capabilities that have arrived in QGIS thanks to these grants.

We are very pleased to announce the second round of Grants is now available to QGIS Contributors. The deadline for this round is Sunday, 19 March 2017. All the details for the Grant are described in the application form, and for more context we encourage you to also read these articles:

We look forward to seeing all your great ideas about how to improve QGIS!

Tim Sutton

QGIS Project Chair


AutoForm Plugin for QGIS

The AutoForm plugin for QGIS automatically sets the edit widget type for the fields of a selected layer based on their data types and foreign keys. This is in order to save the user time they may need to spend on manually editing these widgets. In order for this to work correctly, the layer information must be stored in a PostgreSQL database. Furthermore, foreign keys must have a constraint rule for this to work. The plugin does NOT allow you to set relations. It merely checks for any and takes advantage of them accordingly.

Motivation

When you have a database with a lot of tables, there should be a way for quickly entering data whithout having to configure the input form for each table first. In Switzerland this a common use case when you import Interlis data with ili2pg based on an official data model. ili2pg automatically adds reference constraints based on the Interlis model, which is a prerequisite to detect relations in a generic way.

There is already a plugin with a very similar goal: DataDrivenInputMask written by Bernhard Ströbl. Maybe it was bad luck, but we had always troubles when using it. Once we eventually found out the PostgreSQL driver for the QtSql library was missing and another time we failed to use the plugin because we had a socket based connection to PostgreSQL. In both cases we were stuck in the login dialog without a hint why the connection had failed. Another problem is in some cases that the DataDrivenInputMask plugin writes additional metadata into the original database.

So we decided to make our own proof of concept, hopefully avoiding these problems and having the Swiss “ili2pg” use case in mind. A major conceptual difference is, that AutoForm uses the built-in input form functionality of QGIS instead of creating custom dialogs like DataDrivenInputMask does.

Running the plugin

After you have installed the AutoForm plugin (flagged “experimental”) via the QGIS Plugin repository you should see a new option in the Plugins menu called AutoForm. Clicking on it will give you the option Generate Form. Running this with the layer selected will generate your form. If everything is correctly configured, this next step should be easy.

  • Select a PostGIS layer from the Layers Panel
  • Click on Generate Form

And thats it! Now if you toggle editing you should see the changes which were made. In my case, this was the result:

form_before_run

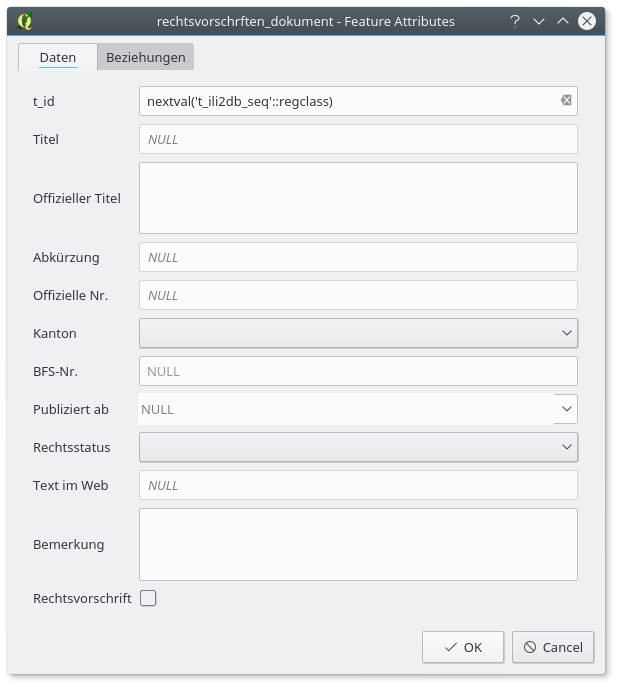
form_after_run

If your layer had a foreign key reference to one or multiple other tables, then they too were added automatically to the Layers Panel and their values should be selectable in their according fields.

Behind the Scenes

In order to perhaps help a bit with understanding how this Plugin works, I am adding this section for anyone who is curious. The Plugin follows this process:

  • Check if a layer is selected
  • If a layer is selected search for any key relationships to other tables
  • If a foreign key relationship to another table was found the load that table into the project and set the corresponding fields to a Value Relation WidgetType
  • Proceed normally and set the remaining Widgets where applicable

The script checks first if the field has already been changed, so as to prevent user made edits or the previously set Value Relations from being overwritten. Then it takes a look at the typeName() of the field in order to determine which widgettype to assign. For example if the field has the Date Type, it would use the calender widget. It does this for each field in the layer. Should the user wish to make additional changes (or correct any mistakes which might have been made), they can do so in the ‘Fields’ tab of the layer properties.

Outlook

This plugin is in an early stage and serves as a proof of concept. There is much left to be done, especially in supporting embedded forms for related tables. We also don’t analyze additional metadata written by ili2pg, which would allow to recognize whether related tables are only lookup tables without the need to embed them as entry forms.

The source code is available on Github. If you are interested in collaborating or maybe sponsoring improvements to this plugin, please contact us!

Minutes of the Inaugural QGIS General Meeting (2016)

Dear QGIS community members

At the end of December 2016, we held our inaugural Annual General Meeting (AGM). It should be noted that QGIS AGM’s will be ‘virtual’ meetings conducted as a questionnaire (for voting / raising motions) and then a report such as the one below, with optional follow up email discussion if deemed necessary. The reason for this is that our community is spread far and wide and any attempt at an in-person (physical or virtual) meeting will prove very difficult given the number of different time zones the participants live in. Thus this, and future, AGM reports will be a reflection / summary of the various online activities that constitute the ‘AGM’ and the reports should be read with this understanding in mind.  It should also be kept in mind that because we are bootstrapping the QGIS Board, the 2016/ 2017 meetings follow a reduced agenda – the 2018 meeting will commence with the full AGM agenda since we will have a year of financial reporting / board activity etc. behind us. Here follow the minutes:


Minutes of the Inaugural General Assembly (AGM) 2016 – Concluded 22 December 2016

Dear QGIS.ORG voting members,

In December 2016 we held a special Inaugural AGM event in order to bootstrap the new governance structures for QGIS.ORG. The following items were tabled during our special AGM to cater for the needed transition from the old organisation to the new:

Election of incoming board and PSC member replacements

Under our statutes, existing board / PSC members are automatically put forward for re-election during our PSC elections. A call for nominations was held and closed on 15 December 2016. All voting members were elegible to put forward their nominations. The following valid nominations were received (i.e. for candidates who were not already PSC members):

  1. Régis Haubourg

Subsequent to the call for nominations, an election was held via online vote. Response rate was 20 out of 27 eligible voters. Under our statutes this is considered a quorum. Election results were as follows:

Position Name Votes Received Max Votes
Chair: QGIS Board Tim Sutton 19 20
Vice-Chair: QGIS Board Paolo Cavallini 12 20
Treasurer: QGIS Board Andreas Neumann 20 20
PSC Member Richard Duivenvoorde 17 20
PSC Member Anita Graser 16 20
PSC Member Jϋrgen Fischer 14 20
Honorary PSC Member Gary Sherman

Note that each voting member was allowed 6 votes, but was not allowed to vote for the same person more than once. For the Board Member positions, which were specifically named, the candidate with the greatest number of votes for each role assigned that role. The PSC member positions were calculated based on the total number of votes each candidate received (including those allocated to named board roles). In accordance with our statutes, Gary Sherman remains on the PSC on a permanent basis as Honorary PSC member.

Election of the board chair

Election of the board chair was carried out as part of the general voting process. The successful candidate was Tim Sutton.

Matters brought forward by voting members

There were no matters brought forward by voting members.

Annual AGM for 2017

Now that the special AGM has been held and the Board and PSC constituted, we will hold our first AGM in the first quarter of 2017 (and then each year thereafter will be held in the first quarter). The 2017 AGM will be a reduced format since we will have just elected the PSC and Board,

Agenda for 2017 AGM:

  1. Approval of the annual report (2016) by the chair
  2. Approval of the annual financial report (2016)
  3. Approval of the 2017 budget
  4. Election of two financial auditors for the upcoming year
  5. Deal with matters brought forward by voting members


Given the outcomes of the end-2016 AGM, the QGIS Governance now looks like this (click for larger version):

qgisoperationalstructure

If you have any queries about the QGIS Governance processes, please do not hesitate to ask!

Regards

timsutton

Tim Sutton (QGIS Project Chair)


Gradient arrows

Today’s post was motivated by a question following up on my recent post “Details of good flow maps“: How to create arrows with gradients from transparent to opaque?

gradient_arrow

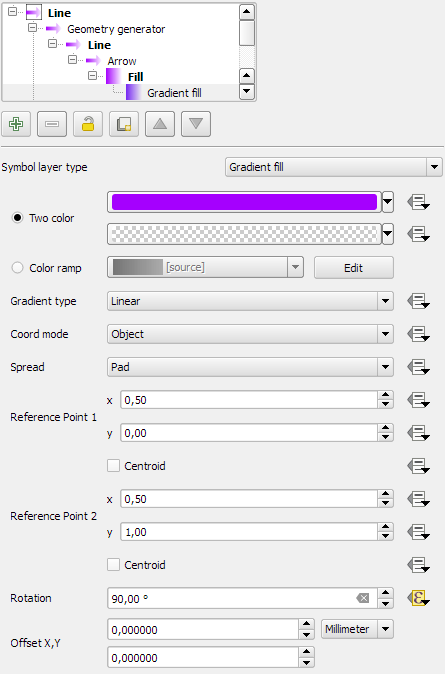
The key idea is to use a gradient fill to color the arrows:

gradient_arrow_settings

It all seems perfectly straightforward: determine the direction of the line and set the gradient rotation according to the line direction.

But wait! That doesn’t work!

The issue is that all default angle functions available in expressions return clockwise angles but the gradient rotation has to be set in counter-clockwise angles. So we need this expression:

360-angle_at_vertex($geometry,1)

Happy QGISing!


  • <<
  • Page 54 of 141 ( 2819 posts )
  • >>

Back to Top

Sustaining Members