Related Plugins and Tags

QGIS Planet

My favorite new recipe in QGIS Map Design 2nd ed

If you follow me on Twitter, you have probably already heard that the ebook of “QGIS Map Design 2nd Edition” has now been published and we are expecting the print version to be up for sale later this month. Gretchen Peterson and I – together with our editor Gary Sherman (yes, that Gary Sherman!) – have been working hard to provide you with tons of new and improved map design workflows and many many completely new maps. By Gretchen’s count, this edition contains 23 new maps, so it’s very hard to pick a favorite!

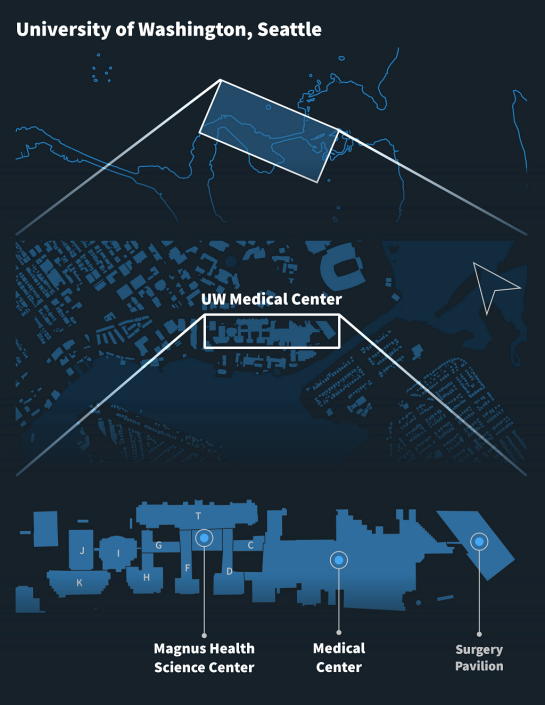
Like the 1st edition, we provide increasingly advanced recipes in three chapters, each focusing on either layer styling, labeling, or creating print layouts. If I had to pick a favorite, I’d have to go with “Mastering Rotated Maps”, one of the advanced recipes in the print layouts chapter. It looks deceptively simple but it combines a variety of great QGIS features and clever ideas to design a map that provides information on multiple levels of detail. Besides the name inspiring rotated map items, this design combines

  • map overviews
  • map themes
  • graduated lines and polygons
  • a rotated north arrow
  • fancy leader lines

all in one:

“QGIS Map Design 2nd Edition” provides how-to instructions, as well as data and project files for each recipe. So you can jump right into it and work with the provided materials or apply the techniques to your own data.

The ebook is available at LocatePress.

(Nederlands) BGT Import plugin vernieuwd

Sorry, this entry is only available in the Dutch language

QGIS Server 3 : OGC Certification work for WFS 1.1.0

QGIS Server is an open source OGC data server which uses QGIS engine as backend. It becomes really awesome because a simple desktop qgis project file can be rendered as web services with exactly the same rendering, and without any mapfile or xml coding by hand.

QGIS Server provides a way to serve OGC web services like WMS, WCS, WFS and WMTS resources from a QGIS project, but can also extend services like GetPrint which takes advantage of QGIS’s map composer power to generate high quality PDF outputs.

Since the 3.0.2 version, QGIS Server is certified as an official OGC reference implementation for WMS 1.3.0 and reports are generated in a daily continuous integration to avoid regressions.


Thus, the next step was naturally to take a look at the WFS 1.1.0 thanks to the support of the QGIS Grant Program

Side note, this Grant program is made possible thanks to your direct sponsoring and micro-donations to QGIS.org.

TEAM Engine test suite for WFS 1.1.0

We use a tool provided by the OGC Compliance Program to run dedicated tests on the server : Teamengine (Test, Evaluation, And Measurement Engine).

Test suites are available through a web interface. However, for the needs of continuous integration, these tests have to be run without user interaction. In the case of WMS 1.3.0, nothing more easy than using the REST API:

$ curl "http://localhost:8081/teamengine/rest/suites/wms/1.20/run?queryable=queryable&basic=basic&capabilities-url=http://172.17.0.2/qgisserver?REQUEST=GetCapabilities%26SERVICE=WMS%26VERSION=1.3.0%26MAP=/data/teamengine_wms_130.qgs


However, the WFS 1.1.0 test suite does not provide a REST API and makes the situation less straightforward. We switched to using TEAM Engine directly from command line:

$ cd te_base
$ ./bin/unix/test.sh -source=wfs/1.1.0/ctl/main.ctl -form=params.xml

The params.xml file allows to configure underlying tests. In this particular case, the GetCapabilities URL of the QGIS Server to test is given.  Results are available thanks to the viewlog.sh shell script:

$ ./bin/unix/viewlog.sh -logdir=te_base/users/root/ -session=s0001
Test wfs:wfs-main type Mandatory (s0001) Failed (InheritedFailure)
   Test wfs:readiness-tests type Mandatory (s0001/d68e38807_1) Failed (InheritedFailure)
      Test ctl:SchematronValidatingParser type Mandatory (s0001/d68e38807_1/d68e588_1) Failed
      Test wfs:basic-main type Mandatory (s0001/d68e38807_1/d68e636_1) Failed (InheritedFailure)
         Test wfs:run-GetCapabilities-basic-cc-GET type Mandatory (s0001/d68e38807_1/d68e636_1/d68e28810_1) Failed (InheritedFailure)
            Test wfs:wfs-1.1.0-Basic-GetCapabilities-tc1 type Mandatory (s0001/d68e38807_1/d68e636_1/d68e28810_1/d68e1095_1) Passed
               Test ctl:assert-xpath type Mandatory (s0001/d68e38807_1/d68e636_1/d68e28810_1/d68e1095_1/d68e1234_1) Passed
            Test wfs:wfs-1.1.0-Basic-GetCapabilities-tc2 type Mandatory (s0001/d68e38807_1/d68e636_1/d68e28810_1/d68e1100_1) Passed
               Test ctl:assert-xpath type Mandatory (s0001/d68e38807_1/d68e636_1/d68e28810_1/d68e1100_1/d68e1305_1) Passed
            Test wfs:wfs-1.1.0-Basic-GetCapabilities-tc3 type Mandatory (s0001/d68e38807_1/d68e636_1/d68e28810_1/d68e1105_1) Passed
               Test ctl:assert-xpath type Mandatory (s0001/d68e38807_1/d68e636_1/d68e28810_1/d68e1105_1/d68e1558_1) Passed
               Test ctl:assert-xpath type Mandatory (s0001/d68e38807_1/d68e636_1/d68e28810_1/d68e1105_1/d68e1582_1) Passed
               Test ctl:assert-xpath type Mandatory (s0001/d68e38807_1/d68e636_1/d68e28810_1/d68e1105_1/d68e1606_1) Passed
...
...

Finally, a Python script has been written to read these logs and generate HTML report easily readable. Thanks to our QGIS-Server-CertifSuite, providing the continuous integration infrastructure with Docker images, these reports are also generated daily.

Bugfix and Conclusion

First results were clear: a lot of work is necessary to have a QGIS Server certified for WFS 1.1.0!

We started fixing the issues one by one:

And now we have a much better support than 6 months ago

However, some work still need to be done to finally obtain the OGC certification for WFS 1.1.0. To be continued!

Please contact us if you want QGIS server to become a reference implementation for all OGC service !

Report back on the 20th QGIS Hackfest in Zanzibar


This post summarizes personal reports of community members who attended the 20th Hackfest in Stone Town, Zanzibar the week before the FOSS4G in Dar Es Salaam.

Report from Matteo Ghetta

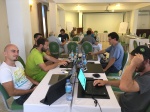
QGIS developers spent 3 days in the beautiful island of Zanzibar were they worked on bug fixing, improvement of new features and documentation enhancements. It is extremely important for developers to meet together and spend some days working side by side given that the geographical distribution is very wide.

Thanks to the (local government & Yves Barthelemy) we had the chance to visit the Land Mapping Commission in Stone Town: It has been an amazing experience for both developers and local council. Moreover developers visited the SUZA (University of Zanzibar) and saw the local infrastructure and GIS related workflow.

  • I have merged many PR of the documentation
  • Many old and not old issues have been closed or the author has been pinged
  • Many new additions to the documentation both small corrections and new sections from scratch
  • A new version of DataPlotly released
  • A small presentation of DataPlotly to the QGIS crew

Report from Mario Baranzini

I spent one day of the Hackfest contributing to the SLYR project, improving the conversion of LAB colors. SLYR (https://github.com/nyalldawson/slyr) is a project started and almost entirely developed by Nyall (which was not present to the Hackfest) which aims to provide tools to extract and convert symbols from ESRI .lyr and .style files and use them in QGIS. Nyall has recently worked hard on the project and perhaps soon sponsorship will allow further development.

Around this theme there is a keen interest. Even during the FOSS4G there has been discussion of the conversion of ESRI symbols and there was also a presentation of how the conversion in Israel is currently managed.

During the rest of the hackfest, I worked on the implementation of the new QField file selector.

Report from Denis Rouzaud

Report from Tim Sutton

Firstly let me thank the QGIS project for contributing to my travel and accommodation costs – I am most grateful for the support! This hackfest was special for me because it is the first hackfest in an African country. As an African born person living in the interface between “first world” and “third world”, I have always had a particular social agenda with QGIS: To bring spatial tools to support responsible and sustainable management of our world. There is a huge technological and skills divide between Europe and less developed societies where QGIS can be a valuable social enabler in helping to advance the standard of living and quality of life. Hosting a hackfest in an environment where we don’t have tree cadastres, street furniture cadastres and every aspect of civilian life mapped and systematised is an important way to build empathy and understanding in our QGIS core community members for a broader cross-section of our user base. Having the opportunity to meet with users from ZMI (the Zanzibar Mapping Initiative) and students from the local university was a really uplifting experience. ZMI are building the national cadastre from the ground up using QGIS, PostGIS and UAV mapping. We were privileged to have a number of Zanzibar residents join us on the hackfest and get to experience just how appreciative they are, first hand.

There were a number of interesting topics that arose during the hackfest which I will try to summarise here:

Certification:

We held an extended meeting on the QGIS Certification Programme, mainly detailing how we should go about the review process for onboarding new organisations.

Mac OS Build:

I spent quite a bit of time struggling with my MacOS build on QGIS. It’s definitely an area of the project that needs more work as the process can be non-trivial and the brew based formulas quickly become outdated.

QField Show and Tell:

Matthias showed off the latest version of QField and all the hard work they have been putting into the QGIS mobile client. This Android based version of QGIS for mobile data gathering is a really great project and is getting more and more useful with each release. There was also a translation sprint for QField during which I translated it to Afrikaans.

QField Autobuilds:

Denis and Matthias showed off the work they have done to automate the .apk builds for QField. Their system combines Travis and some git hooks to automatically build .APK’s whenever a pull request os made or a tag is made. See the QField travis for details: https://github.com/opengisch/QField/blob/master/.travis.yml

Plotly plugin:

Matteo Ghetta showed off the latest capabilities of the Data Plotly plugin for QGIS 3. The plugin supports the creation of a wide assortment of charts from your layer’s attribute data. See the plugin homepage here for examples and more detail: https://github.com/ghtmtt/DataPlotly 

Governance:

I took the opportunity to sign off the statute changes from 2017 general meeting. This was my last official act as outgoing project Chair. I was also extremely humbled to be awarded an Honorary PSC membership during the FOSS4G2018 conference.
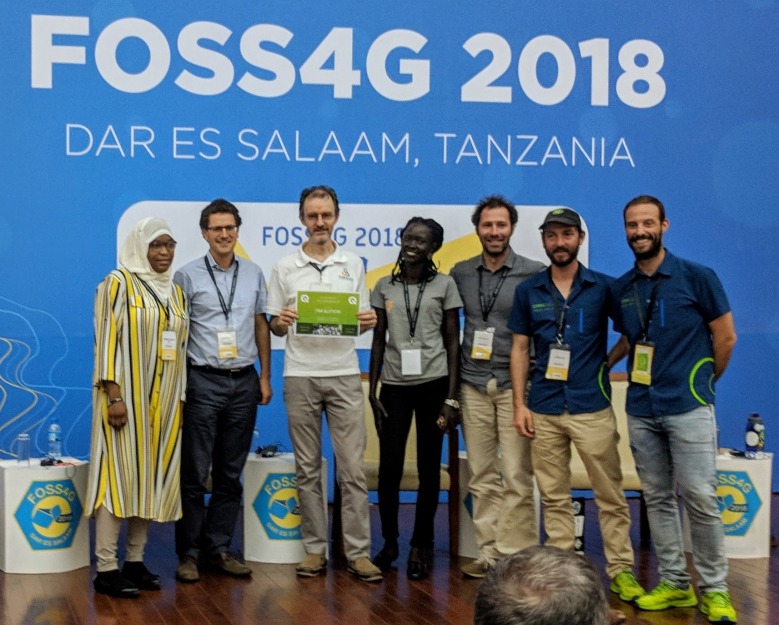
TimRecievesHonoraryPSCMembership
Easter Eggs:

I contributed a couple of new easter eggs to QGIS. While easter eggs are fun, the data behind these hidden tools provide an important history of the project. I took the opportunity of having many long-time QGIS community members around the dinner table to collate all the previous QGIS meet-up dates. You can view this as a map here: https://github.com/qgis/QGIS/blob/master/resources/data/qgis-hackfests.json 

The spatial clustering of these events shows that going to Zanzibar and getting out of our geographical comfort zone is a really useful endeavour.

Report from Paolo Cavallini

During the HF in Zanzibar I mainly worked on:

  • Plugins: I cleaned up the queue of unapproved plugins, contacting all individual authors, fixing what was possible and deprecating the worst cases; we also solved a long standing issue with a contentious plugin
  • Issues: I examined many tickets, especially those waiting for feedback
  • Training certification: through a very productive meeting we defined clear rules for accepting certifying organizations, with the main aim of driving people to actively support the project:
    • in the application process, the proponent should explain what are his contribution to QGIS project
    • following an initial review, the application will be sent to local QGIS groups for their opinion, which should take place in less than one monthly; where there is no user group, the responsibility will fall entirely on PSC shoulders
    • the training material for each course should be released with a free license, and a review will be done; if the material is not of adequate quality, this is a cause for refusal
    • then PSC will take a decision and publish the contributions as stated by the proponent, for transparency
  • Other meetings helped focusing on our mission, defining the relationship between volunteer and paid work, and other
  • I visited the Land Mapping Commission and the University, soliciting a tighter cooperation with QGIS project.

Report from Admire Nyakudya

During the heck fest in Zanzibar, I mainly worked on porting some common plugin we use to QGIS 3. The plugins I mainly worked on were Cogo Parcel plugin and Sg Diagram downloader. We visited the Zanzibar mapping agency and interacted with the people who were working on capturing cadastral data using QGIS and explained them about the COGO Parcel plugin which streamlines capturing cadastral boundaries in QGIS and storing the results in a PostgreSQL database. To summarise the work I was working on during the heck fest.

  • Port Cogo Plugin from QGIS 2 to make it compatible with QGIS 3. This has been achieved and now awaiting one of my team members to approve the pull request.
  • Expand functionality being offered by the COGO Parcel plugin to include the new reporting framework in QGIS 3.
  • Investigate ways to generate projects on the fly after talking to Matteo and seeing the work he has done with QGIS project generator.

I also went to the Zanzibar university to see ways in which QGIS is being used in the local university and how students are integrating drone imagery with QGIS.

Report from Matthias Kuhn

The highest value of hackfests is actually to meet and greet and discuss ideas and bigger plans. There is a lot of communication on a high bandwidth channel (also known as face-to-face) that strengthens the community. This helps to quickly overcome technical problems sometimes. Or to give someone some tips and tricks you normally wouldn’t come to (e.g. optimizing a git workflow) that results in a long-term gain because of sustainable productivity improvements. I tend to walk around once in a while and just randomly bump into people where I – more or less successfully – try to help them solve their issues or discuss approaches. In the same area, there is the possibility to informally discuss plans about organization, workflows and strategies. The concept of an LTR was to a big degree discussed and built at a hackfest in Essen some years ago. This year there was a very interesting discussion about the topic LTR. For how much time the “long” in the term “long term release” should stand, about the life cycle of releases and of long-term releases. One of the important things when it comes to this question is what organisations think and do – because, in the end, it is mostly for organisations that the LTR exists – and how development resources can be assigned to the task of keeping a high quality of an LTR during its whole lifetime. There are no conclusions yet, but synchronizing on these ideas is often the seed for tomorrow’s exciting changes.

We were also visited by a group of students from the local university. It was really refreshing to talk to them about open source and QGIS and how we work and what the challenges of spatial data and GIS infrastructure are on an island like Zanzibar.

Feature-wise, the main thing I worked on feature wise was a new snap to grid functionality that is available for digitizing tools. It allows configuring a precision for vector layers. Whenever a new node is added or an existing one is edited on this vector layer, it will be automatically placed on this grid. Normally this is used to force the objects on a layer to something like cm or mm resolution.

And then, of course, I did my daily bunch of (mostly volunteer) pull request reviewing, some code cleanup and some bugfixes.

Report from Marco Bernasocchi

https://photos.app.goo.gl/seX2kSJ9vKxKBZt58

The Zanzibar hackfest was a special one for me, my first hackfest as QGIS.org co-chair. My main goal was definitely to get as much information out of Tim as possible so that I wouldn’t have to keep on bugging him all time 🙂

Beside that, multiple meetings where planned to which I took part, as Paolo already explained, we had very good meetings about:

  • Certifications meeting
  • Trademark discussion
  • Creating a membership system that allows entities that are not allowed to budget sponsoring money to instead become paying members.
  • Other meetings helped focusing on our mission, defining the relationship between volunteer and paid work, and other

On the first two days, we were joined by a largish group of local students to whom I explained how the structure of QGIS.org works and where they could help. I also helped them choosing a task to work and mentored them.

As I mentioned before, I spent a lot of time asking a lot of questions to Tim to get the biggest possible knowledge transfer about running QGIS.org and some time choosing and booking restaurants for our evening “meetings”

On the technical side, I worked with Mario on a new implementation of the QField File selector.

After everybody left, the OPENGIS.ch team stayed one day longer and introduced Mario to the real Brighton-style hackfest with take-away pizza 😉


GRASS GIS 7.4.2 released

We are pleased to announce the GRASS GIS 7.4.2 release

What’s new in a nutshell

After a bit more than four months of development the new update release GRASS GIS 7.4.2 is available. It provides more than 50 stability fixes and improvements compared to the previous stable version 7.4.1. An overview of the new features in the 7.4 release series is available at New Features in GRASS GIS 7.4.

Efforts have concentrated on making the user experience even better, providing many small, but useful additional functionalities to modules and further improving the graphical user interface. Segmentation now support extremely large raster maps. Dockerfile and Windows support received updates. Also the manual was improved. For a detailed overview, see the list of new features. As a stable release series, 7.4.x enjoys long-term support.

Binaries/Installer download:

Source code download:

More details:

See also our detailed announcement:

About GRASS GIS

The Geographic Resources Analysis Support System (https://grass.osgeo.org/), commonly referred to as GRASS GIS, is an Open Source Geographic Information System providing powerful raster, vector and geospatial processing capabilities in a single integrated software suite. GRASS GIS includes tools for spatial modeling, visualization of raster and vector data, management and analysis of geospatial data, and the processing of satellite and aerial imagery. It also provides the capability to produce sophisticated presentation graphics and hardcopy maps. GRASS GIS has been translated into about twenty languages and supports a huge array of data formats. It can be used either as a stand-alone application or as backend for other software packages such as QGIS and R geostatistics. It is distributed freely under the terms of the GNU General Public License (GPL). GRASS GIS is a founding member of the Open Source Geospatial Foundation (OSGeo).

The GRASS Development Team, October 2018

The post GRASS GIS 7.4.2 released appeared first on GFOSS Blog | GRASS GIS and OSGeo News.

QGIS 3.4 Madeira is released!

We are pleased to announce the release of QGIS 3.4 ‘Madeira’! Madeira was the location of our developer meeting in February 2018.

Windows installers and Ubuntu/debian binaries are already out, and all the packagers are actively preparing packages for the other operating systems. We’ll keep you updated when different packages and installers become available.

QGIS 3.4 comes with tons of new features, as you can see in our visual changelog.

QGIS 3.4 will become the first LTR of version 3. Based on our current plans, 3.4 will replace 2.18 as LTR in February 2019.

We would like to thank the developers, documenters, testers and all the many folks out there who volunteer their time and effort (or fund people to do so). From the QGIS community we hope you enjoy this release! If you wish to donate time, money or otherwise get involved in making QGIS more awesome, please wander along to qgis.org and lend a hand!

QGIS is supported by donors and sponsors. A current list of donors who have made financial contributions large and small to the project can be seen on our donors list. If you would like to become and official project sponsor, please visit our sponsorship page for details. Sponsoring QGIS helps us to fund our six monthly developer meetings, maintain project infrastructure and fund bug fixing efforts. A complete list of current sponsors is provided below – our very great thank you to all of our sponsors!

QGIS is Free software and you are under no obligation to pay anything to use it – in fact we want to encourage people far and wide to use it regardless of what your financial or social status is – we believe empowering people with spatial decision making tools will result in a better society for all of humanity.

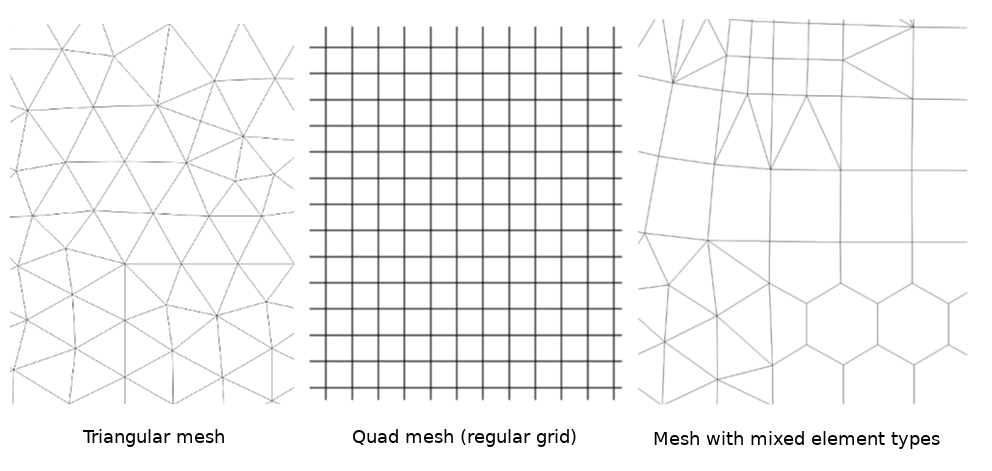
Mesh Data Abstraction Library (MDAL)

In the world of GIS, vector and raster are the most common data types to represent real world features. But not always, vectors and rasters can describe the complexity and nature of the data.

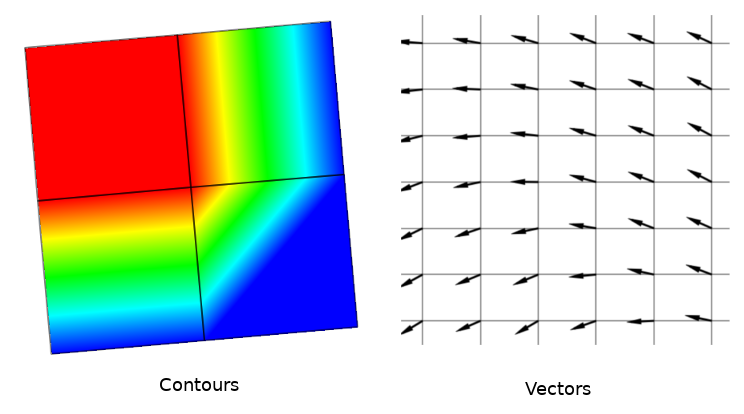
MDAL Mesh

Example of those datasets are:

  • Metrological data: e.g. temperature and wind speed
  • Hydrological data: flood depth and flow velocity
  • Oceanography: salinity and wave flux

MDAL arrows and contours

In the past, we introduced Crayfish plugin to handle unstructured grids, usually with temporal and other components. The main issues with Crayfish plugin were:

  • Crayfish plugin had its own renderer. Therefore, we had to create binaries and ship them with the plugin. This was not ideal, as not all the platforms (e.g. MacOS) was not supported.
  • Crayfish plugin loaded all the data in the memory. For small files, this was not an issue. But there was not a solution for larger files.

Why MDAL?

For more details of the rational behind introducing MDAL, see the QGIS Enhancement Proposal with great suggestions and feedback from the developers.

TL;DR: we needed a new abstraction library to handle the mesh data formats similar to GDAL/OGR dealing with rasters and vectors.

Current state

After the feedback from the QGIS community, we have introduced MDAL library earlier this year. It took us a bit of time to put the infrastructure in place. There are already some formats available from MDAL. The library was integrated to QGIS from 3.2. But extensive improvements and new features were added during 3.4.

There are still more formats to support. In QGIS, we will also need to enhance the spatial indexing and performance of the driver in general. For more information visit MDAL website.

How to work with MDAL layer in QGIS

Here is a mesh layer you can use to load in QGIS. For more data, you can visit the ECMWF(or Copernicus) or NASA websites.

In QGIS, from the main menu > Layer > Data Source Manager. A new window will appear. From the left panel, click on Mesh layer Mesh and point to the downloaded file.

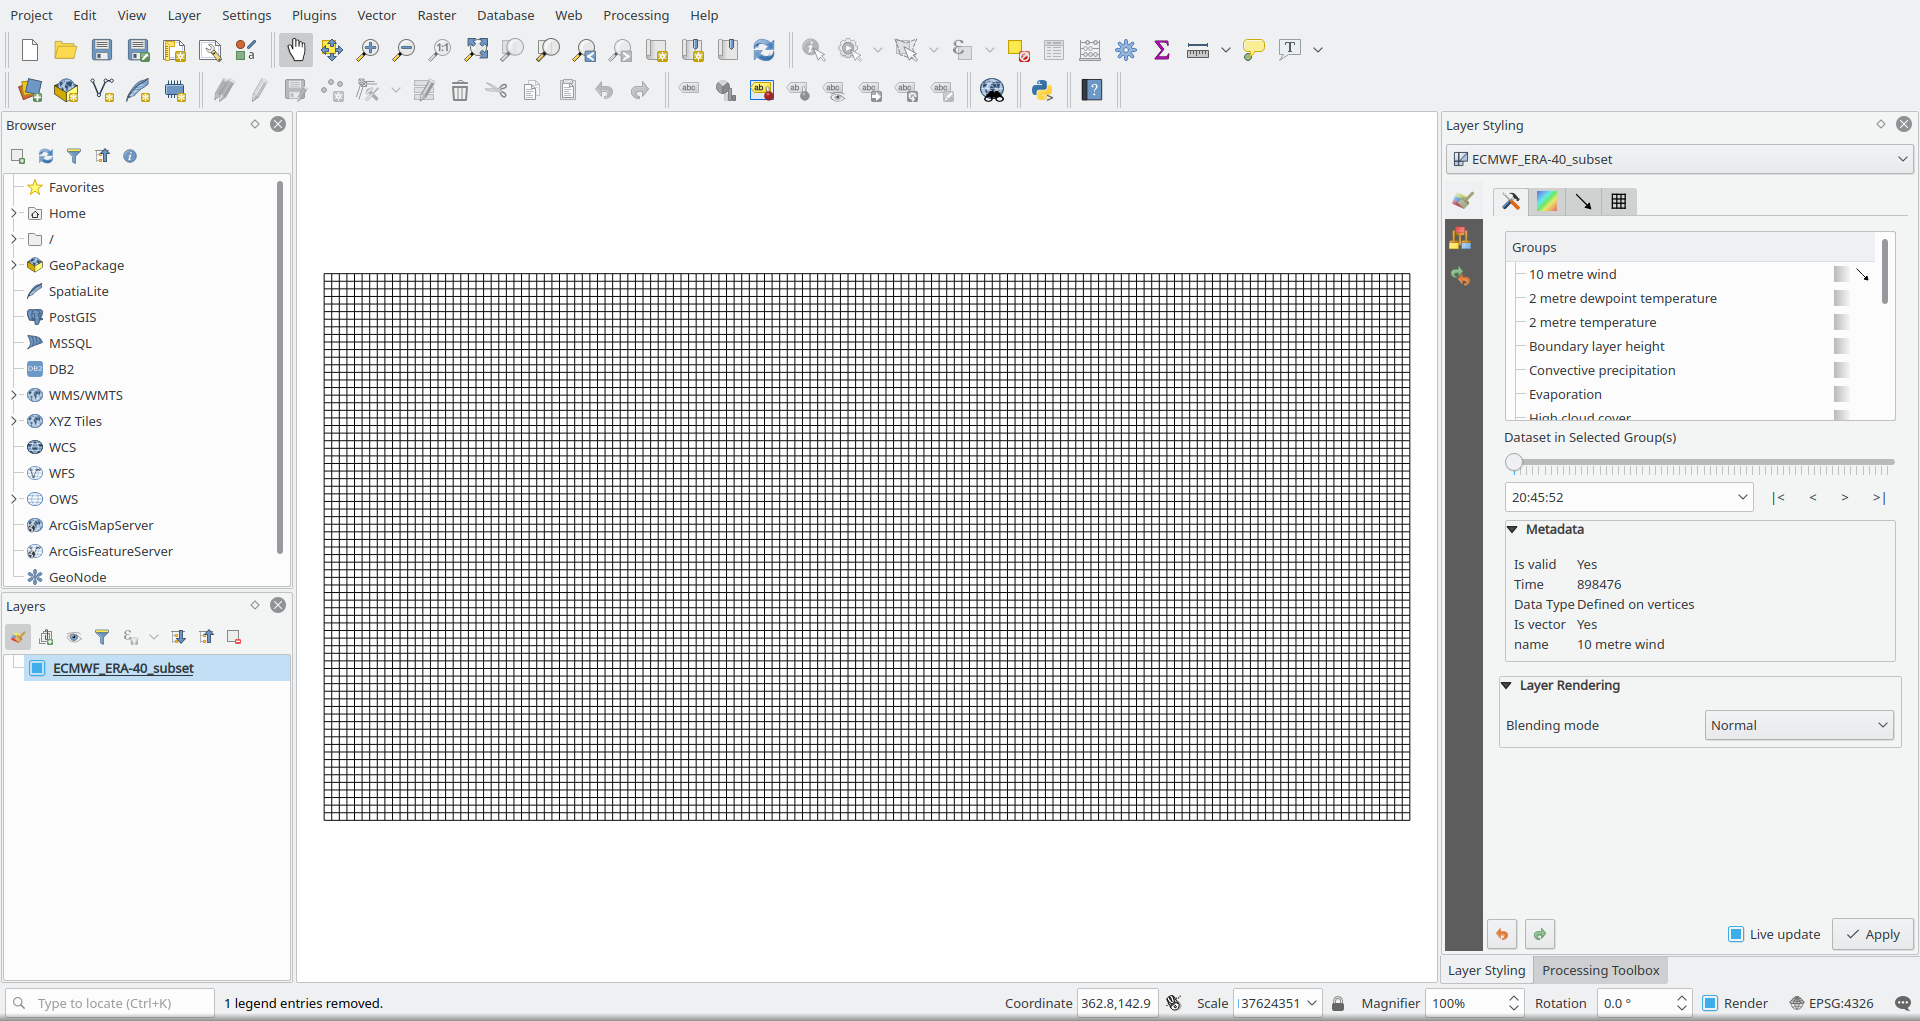
You should be able to see a figure similar to the one below:

Mesh layer in QGIS

To view quantities within the mesh, you can open the Layer Styling Panel. Click on symbology Styling tab:

  • First select symbology and deactivate Native Mesh Rendering
  • Click on general and under groups, towards the right of 10 metre wind click on contour and vector to view the quantities.
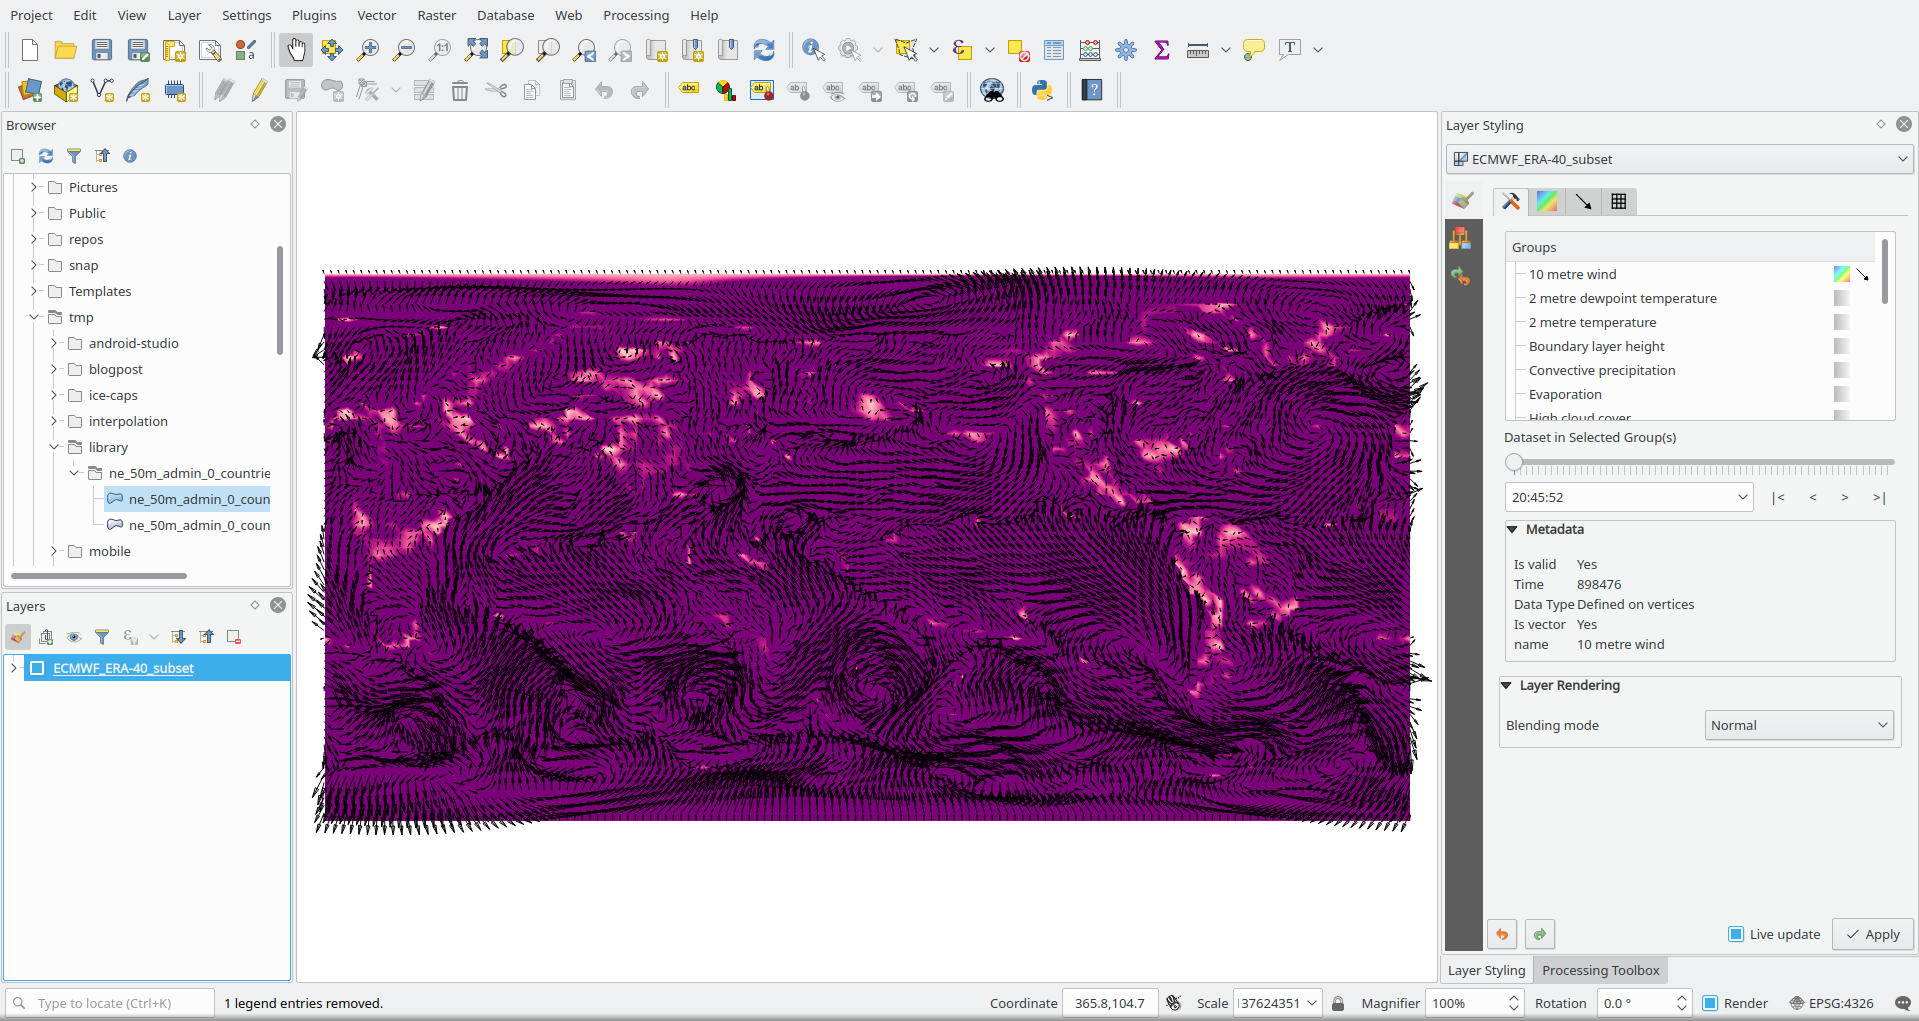
  • Below the Groups, you can move the slider to browse through time of the dateset(s).
  • To change style of the contours and vectors you can click on contour and vector tabs and adjust the color ramps and vector sizes accordingly.

Mesh layer in QGIS

What happens to Crayfish plugin?

We have recently released a new version of Crayfish plugin to work directly with mesh layer in QGIS. Crayfish is now based on Python only and can be installed on all main platforms (including MacOS).

Future developments

We are planning to add mesh calculator (either as a core QGIS feature or Crayfish/Processing plugin). There will be more formats in the pipeline to support in MDAL too.

If you’d like to add support for your mesh layer to MDAL, you can follow the examples on the github repository. We are always happy to help.

You may also like...

Mergin Maps, a field data collection app based on QGIS. Mergin Maps makes field work easy with its simple interface and cloud-based sync. Available on Android, iOS and Windows. Screenshots of the Mergin Maps mobile app for Field Data Collection
Get it on Google Play Get it on Apple store

New 3D features in QGIS 3.4

Thanks to the great response from the QGIS community to our crowdfunding call, we have added several new features to the upcoming release (3.4).

Here are the highlights of the features:

Print layout

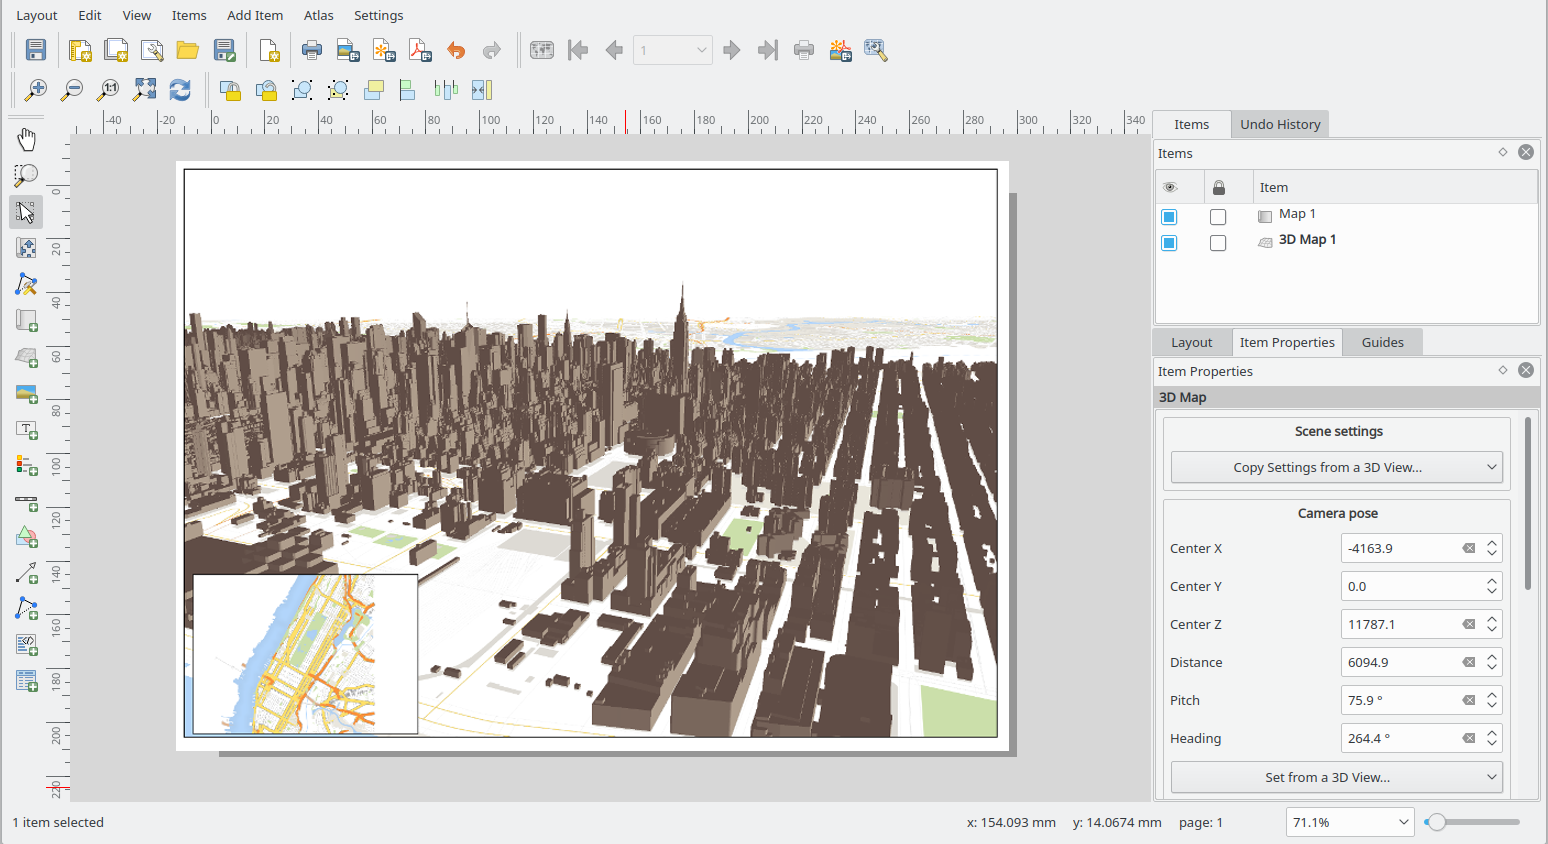
With this new feature, you can embed a 3D scene to the print layout. In addition, there are camera and view setting tools available to adjust the scene from within the map frame. This will allow you to generate high resolution outputs similar to the other map frames.

QGIS 3D configuration

Animation

You can create an animation based on a set of keyframes - camera positions at particular times. QGIS 3D then interpolates the camera positions/rotations in between the keyframes.

To create the keyframes, first set the scene for your map, by rotating, zooming or moving the camera. Then assign a time to the frame. There are several methods for interpolations between keyframes.

QGIS 3D configuration

Identify tool in 3d map

A new Identify Tool was introduced to 3D map. Using this tool, you can inspect features from the 3D scene. Thanks to our friends from Faunalia for funding this feature.

3D lines

If you have a 3D linestring, you can now use the elevation of vertices to display it in 3D map.

QGIS 3D configuration

Camera control

There are more control on how you can pan, rotate and zoom the camera within the scene:

  • Page up/down: to move the camera up/down: Page up/down keys for moving the camera
  • Free camera movements: also possible to look from below: Page up/down keys for moving the camera
  • Shift key and drag: the camera rotates around a point on terrain: Page up/down keys for moving the camera
  • Ctrl key and drag: this will rotate camera while it stays in one position Page up/down keys for moving the camera

In addition, the point towards which the camera is looking is dynamically adjusted based on the terrain. The rotation in scenes where a DEM used for terrain has been enhanced significantly. This is more pronounced with presence of higher hills in the terrain.

Further development

There are still some exciting features from the crowdfunding which will be incorporated in QGIS 3.6. You can check the QGIS development or follow us on Twitter.

You may also like...

Mergin Maps, a field data collection app based on QGIS. Mergin Maps makes field work easy with its simple interface and cloud-based sync. Available on Android, iOS and Windows. Screenshots of the Mergin Maps mobile app for Field Data Collection
Get it on Google Play Get it on Apple store

French Ministry in charge of the ecological transition selected Oslandia

Ministère de la Transition Écologique et Solidaire Logo

The French ministry of the ecological transition  selected Oslandia for two of the three packages of its call for tender procedure dedicated to geomatic tools.  We are very proud to dedicate our team to one of the strongest support of geomatics and Open Source in France for the next 2 to 4 years.

First package is dedicated to expert studies covering spatial databases, software, components, protocols, norms and standards in the geomatics fields.

Second package provides support and development for QGIS,  the spatial cartridge PostGIS of PostgreSQL and their components. We are really happy to continue a common work already engaged in the previous contract.

This is again another proof that we face a major tendency of open source investment, where geomatics components are currently among the most dynamic and strongest open source projects. This is also a confirmation that actors are now integrating deeply the economic rationale of open source contribution inside their politics.

Add Realistic Mist and Fog to Topography in QGIS 3.2

I recently came across a great tutorial by in which he demonstrated how to create map of Switzerland in the style of Edward Imhof, the famed Swiss cartographer renowned for his hand painted maps of Switzerland and other mountainous regions of the world. John’s map used traditional hillshading, multidirectional hillshading and crucially, a translucent topographic layer that created a mist like appearance he likened to the sfumato technique used by painters since the Renascence.

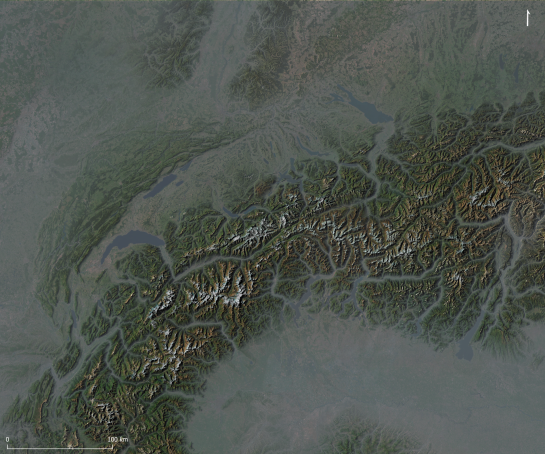
I followed John’s tutorial in QGIS 3.2 and I was quite pleased with the initial result below. However, the process creating it is a bit too complicated for a tutorial so I set about simplifying the process and rather than imitating Imhof’s distinct style, my goal this time is realism.

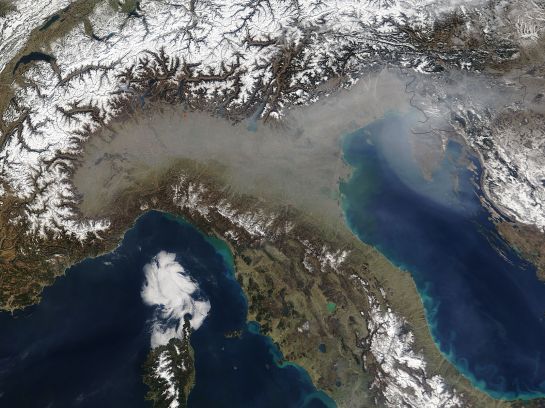
The heart of the effect involves the very clever idea of using the topographic layer as a subtle opacity mask to simulate mist, fog and atmospheric haze. Have a look at the image below taken on March 17th, 2005 by NASA’s Terra satellite. This is the industrialised Po valley of northern Italy, surrounded by the Alps and Apennine Mountains that rise above the valley’s hazy pollution. The haze adds a sense of depth to the surrounding hills and mountains. It’s not uncommon to see fog and pollution in satellite imagery that gives way to the clear air in high mountains e.g. northern India and Nepal, China, Pakistan and India. Creating a similar mist effect in QGIS is actually quite simple.

First download topography for the Alps and Po region (a 68.55 Mb GeoTiff file derived from freely available EU-DEM data I resampled from 25 to 100m resolution). Next, make sure you have the plugin QuickMapServics (QMS) installed (menu Plugins – Manage and Install Plugins). This great plugin provides access to over 1000 basemaps.

Load the GeoTiff file into QGIS (Raster – Load) and rename the layer Hillshade. Right click the layer to open the Layer Properties window. In the Symbology panel, next to Render Type, choose Hillshade. Change the altitude to 35 degrees, Azimuth to 300 degrees and Z Factor of 1.5 (illuminating the landscape from the top left). Finally, change the Blending mode to Multiply. Click OK to close the dialogue.

To add the basemap layer, Esri World Imagery (Clarity), type “ESRI clarity” in the QMS search bar to find and add the basemap; Go to View – Panels and activate the QMS search bar if it isn’t initially visible. Make sure it’s the bottommost layer.

Oh, that’s a bit disappointing, we only increased the relief little a bit. It’s missing the vitally important mist layer.

To create mist, right click the Hillshade layer and choose Duplicate. Rename the new layer Mist and make sure it’s above the Hillshade layer. Now open the Layer Properties window of the layer, we’re going edit it’s attributes to make it look like mist.

Change the Render type to Singleband Pseudocolor and use 0 and 3000 for the min and max values (limiting maximum latitude of the mist to 3000 meters). Then open the colour ramp window by clicking on the Color ramp and enter these values:

  • Left Gradient – HSV 215 15 50 and 75% transparency
  • Right Gradient – HSV 215 15 50 and 0% transparency

Close the Color Ramp dialogue. In the Layer Properties window, and this is very important, change the Blending mode to Lighten. Click OK to close the Layer Properties window.

Wow, we have mist!

The mist effect looks great. It certainly adds a lot of realism to the topographic map, it now looks quite like NASA’s images. This is just a quick and basic map so there’s lots of scope to improve the effect. Play around with the colour of the mist layer and its opacity, or even brighten the Hillshade layer underneath. See what effects these changes have.

Here’s another example below. In this example I duplicated the hillshade layer and set the second hillshade layer to Multidirectional Hillshading (yes, QGIS 3.2 has Multidirectional Hillshading). I then adjusted the transparency of both hillshade layers so they blended together nicely. I then replaced the basemap with another duplicated topography layer that I coloured using the gradient sd-a (by Jim Mossman, 2005) using the cpt-city plugin. And lastly, I doubled the opacity of the mist layer turning it into a milky fog. I think it looks great!

What next? Well, there’s lots of possibilities. Perhaps download Martian topography and add mist to the bottom of Valles Marineris?

References:

Eduard Imhof – Biography

TV documentary about Eduard Imhof

The Map as an Artistic Territory: Relief Shading Works and Studies by Eduard Imhof

Haze in northern Italy – NASA Terra Satellite

Tzvetkov, J., 2018. Relief visualization techniques using free and open source GIS tools. Polish Cartographical Review, 50(2), pp.61-71.

Programme change…

See the Dutch website for more info on the programme.

Edit Features “In Place” crowdfund — made it to QGIS 3.4!

Well, thanks to the resounding success of our QGIS edit-in-place crowdfunding campaign, we’ve been frantically smashing away at our keyboards in an attempt to reward the QGIS community by sneaking this feature in a whole 4 months earlier than originally promised! And, we’re very proud to announce, that this exciting new feature has been implemented and will be included in the upcoming QGIS 3.4 release (due late October 2018). So go ahead — grab one of the nightly pre-release of QGIS 3.4 and checkout the results.

This wouldn’t have been possible without the rapid response to the campaign and the generosity of our wonderful backers:

(In addition to these backers, we’ve also received numerous anonymous donations to this feature from many other individuals — while we can’t list you all publicly, you’re also in our thanks!)


Keep an eye on this blog for other upcoming QGIS crowdfunding campaigns targeted at QGIS 3.6 and beyond… we’ve got lots more exciting work planned for these releases!


Dutch QGIS usergroup meeting

All presentations will be in Dutch. Please have a look at the Dutch version of this page to see more…

8th Scottish QGIS UK user group meeting plans

It’s been a long time since we posted anything up here but hopefully the news of another user group happening in Stirling on 7th November will hopefully assuage your distress.

The event is very kindly hosted by Historic Environment Scotland in their restored Engine Shed and is also supported by Ordnance Survey, Cawdor Forestry, thinkWhere, SEPA and Registers of Scotland.

The programme is still being worked out but plan on attending one of two workshop sessions in the morning run by Ordnance Survey and thinkWhere and then a full afternoon of presentations and lightning talks.

Tickets are available through Eventbrite.

8th Scottish QGIS @UK user group

MacOS specific bug fixing campaign

If you are a MacOS QGIS user, you are probably bothered by some MacOS specific bugs. These are due to the fact that we have fewer QGIS developers working on the MacOS platform and there are additional MacOS specific issues in the underlying qt5 library.

Nevertheless, we found a developer, Denis Rouzaud, who wants to specifically look into investigating and hopefully solving several of these issues. If you are a MacOS user and care about a better QGIS experience on this platform, we invite you to financially support this effort. As a private person, and for smaller amounts, please use the usual donation channel – if you are a company or organization and want to contribute to this specific effort, please consider becoming a sponsor. In any case – please add “MacOS bug fixing campaign” as a remark when donating/sponsoring or inform [email protected] about your earmarked donation.

This effort runs from the 14th September 2018 until the 3.4 release date, due on October 26, 2018. See the QGIS road map for more details about our release schedule.

Specific issues that are looked into, are:

issue priority subject
11103 1 Support for retina displays (HiDPI)
17773 1 No Retina / HiDPI support in 2.99 on osx
19546 1 QGIS 3 slow on macOS at high resolutions
19524 1 [macOS] Map canvas with wrong size on QGIS 3.2.1 start up
19321 2 Map Tips on Mac doesn’t display the content correctly
19314 1 3.2 crashes on startup on a Mac
19092 2 Measure tool on a Mac uses the top right corner of the cross hair cursor instead of the centre
18943 3 QGIS Server on MacOS X High Sierra
18914 3 [macOS] Plugin list corrupted by wrongly placed checkboxes on Mac
18720 2 QGIS 3.0.1 crashes on Mac
18452 3 Snapping options missing on Mac
18418 2 Scroll zoom erratic on Mac trackpad
16575 3 QGIS 2.18.7 crashes on macOS 10.12.4 when undocking the label panel
16025 2 [macOS] Control feature rendering order will crash QGIS
3975 2 PDF exports on OSX always convert text to outlines

Thank you for considering to support this effort! Please note that some issues may also exist due to up-stream issues in the qt library. In such a case, it can’t be guaranteed if and how fast, such an issue can be fixed.

Andreas Neumann, QGIS.ORG treasurer

Edit Features “In Place” crowdfund — target reached!

Well, the final pledges have been tallied and we’re very proud to announce that our latest crowd funding campaign has been a roaring success!

We’ve been completely blown away by the response to this campaign. Thanks to some incredibly generous backers and donors, we’ve been able to hit the campaign target with plenty of time to spare. As a result, we’ll be pushing hard to reward the generosity of the community by trying to sneak this feature in for the upcoming QGIS 3.4 release (instead of the originally promised 3.6 release)! You can read more about what we’re adding at the campaign page.

We’d like to take this opportunity to extend our heartfelt thanks to all the backers who have pledged to support this project:

In addition to these backers, we’ve also received numerous anonymous donations to this feature from many other individuals — while we can’t list you all publicly, you’re also in our thanks!

Stay tuned for more updates to come as work proceeds on this feature…

Geocoding with Geopy

Need to geocode some addresses? Here’s a five-lines-of-code solution based on “An A-Z of useful Python tricks” by Peter Gleeson:

from geopy import GoogleV3
place = "Krems an der Donau"
location = GoogleV3().geocode(place)
print(location.address)
print("POINT({},{})".format(location.latitude,location.longitude))

For more info, check out geopy:

geopy is a Python 2 and 3 client for several popular geocoding web services.
geopy includes geocoder classes for the OpenStreetMap Nominatim, ESRI ArcGIS, Google Geocoding API (V3), Baidu Maps, Bing Maps API, Yandex, IGN France, GeoNames, Pelias, geocode.earth, OpenMapQuest, PickPoint, What3Words, OpenCage, SmartyStreets, GeocodeFarm, and Here geocoder services.

(Nederlands) 3 oktober QGIS gebruikersdag in Nieuwegein

Sorry, this entry is only available in the Dutch language

Plotting GPS Trajectories with error ellipses using Time Manager

This is a guest post by Time Manager collaborator and Python expert, Ariadni-Karolina Alexiou.

Today we’re going to look at how to visualize the error bounds of a GPS trace in time. The goal is to do an in-depth visual exploration using QGIS and Time Manager in order to learn more about the data we have.

The Data

We have a file that contains GPS locations of an object in time, which has been created by a GPS tracker. The tracker also keeps track of the error covariance matrix for each point in time, that is, what confidence it has in the measurements it gives. Here is what the file looks like:

data.png

Error Covariance Matrix

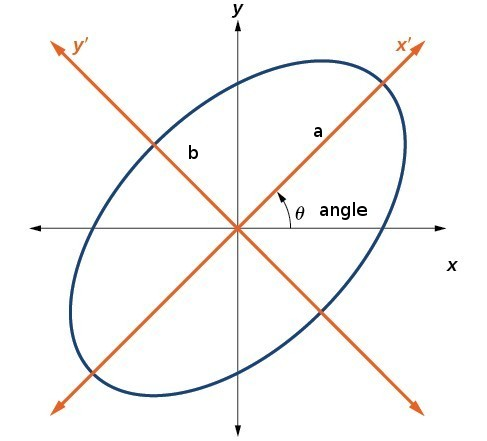
What are those sd* fields? According to the manual: The estimated standard deviations of the solution assuming a priori error model and error parameters by the positioning options. What it basically means is that the real GPS location will be located no further than three standard deviations across north and east from the measured location, most of (99.7%) the time. A way to represent this visually is to create an ellipse that maps this area of where the real location can be.ellipse_ab

An ellipse can be uniquely defined from the lengths of the segments a and b and its rotation angle. For more details on how to get those ellipse parameters from the covariance matrix, please see the footnote.

Ground truth data

We also happen to have a file with the actual locations (also in longitudes and latitudes) of the object for the same time frame as the GPS (also in seconds), provided through another tracking method which is more accurate in this case.

actual_data

This is because, the object was me running on a rooftop in Zürich wearing several tracking devices (not just GPS), and I knew exactly which floor tiles I was hitting.

The goal is to explore, visually, the relationship between the GPS data and the actual locations in time. I hope to get an idea of the accuracy, and what can influence it.

First look

Loading the GPS data into QGIS and Time Manager, we can indeed see the GPS locations vis-a-vis the actual locations in time.

actual_vs_gps

Let’s see if the actual locations that were measured independently fall inside the ellipse coverage area. To do this, we need to use the covariance data to render ellipses.

Creating the ellipses

I considered using the ellipses marker from QGIS.

ellipse_marker.png

It is possible to switch from Millimeter to Map Unit and edit a data defined override for symbol width, height and rotation. Symbol width would be the a parameter of the ellipse, symbol height the b parameter and rotation simply the angle. The thing is, we haven’t computed any of these values yet, we just have the error covariance values in our dataset.

Because of the re-projections and matrix calculations inherent into extracting the a, b and angle of the error ellipse at each point in time, I decided to do this calculation offline using Python and relevant libraries, and then simply add a WKT text field with a polygon representation of the ellipse to the file I had. That way, the augmented data could be re-used outside QGIS, for example, to visualize using Leaflet or similar. I could have done a hybrid solution, where I calculated a, b and the angle offline, and then used the dynamic rendering capabilities of QGIS, as well.

I also decided to dump the csv into an sqlite database with an index on the time column, to make time range queries (which Time Manager does) run faster.

Putting it all together

The code for transforming the initial GPS data csv file into an sqlite database can be found in my github along with a small sample of the file containing the GPS data.

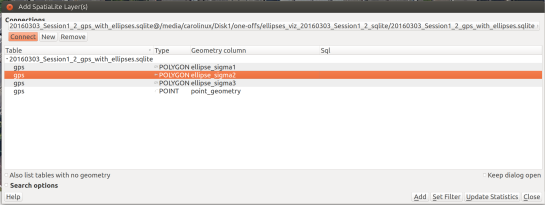
I created three ellipses per timestamp, to represent the three standard deviations. Opening QGIS (I used version: 2.12, Las Palmas) and going to Layer>Add Layer>Add SpatialLite Layer, we see the following dialog:

add_spatialite2.png

After adding the layer (say, for the second standard deviation ellipse), we can add it to Time Manager like so:

add_to_tm

We do the process three times to add the three types of ellipses, taking care to style each ellipse differently. I used transparent fill for the second and third standard deviation ellipses.

I also added the data of my  actual positions.

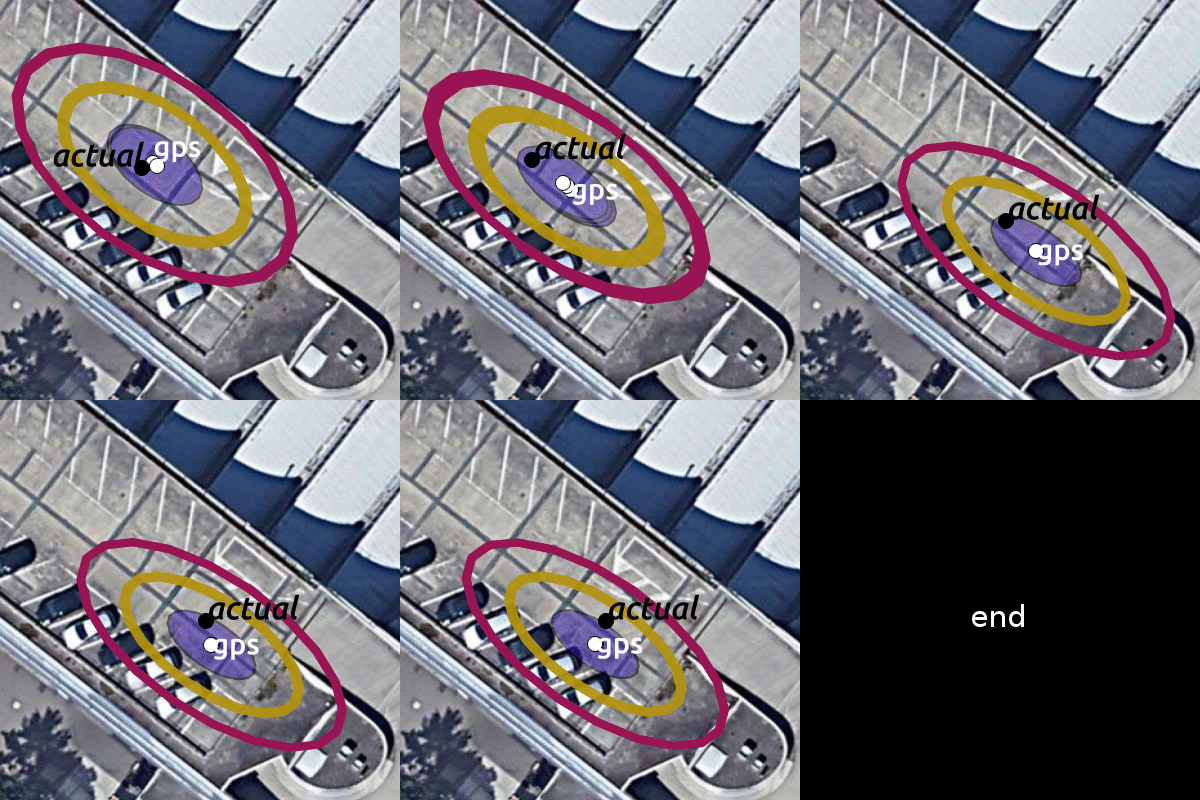
Here is an exported video of the trace (at a place in time where I go forward, backwards and forward again and then stay still).

gps

Conclusions

Looking at the relationship between the actual data and the GPS data, we can see the following:

  • Although the actual position differs from the measured one, the actual position always lies within one or two standard deviations of the measured position (so, inside the purple and golden ellipses).
  • The direction of movement has greater uncertainty (the ellipse is elongated across the line I am running on).
  • When I am standing still, the GPS position is still moving, and unfortunately does not converge to my actual stationary position, but drifts. More research is needed regarding what happens with the GPS data when the tracker is actually still.
  • The GPS position doesn’t jump erratically, which can be good, however, it seems to have trouble ‘catching up’ with the actual position. This means if we’re looking to measure velocity in particular, the GPS tracker might underestimate that.

These findings are empirical, since they are extracted from a single visualization, but we have already learned some new things. We have some new ideas for what questions to ask on a large scale in the data, what additional experiments to run in the future and what limitations we may need to be aware of.

Thanks for reading!

Footnote: Error Covariance Matrix calculations

The error covariance matrix is (according to the definitions of the sd* columns in the manual):

sde * sde sign(sdne) * sdne * sdne
sign(sdne) * sdne * sdne sdn * sdn

It is not a diagonal matrix, which means that the errors across the ‘north’ dimension and the ‘east’ dimension, are not exactly independent.

An important detail is that, while the position is given in longitudes and latitudes, the sdn, sde and sdne fields are in meters. To address this in the code, we convert the longitude and latitudes using UTM projection, so that they are also in meters (northings and eastings).

For more details on the mathematics used to plot the ellipses check out this article by Robert Eisele and the implementation of the ellipse calculations on my github.

FOSS4G 2018 Dar es Salaam

This year’s FOSS4G edition took place in Dar es Salaam, Tanzania. As every year, Sourcepole was supporting this major event as a sponsor. We would like to thank for all the interesting discussions and feedback to our presentations!

image

QGIS Web Client 2 Update

Styling and publication of vector tiles

Using GeoPackage as work and exchange format

Thanks to the LOC for organizing another great FOSS4G!

Pirmin Kalberer (@implgeo)

  • <<
  • Page 46 of 141 ( 2819 posts )
  • >>

Back to Top

Sustaining Members