Related Plugins and Tags

QGIS Planet

Contributing to QGIS Using Git

One of the challenges in any open source project is accepting contributions from people that don’t have, need, or want access to your centralized source code repository. Managing repository accounts for occasional or one-time contributors can be come a bit of an administrative issue. To date, the QGIS project has accepted one-time or occasional contributions through patches submitted via a help ticket. To make it easier for you to contribute to QGIS, we have created a clone of the Subversion repository on GitHub.

Using git With Multiple QGIS Branches

This post is for those of you that build QGIS on a regular basis and want to keep up with everything going on in the current release branches (1.7.2 and 1.8) as well as the master branch that will eventually become version 2.0. While you can do all your work in one clone, this method has a couple of advantages, at the expense of a bit of disk space: Quicker compiles compared to branch switching, especially if you are using ccache Less likelihood of making a merge mess when switching branches The basic steps are:

Using the QGIS Plugin Builder

The Plugin Builder allows you to quickly create a skeleton Python plugin by generating all that boring boilerplate that every plugin requires. Here is a short video showing how to create, compile, and install a new plugin. For more information, see QGIS Workshop Documentation and the PyQGIS Cookbook.

QGIS Gains a Gold Sponsor

The Quantum GIS (QGIS) project is happy to announce that the Asia Air Survey Co., Ltd (AAS), a Japanese international consulting company, has become a Gold Sponsor. AAS has committed to providing 9,000 EUR (~$11,000 US) each of three years, beginning in November 2012. The AAS sponsorship is yet another indication that QGIS is a mature and stable project which continues to provide innovative open source GIS software. The QGIS Project Steering Committee (PSC) wishes to thank AAS for their continuing commitment.

Desktop GIS - the book - Now in Beta

The book is now available in beta. Excerpts from two of the chapters are available online. What’s a beta book? Well in this case it’s a lot like software—feature complete and ready for you to give it a spin. The announcement from the Pragmatic Bookshelf: The Pragmatic Bookshelf | Desktop GIS “From Google Maps to iPhone apps, geographic data and visualization is quickly becoming a standard part of life. Desktop GIS shows you how to assemble and use an Open Source GIS toolkit.

What's Holding Back the Adoption of Open Source GIS on the Desktop?

In my last post I created a poll to get an idea of the extent of migration to open source GIS on the desktop. The results indicated that nearly 50% of the people using open source GIS were still using their proprietary software as well. You can view the results of the poll using the Polls Archive link below the current poll. This leads one to wonder if it is the state of the open source software or other reasons that prevent a full migration.

A Quick Guide to Getting Started with PyQGIS on Windows

Getting started with Python and QGIS can be a bit overwhelming. In this post we give you a quick start to get you up and running and maybe make your PyQGIS life a little easier. There are likely many ways to setup a working PyQGIS development environment—this one works pretty well. Contents Requirements Installing OSGeo4W Setting the Environment Python Packages Working on the Command Line IDE Example Workflow Creating a New Plugin Working with Existing Plugin Code Troubleshooting

QGIS MapServer

Marco Hugentobler at the Institute of Cartography, ETH Zurich has announced the QGIS MapServer project. From the website: “QGIS mapserver is a server module for geographic maps. The content of vector and raster datasources (e.g. shapefiles, gml, postgis, wfs, geotiff ) is visualized according to the request parameters. The generated map image is sent back to the client over the internet.“ This project is very much in the early stages, as it requires a specific development version of QGIS.

GIS Data is an Illicit Drug

GIS data is like an illicit drug. You can’t control it. It travels in secret and hides in the dark alleys of your organization. Its effect spreads and enslaves those that use it. In the end it can lead to ruin. Well maybe its not that bad but organizing and managing your GIS data is difficult. If you need to maintain canonical datasets, the spread of “temporary” and/or “working” copies is your enemy.

New QGIS geometry editing tool: trim/extend

Oslandia is continuing to improve QGIS to offer the draftsman the same experience as with the computer-aided design (CAD) software on the market.
Today we introduce you to the “trim/extend” tool.

As its name suggests, this tool, well known to CAD draftsmen, allows you to trim / shorten or extend segments.

However, where CAD tools impose some limitations – such as using on the end of polyline segments and only on 2D objects – we wanted to go further in QGIS:
– you can modify any segment of a line or polygon geometry and not just its end;
– you can of course modify multi geometries;
– you can hang on to 3D points.

Click to view our demo video.

The tool will be available in version 3.6, but you can use it now in the development version, via the advanced Windows installer for example

This tool was developed thanks to the funding of the Megève Town Hall, which we would like to thank in particular.

It is still possible to improve the tool by offering:

– multiple selection of limits and entities to be modified;
– an option to modify the two selected entities up to their intersection point;
– better support for curved geometries in the future;
– to add topology support when using the tool.

Would you like to participate in its improvement or the development of QGIS?

Need a study or support to move from CAD to GIS?

Do not hesitate to contact us.

Follow us also on twitter or Linkedin to be informed about our new CAD tools in QGIS.

Movement data in GIS #18: creating evaluation data for trajectory predictions

We’ve seen a lot of explorative movement data analysis in the Movement data in GIS series so far. Beyond exploration, predictive analysis is another major topic in movement data analysis. One of the most obvious movement prediction use cases is trajectory prediction, i.e. trying to predict where a moving object will be in the future. The two main categories of trajectory prediction methods I see are those that try to predict the actual path that a moving object will take versus those that only try to predict the next destination.

Today, I want to focus on prediction methods that predict the path that a moving object is going to take. There are many different approaches from simple linear prediction to very sophisticated application-dependent methods. Regardless of the prediction method though, there is the question of how to evaluate the prediction results when these methods are applied to real-life data.

As long as we work with nice, densely, and regularly updated movement data, extracting evaluation samples is rather straightforward. To predict future movement, we need some information about past movement. Based on that past movement, we can then try to predict future positions. For example, given a trajectory that is twenty minutes long, we can extract a sample that provides five minutes of past movement, as well as the actually observed position five minutes into the future:

But what if the trajectory is irregularly updated? Do we interpolate the positions at the desired five minute timestamps? Do we try to shift the sample until – by chance – we find a section along the trajectory where the updates match our desired pattern? What if location timestamps include seconds or milliseconds and we therefore cannot find exact matches? Should we introduce a tolerance parameter that would allow us to match locations with approximately the same timestamp?

Depending on the duration of observation gaps in our trajectory, it might not be a good idea to simply interpolate locations since these interpolated locations could systematically bias our evaluation. Therefore, the safest approach may be to shift the sample pattern along the trajectory until a close match (within the specified tolerance) is found. This approach is now implemented in MovingPandas’ TrajectorySampler.

def test_sample_irregular_updates(self):
    df = pd.DataFrame([
        {'geometry':Point(0,0), 't':datetime(2018,1,1,12,0,1)},
        {'geometry':Point(0,3), 't':datetime(2018,1,1,12,3,2)},
        {'geometry':Point(0,6), 't':datetime(2018,1,1,12,6,1)},
        {'geometry':Point(0,9), 't':datetime(2018,1,1,12,9,2)},
        {'geometry':Point(0,10), 't':datetime(2018,1,1,12,10,2)},
        {'geometry':Point(0,14), 't':datetime(2018,1,1,12,14,3)},
        {'geometry':Point(0,19), 't':datetime(2018,1,1,12,19,4)},
        {'geometry':Point(0,20), 't':datetime(2018,1,1,12,20,0)}
        ]).set_index('t')
    geo_df = GeoDataFrame(df, crs={'init': '4326'})
    traj = Trajectory(1,geo_df)
    sampler = TrajectorySampler(traj, timedelta(seconds=5))
    past_timedelta = timedelta(minutes=5)
    future_timedelta = timedelta(minutes=5)
    sample = sampler.get_sample(past_timedelta, future_timedelta)
    result = sample.future_pos.wkt
    expected_result = "POINT (0 19)"
    self.assertEqual(result, expected_result)
    result = sample.past_traj.to_linestring().wkt
    expected_result = "LINESTRING (0 9, 0 10, 0 14)"
    self.assertEqual(result, expected_result)

The repository also includes a demo that illustrates how to split trajectories using a grid and finally extract samples:


Crowdfunding: QGIS for macOS

If you are a macOS user, there are already several methods to install QGIS. But, unfortunately the packages are not signed and often using old libraries. We have started a prototype to automatically generate QGIS packages for macOS.

The packages are proved to be popular and the QGIS PSC has accepted to take over the infrastructure and publish them eventually as the official QGIS packages for macOS.

To polish the work and sort out some of the issues, we will need extra funds. We are hoping QGIS macOS users will be able to help the crowdfunding campaign. The target amount is 8,500 € and the campaign will be active until 31 January 2019.

Please have a look at the dedicated page QGIS for macOS for further details and help us spread the word!

You may also like...

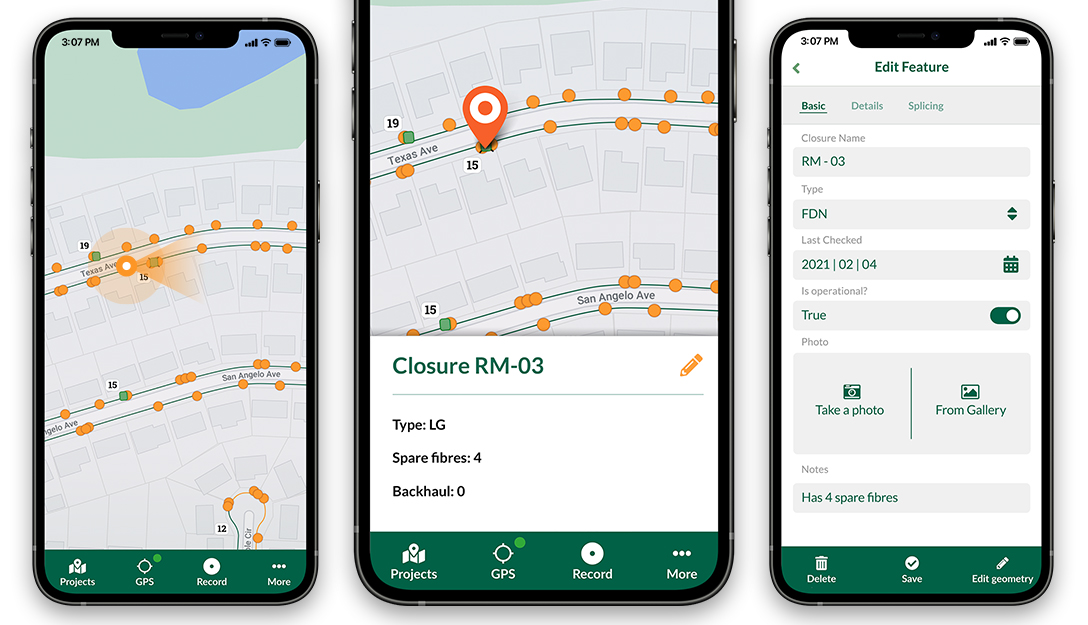
Mergin Maps, a field data collection app based on QGIS. Mergin Maps makes field work easy with its simple interface and cloud-based sync. Available on Android, iOS and Windows. Screenshots of the Mergin Maps mobile app for Field Data Collection
Get it on Google Play Get it on Apple store

User question of the Month – Dec 18 & answers from Nov

It’s December and that means it is time to plan for the next year. Planning also means preparing a budget and to do so, we would like to learn more about what you think QGIS.ORG should focus on: features or bug fixing and polishing? Therefore, we invite you to our QGIS user question of December 2018.

We also have localized translated versions of this questionnaire for our French-speaking and Portuguese-speaking users.

Your answers in November

In November, we wanted to know which version of QGIS you use.

Call for presentations: QGIS User Conference and Developer Meeting, 2019

The next International QGIS User Conference and Developer Meeting will take place in the week from 4 to 10 March 2019 in A Coruña (Spain).


coru
The call for presentations and workshop registration is out and you can apply using the online registration form. Note that the deadline for presenting proposals is 21 Dec 2018. If you need any info please email your queries to: [email protected]


The International QGIS User and Developer Conference wants to be the reference conference for the QGIS community, a meeting point for the family of users and developers associated with the QGIS project. Attending the conference is an opportunity to gather experience and share knowledge about QGIS. The language of the conference is English.


The event is organized by the Spanish QGIS Association [1], the Spanish user group, and the Galician Xeoinquedos community [2] with the help of A Coruña municipality [3]. The event is under the QGIS.org umbrella. We look forward to seeing you there!


Movement data in GIS #17: spatial analysis of GeoPandas trajectories

In Movement data in GIS #16, I presented a new way to deal with trajectory data using GeoPandas and how to load the trajectory GeoDataframes as a QGIS layer. Following up on this initial experiment, I’ve now implemented a first version of an algorithm that performs a spatial analysis on my GeoPandas trajectories.

The first spatial analysis algorithm I’ve implemented is Clip trajectories by extent. Implementing this algorithm revealed a couple of pitfalls:

  • To achieve correct results, we need to compute spatial intersections between linear trajectory segments and the extent. Therefore, we need to convert our point GeoDataframe to a line GeoDataframe.
  • Based on the spatial intersection, we need to take care of computing the corresponding timestamps of the events when trajectories enter or leave the extent.
  • A trajectory can intersect the extent multiple times. Therefore, we cannot simply use the global minimum and maximum timestamp of intersecting segments.
  • GeoPandas provides spatial intersection functionality but if the trajectory contains consecutive rows without location change, these will result in zero length lines and those cause an empty intersection result.

So far, the clip result only contains the trajectory id plus a suffix indicating the sequence of the intersection segments for a specific trajectory (because one trajectory can intersect the extent multiple times). The following screenshot shows one highlighted trajectory that intersects the extent three times and the resulting clipped trajectories:

This algorithm together with the basic trajectory from points algorithm is now available in a Processing algorithm provider plugin called Processing Trajectory.

Note: This plugin depends on GeoPandas.

Note for Windows users: GeoPandas is not a standard package that is available in OSGeo4W, so you’ll have to install it manually. (For the necessary steps, see this answer on gis.stackexchange.com)

The implemented tests show how to use the Trajectory class independently of QGIS. So far, I’m only testing the spatial properties though:

def test_two_intersections_with_same_polygon(self):
    polygon = Polygon([(5,-5),(7,-5),(7,12),(5,12),(5,-5)])
    data = [{'id':1, 'geometry':Point(0,0), 't':datetime(2018,1,1,12,0,0)},
        {'id':1, 'geometry':Point(6,0), 't':datetime(2018,1,1,12,10,0)},
        {'id':1, 'geometry':Point(10,0), 't':datetime(2018,1,1,12,15,0)},
        {'id':1, 'geometry':Point(10,10), 't':datetime(2018,1,1,12,30,0)},
        {'id':1, 'geometry':Point(0,10), 't':datetime(2018,1,1,13,0,0)}]
    df = pd.DataFrame(data).set_index('t')
    geo_df = GeoDataFrame(df, crs={'init': '31256'})
    traj = Trajectory(1, geo_df)
    intersections = traj.intersection(polygon)
    result = []
    for x in intersections:
        result.append(x.to_linestring())
    expected_result = [LineString([(5,0),(6,0),(7,0)]), LineString([(7,10),(5,10)])]
    self.assertEqual(result, expected_result) 

One issue with implementing the algorithms as QGIS Processing tools in this way is that the tools are independent of one another. That means that each tool has to repeat the expensive step of creating the trajectory objects in memory. I’m not sure this can be solved.

TimeManager 3.0.2 released!

Bugfix release 3.0.2 fixes an issue where “accumulate features” was broken for timestamps with milliseconds.

If you like TimeManager, know your way around setting up Travis for testing QGIS plugins, and want to help improve TimeManager stability, please get in touch!

Thoughts on “FOSS4G/SOTM Oceania 2018”, and the PyQGIS API improvements which it caused

Last week the first official “FOSS4G/SOTM Oceania” conference was held at Melbourne University. This was a fantastic event, and there’s simply no way I can extend sufficient thanks to all the organisers and volunteers who put this event together. They did a brilliant job, and their efforts are even more impressive considering it was the inaugural event!

Upfront — this is not a recap of the conference (I’m sure someone else is working on a much more detailed write up of the event!), just some musings I’ve had following my experiences assisting Nathan Woodrow deliver an introductory Python for QGIS workshop he put together for the conference. In short, we both found that delivering this workshop to a group of PyQGIS newcomers was a great way for us to identify “pain points” in the PyQGIS API and areas where we need to improve. The good news is that as a direct result of the experiences during this workshop the API has been improved and streamlined! Let’s explore how:

Part of Nathan’s workshop (notes are available here) focused on a hands-on example of creating a custom QGIS “Processing” script. I’ve found that preparing workshops is guaranteed to expose a bunch of rare and tricky software bugs, and this was no exception! Unfortunately the workshop was scheduled just before the QGIS 3.4.2 patch release which fixed these bugs, but at least they’re fixed now and we can move on…

The bulk of Nathan’s example algorithm is contained within the following block (where “distance” is the length of line segments we want to chop our features up into):

for input_feature in enumerate(features):
    geom = feature.geometry().constGet()
    if isinstance(geom, QgsLineString):
        continue
    first_part = geom.geometryN(0)
    start = 0
    end = distance
    length = first_part.length()

    while start < length:
        new_geom = first_part.curveSubstring(start,end)

        output_feature = input_feature
        output_feature.setGeometry(QgsGeometry(new_geom))
        sink.addFeature(output_feature)

        start += distance
        end += distance

There’s a lot here, but really the guts of this algorithm breaks down to one line:

new_geom = first_part.curveSubstring(start,end)

Basically, a new geometry is created for each trimmed section in the output layer by calling the “curveSubstring” method on the input geometry and passing it a start and end distance along the input line. This returns the portion of that input LineString (or CircularString, or CompoundCurve) between those distances. The PyQGIS API nicely hides the details here – you can safely call this one method and be confident that regardless of the input geometry type the result will be correct.

Unfortunately, while calling the “curveSubstring” method is elegant, all the code surrounding this call is not so elegant. As a (mostly) full-time QGIS developer myself, I tend to look over oddities in the API. It’s easy to justify ugly API as just “how it’s always been”, and over time it’s natural to develop a type of blind spot to these issues.

Let’s start with the first ugly part of this code:

geom = input_feature.geometry().constGet()
if isinstance(geom, QgsLineString):
    continue
first_part = geom.geometryN(0)
# chop first_part into sections of desired length
...

This is rather… confusing… logic to follow. Here the script is fetching the geometry of the input feature, checking if it’s a LineString, and if it IS, then it skips that feature and continues to the next. Wait… what? It’s skipping features with LineString geometries?

Well, yes. The algorithm was written specifically for one workshop, which was using a MultiLineString layer as the demo layer. The script takes a huge shortcut here and says “if the input feature isn’t a MultiLineString, ignore it — we only know how to deal with multi-part geometries”. Immediately following this logic there’s a call to geometryN( 0 ), which returns just the first part of the MultiLineString geometry.

There’s two issues here — one is that the script just plain won’t work for LineString inputs, and the second is that it ignores everything BUT the first part in the geometry. While it would be possible to fix the script and add a check for the input geometry type, put in logic to loop over all the parts of a multi-part input, etc, that’s instantly going to add a LOT of complexity or duplicate code here.

Fortunately, this was the perfect excuse to improve the PyQGIS API itself so that this kind of operation is simpler in future! Nathan and I had a debrief/brainstorm after the workshop, and as a result a new “parts iterator” has been implemented and merged to QGIS master. It’ll be available from version 3.6 on. Using the new iterator, we can simplify the script:

geom = input_feature.geometry()
for part in geom.parts():
    # chop part into sections of desired length
    ...

Win! This is simultaneously more readable, more Pythonic, and automatically works for both LineString and MultiLineString inputs (and in the case of MultiLineStrings, we now correctly handle all parts).

Here’s another pain-point. Looking at the block:

new_geom = part.curveSubstring(start,end)
output_feature = input_feature
output_feature.setGeometry(QgsGeometry(new_geom))

At first glance this looks reasonable – we use curveSubstring to get the portion of the curve, then make a copy of the input_feature as output_feature (this ensures that the features output by the algorithm maintain all the attributes from the input features), and finally set the geometry of the output_feature to be the newly calculated curve portion. The ugliness here comes in this line:

output_feature.setGeometry(QgsGeometry(new_geom))

What’s that extra QgsGeometry(…) call doing here? Without getting too sidetracked into the QGIS geometry API internals, QgsFeature.setGeometry requires a QgsGeometry argument, not the QgsAbstractGeometry subclass which is returned by curveSubstring.

This is a prime example of a “paper-cut” style issue in the PyQGIS API. Experienced developers know and understand the reasons behind this, but for newcomers to PyQGIS, it’s an obscure complexity. Fortunately the solution here was simple — and after the workshop Nathan and I added a new overload to QgsFeature.setGeometry which accepts a QgsAbstractGeometry argument. So in QGIS 3.6 this line can be simplified to:

output_feature.setGeometry(new_geom)

Or, if you wanted to make things more concise, you could put the curveSubstring call directly in here:

output_feature = input_feature
output_feature.setGeometry(part.curveSubstring(start,end))

Let’s have a look at the simplified script for QGIS 3.6:

for input_feature in enumerate(features):
    geom = feature.geometry()
    for part in geom.parts():
        start = 0
        end = distance
        length = part.length()

        while start < length:
            output_feature = input_feature
            output_feature.setGeometry(part.curveSubstring(start,end))
            sink.addFeature(output_feature)

            start += distance
            end += distance

This is MUCH nicer, and will be much easier to explain in the next workshop! The good news is that Nathan has more niceness on the way which will further improve the process of writing QGIS Processing script algorithms. You can see some early prototypes of this work here:

So there we go. The process of writing and delivering a workshop helps to look past “API blind spots” and identify the ugly points and traps for those new to the API. As a direct result of this FOSS4G/SOTM Oceania 2018 Workshop, the QGIS 3.6 PyQGIS API will be easier to use, more readable, and less buggy! That’s a win all round!

Results of the MacOS bug fixing initiative

Thanks to your donations, we were able to hire core developers to focus on solving Mac OS specific issues for QGIS. More than 30 MacOS QGIS users donated a little more than 3000 € for this bug fixing round.

After an effort of triage and testing, here is what has been achieved:

Unfortunately, some issues remain. Mainly, the text being rendered as outlines in PDF export (https://issues.qgis.org/issues/3975) remains for now. It might be fixed in a following effort.

Thanks to all donors who helped in this effort and to Denis Rouzaud as a core developer who spent a lot of time investigating and fixing these issues!

Movement data in GIS #16: towards pure Python trajectories using GeoPandas

Many of my previous posts in this series [1][2][3] have relied on PostGIS for trajectory data handling. While I love PostGIS, it feels like overkill to require a database to analyze smaller movement datasets. Wouldn’t it be great to have a pure Python solution?

If we look into moving object data literature, beyond the “trajectories are points with timestamps” perspective, which is common in GIS, we also encounter the “trajectories are time series with coordinates” perspective. I don’t know about you, but if I hear “time series” and Python, I think Pandas! In the Python Data Science Handbook, Jake VanderPlas writes:

Pandas was developed in the context of financial modeling, so as you might expect, it contains a fairly extensive set of tools for working with dates, times, and time-indexed data.

Of course, time series are one thing, but spatial data handling is another. Lucky for us, this is where GeoPandas comes in. GeoPandas has been around for a while and version 0.4 has been released in June 2018. So far, I haven’t found examples that use GeoPandas to manage movement data, so I’ve set out to give it a shot. My trajectory class uses a GeoDataFrame df for data storage. For visualization purposes, it can be converted to a LineString:

import pandas as pd 
from geopandas import GeoDataFrame
from shapely.geometry import Point, LineString

class Trajectory():
    def __init__(self, id, df, id_col):
        self.id = id
        self.df = df    
        self.id_col = id_col
        
    def __str__(self):
        return "Trajectory {1} ({2} to {3}) | Size: {0}".format(
            self.df.geometry.count(), self.id, self.get_start_time(), 
            self.get_end_time())
        
    def get_start_time(self):
        return self.df.index.min()
        
    def get_end_time(self):
        return self.df.index.max()
        
    def to_linestring(self):
        return self.make_line(self.df)
        
    def make_line(self, df):
        if df.size > 1:
            return df.groupby(self.id_col)['geometry'].apply(
                lambda x: LineString(x.tolist())).values[0]
        else:
            raise RuntimeError('Dataframe needs at least two points to make line!')

    def get_position_at(self, t):
        try:
            return self.df.loc[t]['geometry'][0]
        except:
            return self.df.iloc[self.df.index.drop_duplicates().get_loc(
                t, method='nearest')]['geometry']

Of course, this class can be used in stand-alone Python scripts, but it can also be used in QGIS. The following script takes data from a QGIS point layer, creates a GeoDataFrame, and finally generates trajectories. These trajectories can then be added to the map as a line layer.

All we need to do to ensure that our data is ordered by time is to set the GeoDataFrame’s index to the time field. From then on, Pandas takes care of the time series aspects and we can access the index as shown in the Trajectory.get_position_at() function above.

# Get data from a point layer
l = iface.activeLayer()
time_field_name = 't'
trajectory_id_field = 'trajectory_id' 
names = [field.name() for field in l.fields()]
data = []
for feature in l.getFeatures():
    my_dict = {}
    for i, a in enumerate(feature.attributes()):
        my_dict[names[i]] = a
    x = feature.geometry().asPoint().x()
    y = feature.geometry().asPoint().y()
    my_dict['geometry']=Point((x,y))
    data.append(my_dict)

# Create a GeoDataFrame
df = pd.DataFrame(data).set_index(time_field_name)
crs = {'init': l.crs().geographicCrsAuthId()} 
geo_df = GeoDataFrame(df, crs=crs)
print(geo_df)

# Test if spatial functions work
print(geo_df.dissolve([True]*len(geo_df)).centroid)

# Create a QGIS layer for trajectory lines
vl = QgsVectorLayer("LineString", "trajectories", "memory")
vl.setCrs(l.crs()) # doesn't stop popup :(
pr = vl.dataProvider()
pr.addAttributes([QgsField("id", QVariant.String)])
vl.updateFields() 

df_by_id = dict(tuple(geo_df.groupby(trajectory_id_field)))
trajectories = {}
for key, value in df_by_id.items():
    traj = Trajectory(key, value, trajectory_id_field)
    trajectories[key] = traj
    line = QgsGeometry.fromWkt(traj.to_linestring().wkt)
    f = QgsFeature()
    f.setGeometry(line)
    f.setAttributes([key])
    pr.addFeature(f) 
print(trajectories[1])

vl.updateExtents() 
QgsProject.instance().addMapLayer(vl)

The following screenshot shows this script applied to a sample of the Geolife datasets containing 100 trajectories with a total of 236,776 points. On my notebook, the runtime is approx. 20 seconds.

So far, GeoPandas has proven to be a convenient way to handle time series with coordinates. Trying to implement some trajectory analysis tools will show if it is indeed a promising data structure for trajectories.

User question of the Month – Nov 18

QGIS 2.18 is the third LTR since we started this effort back in 2015 and next year will see the first LTR of QGIS 3. On this occasion, we want to learn more about our users and which versions of QGIS they use. Therefore, we invite you to our QGIS user question of the month.

  • <<
  • Page 45 of 141 ( 2819 posts )
  • >>

Back to Top

Sustaining Members