Related Plugins and Tags

QGIS Planet

OpenCL acceleration now available in QGIS

What is OpenCL?

From https://en.wikipedia.org/wiki/OpenCL:

OpenCL (Open Computing Language) is a framework for writing programs that execute across heterogeneous platforms consisting of central processing units (CPUs), graphics processing units (GPUs), digital signal processors (DSPs), field-programmable gate arrays (FPGAs) and other processors or hardware accelerators. OpenCL specifies programming languages (based on C99 and C++11) for programming these devices and application programming interfaces (APIs) to control the platform and execute programs on the compute devices. OpenCL provides a standard interface for parallel computing using task- and data-based parallelism.

Basically, you write a program and you execute it on a GPU (or, less frequently, on a CPU or on a DSP) taking advantage of the huge parallel programming capabilities of the modern graphic cards.

Depending on many different factors, the speed gain can vary to a great extent, but it is typically around one order of magnitude.

How QGIS benefits from OpenCL?

The work I’ve done consisted in integrating OpenCL support into QGIS and writing all the utilities to load, build and run OpenCL programs.

For now, I’ve ported the following QGIS core algorithms, all of them are availabe in processing:

  • slope
  • aspect
  • hillshade
  • ruggedness

Since the framework to support OpenCL is now in place, I think that more algorithms will be ported over the time.

During this development, even if was not in scope, the hillshade renderer has been optimized for speed and it can also benefit of OpenCL acceleration.

How to activate OpenCL support

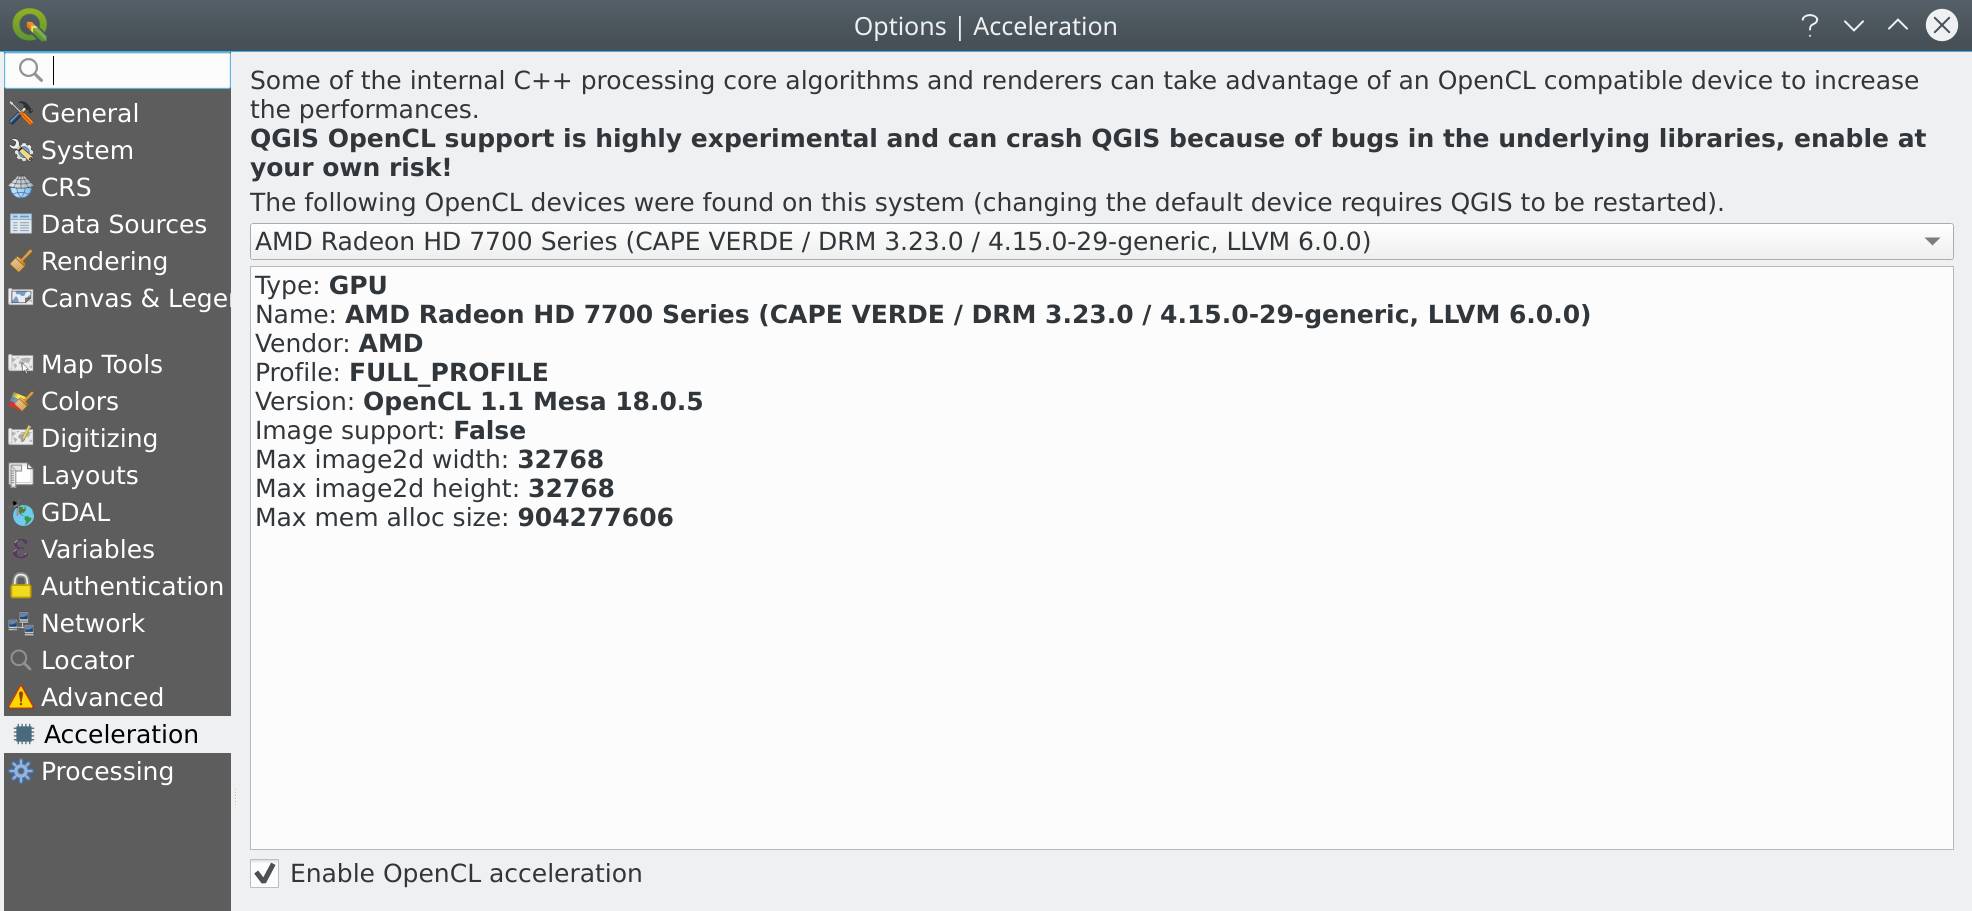
OpenCL support is optional and opt-in, to use it, you need to activate it into the QGIS options dialog like shown in the screenshot below:

How much performance gain can I expect?

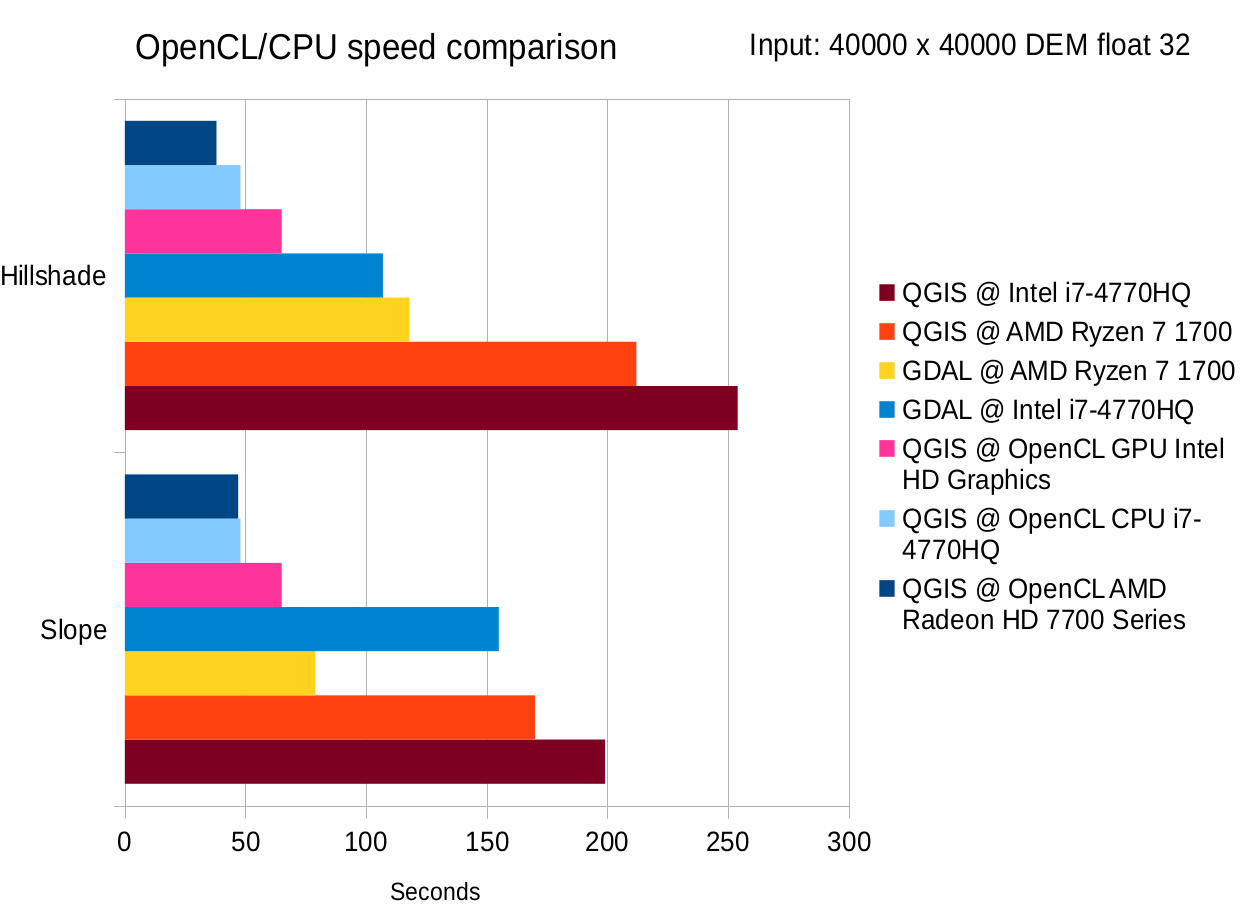
Well, YMMV, but here are some figures for a big DEM raster, low values mean faster execution.

GDAL means CPU execution using the GDAL processing algorithm.
How to install the OpenCL drivers?

Of course it depends on your specific hardware and on your O.S., AMD, NVidia and Intel have different distributions channels, in general the driver for your graphic card will also provide the OpenCL driver, if your GPU is compatible, if OpenCL is not available on your current machine, try to Google for OpenCL, your O.S. and graphic card.

If there is no OpenCL support for your graphic card, you might try to install a driver for your GPU (Intel for example provides them) and you will probably have a decent acceleration even if not as much as you can get on a real graphic card.

This fact worths some more explanation: you might ask your self why running and algorithm directly on the CPU and running it on the same CPU but using OpenCL would make any difference and the reason why it is generally faster by using OpenCL is that OpenCL will run the algorithm in parallel on all cores of your CPU, while a normal application (and QGIS does not make an exception here) will use a single core.

How to build QGIS with OpenCL support on Ubuntu

Just a quick note: you’ll need to install the OpenCL headers and the ICD library:

sudo apt-get install opencl-headers ocl-icd-opencl-dev


Credits

I started this work as a proof of concept in my spare time (that it is not much, lately) and when I realized that it was promising, I submitted a QGIS grant proposal in order to allocate some working time to port more algorithms, write tests and polish the implementation.

This work would not be possible without all the generous sponsors and donors that feed the QGIS grant program year after year, many thanks to the QGIS community for this amazing support!

Jürgen Fischer was as usual very helpful and took care of the windows builds, now available in OSGeo4W packages.

Nyall Dawson helped with the code review and with testing the implementation on different cards and machines.

Matthias Kuhn reviewed the code.

Even Rouault pointed me to some highly efficient GDAL algorithm optimizations that I’ve been able to integrate in QGIS.


The post OpenCL acceleration now available in QGIS first appeared on Open Web Solutions, GIS & Python Development.

Edit Features “In Place” Using QGIS Spatial Operations crowdfund launched!

We’ve just launched a new QGIS crowd funding campaign which we’re super-excited about! This time, we’re addressing what we see as the major shortcoming within QGIS vector layer editing tools, and bridging the gap between the vast power of QGIS’ Processing algorithms and easy-to-use operations which modify layer features “in place”. Here’s a quick sneak preview of what we have planned:


QGIS is already a vector editing powerhouse, and we believe that this improvement will boost the current functionality up an order of magnitude! To make it possible we need 6500€ pledged before 30 September 2018.

This is also our first crowdfunding campaign in which we’re running a “dual funding” approach, which we think should make things friendly and easy for both corporate backers and end user contributions alike. Read more about this at the full campaign page.

You can help make this a reality by supporting the campaign or by sharing the page and increasing exposure to the campaign. Updates to follow!


Celebrating 35 years of GRASS GIS!

Today marks 35 years of GRASS GIS development – with frequent releases the project keeps pushing the limits in terms of geospatial data processing quality and performance.

GRASS (Geographic Resources Analysis Support System) is a free and open source Geographic Information System (GIS) software suite used for geospatial data management and analysis, image processing, graphics and map production, spatial modeling, and 3D visualization. Since the major GRASS GIS 7 version, it also comes with a feature rich engine for space-time cubes useful for time series processing of Landsat and Copernicus Sentinel satellite data and more. GRASS GIS can be either used as a desktop application or as a backend for other software packages such as QGIS and R. Furthermore, it is frequently used on HPC and cloud infrastructures for massive parallelized data processing.

Brief history
In 1982, under the direction of Bill Goran at the U.S. Army Corps of Engineers Construction Engineering Research Laboratory (CERL), two GIS development efforts were undertaken. First, Lloyd Van Warren, a University of Illinois engineering student, began development on a new computer program that allowed analysis of mapped data.  Second, Jim Westervelt (CERL) developed a GIS package called “LAGRID – the Landscape Architecture Gridcell analysis system” as his master’s thesis. Thirty five years ago, on 29 July 1983, the user manual for this new system titled “GIS Version 1 Reference Manual” was first published by J. Westervelt and M. O’Shea. With the technical guidance of Michael Shapiro (CERL), the software continued its development at the U.S. Army Corps of Engineers Construction Engineering Research Laboratory (USA/CERL) in Champaign, Illinois; and after further expansion version 1.0 was released in 1985 under the name Geographic Resources Analysis Support System (GRASS). The GRASS GIS community was established the same year with the first annual user meeting and the launch of GRASSnet, one of the internet’s early mailing lists. The user community expanded to a larger audience in 1991 with the “Grasshopper” mailing list and the introduction of the World Wide Web. The users’ and programmers’ mailing lists archives for these early years are still available online.
In the mid 1990s the development transferred from USA/CERL to The Open GRASS Consortium (a group who would later generalize to become today’s Open Geospatial Consortium — the OGC). The project coordination eventually shifted to the international development team made up of governmental and academic researchers and university scientists. Reflecting this shift to a project run by the users, for the users, in 1999 GRASS GIS was released under the terms of the GNU General Public License (GPL). A detailed history of GRASS GIS can be found at https://grass.osgeo.org/history/.

Where to next?
The development on GRASS GIS continues with more energy and interest than ever. Parallel to the long-term maintenance of the GRASS 7.4 stable series, effort is well underway on the new upcoming cutting-edge 7.6 release, which will bring many new features, enhancements, and cleanups. As in the past, the GRASS GIS community is open to any contribution, be it in the form of programming, documentation, testing, and financial sponsorship. Please contact us!

About GRASS GIS

The Geographic Resources Analysis Support System (https://grass.osgeo.org/), commonly referred to as GRASS GIS, is an Open Source Geographic Information System providing powerful raster, vector and geospatial processing capabilities in a single integrated software suite. GRASS GIS includes tools for spatial modeling, visualization of raster and vector data, management and analysis of geospatial data, and the processing of satellite and aerial imagery. It also provides the capability to produce sophisticated presentation graphics and hardcopy maps. GRASS GIS has been translated into about twenty languages and supports a huge array of data formats. It can be used either as a stand-alone application or as backend for other software packages such as QGIS and R geostatistics. It is distributed freely under the terms of the GNU General Public License (GPL). GRASS GIS is a founding member of the Open Source Geospatial Foundation (OSGeo).

The GRASS Development Team, July 2018

The post Celebrating 35 years of GRASS GIS! appeared first on GFOSS Blog | GRASS GIS and OSGeo News.

blog:polska_grupa_uzytkownikow_qgis_na_facebooku

Na Facebooku uruchomiliśmy grupę o nazwie Polska Grupa Użytkowników QGIS, która jest odpowiedzią na rosnące zapotrzebowanie na takie miejsce w sieciach społecznościowych. Celem grupy jest promowanie QGIS jako wolnego i otwartego oprogramowania oraz wymiana wiedzy, umiejętności i doświadczeń. Zapraszamy do grupy wszystkich posiadających konto na FB i korzystających z QGIS. Zachęcamy też do aktywnego w niej uczestnictwa.

Movement data in GIS #15: writing a PL/pgSQL stop detection function for PostGIS trajectories

Do you sometimes start writing an SQL query and around at line 50 you get the feeling that it might be getting out of hand? If so, it might be useful to start breaking it down into smaller chunks and wrap those up into custom functions. Never done that? Don’t despair! There’s an excellent PL/pgSQL tutorial on postgresqltutorial.com to get you started.

To get an idea of the basic structure of a PL/pgSQL function and to proof that PostGIS datatypes work just fine in this context, here’s a basic function that takes a trajectory geometry and outputs its duration, i.e. the difference between its last and first timestamp:

CREATE OR REPLACE FUNCTION AG_Duration(traj geometry) 
RETURNS numeric LANGUAGE 'plpgsql'
AS $BODY$ 
BEGIN
RETURN ST_M(ST_EndPoint(traj))-ST_M(ST_StartPoint(traj));
END; $BODY$;

My end goal for this exercise was to implement a function that takes a trajectory and outputs the stops along this trajectory. Commonly, a stop is defined as a long stay within an area with a small radius. This leads us to the following definition:

CREATE OR REPLACE FUNCTION AG_DetectStops(
   traj geometry, 
   max_size numeric, 
   min_duration numeric)
RETURNS TABLE(sequence integer, geom geometry) 
-- implementation follows here!

Note how this function uses RETURNS TABLE to enable it to return all the stops that it finds. To add a line to the output table, we need to assign values to the sequence and geom variables and then use RETURN NEXT.

Another reason to use PL/pgSQL is that it enables us to write loops. And loops I wanted for my stop detection function! Specifically, I wanted to go through all the points in the trajectory:

FOR pt IN SELECT (ST_DumpPoints(traj)).geom LOOP
-- here comes the magic!
END LOOP;

Eventually the function should go through the trajectory and identify all segments that stay within an area with max_size diameter for at least min_duration time. To test for the area size, we can use:

IF ST_MaxDistance(segment,pt) <= max_size THEN is_stop := true; 

Putting everything together, my current implementation looks like this:

CREATE OR REPLACE FUNCTION AG_DetectStops(
   traj geometry,
   max_size numeric,
   min_duration numeric)
RETURNS TABLE(sequence integer, geom geometry) 
LANGUAGE 'plpgsql'
AS $BODY$
DECLARE 
   pt geometry;
   segment geometry;
   is_stop boolean;
   previously_stopped boolean;
   stop_sequence integer;
   p1 geometry;
BEGIN
segment := NULL;
sequence := 0;
is_stop := false;
previously_stopped := false;
p1 := NULL;
FOR pt IN SELECT (ST_DumpPoints(traj)).geom LOOP
   IF segment IS NULL AND p1 IS NULL THEN 
      p1 := pt; 
   ELSIF segment IS NULL THEN 
      segment := ST_MakeLine(p1,pt); 
      p1 := NULL;
      IF ST_Length(segment) <= max_size THEN is_stop := true; END IF; ELSE segment := ST_AddPoint(segment,pt); -- if we're in a stop, we want to grow the segment, otherwise we remove points to the specified min_duration IF NOT is_stop THEN WHILE ST_NPoints(segment) > 2 AND AG_Duration(ST_RemovePoint(segment,0)) >= min_duration LOOP
            segment := ST_RemovePoint(segment,0); 
         END LOOP;
      END IF;
      -- a stop is identified if the segment stays within a circle of diameter = max_size
      IF ST_Length(segment) <= max_size THEN is_stop := true; ELSIF ST_Distance(ST_StartPoint(segment),pt) > max_size THEN is_stop := false;
      ELSIF ST_MaxDistance(segment,pt) <= max_size THEN is_stop := true; ELSE is_stop := false; END IF; -- if we found the end of a stop, we need to check if it lasted long enough IF NOT is_stop AND previously_stopped THEN IF ST_M(ST_PointN(segment,ST_NPoints(segment)-1))-ST_M(ST_StartPoint(segment)) >= min_duration THEN
            geom := ST_RemovePoint(segment,ST_NPoints(segment)-1); 
            RETURN NEXT;
            sequence := sequence + 1;
            segment := NULL;
            p1 := pt;
         END IF;
      END IF;
   END IF;
   previously_stopped := is_stop;
END LOOP;
IF previously_stopped AND AG_Duration(segment) >= min_duration THEN 
   geom := segment; 
   RETURN NEXT; 
END IF;
END; $BODY$;

While this function is not really short, it’s so much more readable than my previous attempts of doing this in pure SQL. Some of the lines for determining is_stop are not strictly necessary but they do speed up processing.

Performance still isn’t quite where I’d like it to be. I suspect that all the adding and removing points from linestring geometries is not ideal. In general, it’s quicker to find shorter stops in smaller areas than longer stop in bigger areas.

Let’s test! 

Looking for a testing framework for PL/pgSQL, I found plpgunit on Github. While I did not end up using it, I did use its examples for inspiration to write a couple of tests, e.g.

CREATE OR REPLACE FUNCTION test.stop_at_beginning() RETURNS void LANGUAGE 'plpgsql'
AS $BODY$
DECLARE t0 integer; n0 integer;
BEGIN
WITH temp AS ( SELECT AG_DetectStops(
   ST_GeometryFromText('LinestringM(0 0 0, 0 0 1, 0.1 0.1 2, 2 2 3)'),
   1,1) stop 
)
SELECT ST_M(ST_StartPoint((stop).geom)), 
       ST_NPoints((stop).geom) FROM temp INTO t0, n0;	
IF t0 = 0 AND n0 = 3
   THEN RAISE INFO 'PASSED - Stop at the beginning of the trajectory';
   ELSE RAISE INFO 'FAILED - Stop at the beginning of the trajectory';
END IF;
END; $BODY$;

Basically, each test is yet another PL/pgSQL function that doesn’t return anything (i.e. returns void) but outputs messages about the status of the test. Here I made heavy use of the PERFORM statement which executes the provided function but discards the results:


Update: The source code for this function is now available on https://github.com/anitagraser/postgis-spatiotemporal

Movement data in GIS #14: updates from GI_Forum 2018

Last week, I traveled to Salzburg to attend the 30th AGIT conference and co-located English-speaking GI_Forum. Like in previous year, there were a lot of mobility and transportation research related presentations. Here are my personal highlights:

This year’s keynotes touched on a wide range of issues, from Sandeep Singhal (Google Cloud Storage) who – when I asked about the big table queries he showed – stated that they are not using a spatial index but are rather brute-forcing their way through massive data sets, to Laxmi Ramasubramanian @nycplanner (Hunter College City University of New York) who cautioned against tech arrogance and tendency to ignore expertise from other fields such as urban planning:

One issue that Laxmi particularly highlighted was the fact that many local communities are fighting excessive traffic caused by apps like Waze that suggest shortcuts through residential neighborhoods. Just because we can do something with (mobility) data, doesn’t necessarily mean that we should!

Not limited to mobility but very focused on open source, Jochen Albrecht (Hunter College City University of New York) invited the audience to join his quest for a spatial decision support system based on FOSS only at bit.ly/FiltersAndWeights and https://github.com/geojochen/fosssdss

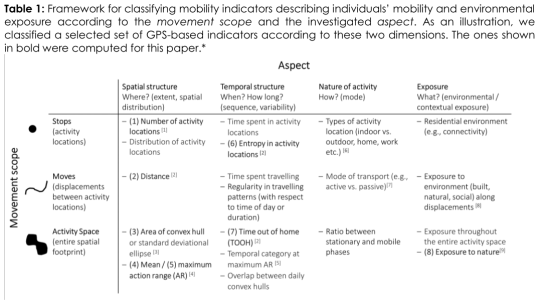
The session Spatial Perspectives on Healthy Mobility featured multiple interesting contributions, particularly by Michelle P. Fillekes who presented a framework of mobility indicators to assess daily mobility of study participants. It considers both spatial and temporal aspects of movement, as well as the movement context:

Figure from Michelle Pasquale Fillekes, Eleftheria Giannouli, Wiebren Zijlstra, Robert Weibel. Towards a Framework for Assessing Daily Mobility using GPS Data. DOI: 10.1553/giscience2018_01_s177 (under cc-by-nd)

It was also good to see that topics we’ve been working on in the past (popularity routing in this case) continue to be relevant and have been picked up in the German-speaking part of the conference:

Of course, I also presented some new work of my own, specifically my research into PostGIS trajectory datatypes which I’ve partially covered in a previous post on this blog and which is now published in Graser, A. (2018) Evaluating Spatio-temporal Data Models for Trajectories in PostGIS Databases. GI_Forum ‒ Journal of Geographic Information Science, 1-2018, 16-33. DOI: 10.1553/giscience2018_01_s16.

My introduction to GeoMesa talk failed to turn up any fellow Austrian GeoMesa users. So I’ll keep on looking and spreading the word. The most common question – and certainly no easy one at that – is how to determine the point where it becomes worth it to advance from regular databases to big data systems. It’s not just about the size of the data but also about how it is intended to be used. And of course, if you are one of those db admin whizzes who manages a distributed PostGIS setup in their sleep, you might be able to push the boundaries pretty far. On the other hand, if you already have some experience with the Hadoop ecosystem, getting started with tools like GeoMesa shouldn’t be too huge a step either. But that’s a topic for another day!

Since AGIT&GI_Forum are quite a big event with over 1,000 participants, it was not limited to movement data topics. You can find the first installment of English papers in GI_Forum 2018, Volume 1. As I understand it, there will be a second volume with more papers later this year.


This post is part of a series. Read more about movement data in GIS.

QGIS Server certified as official OGC reference implementation

We are very excited to announce that QGIS Server has been successfully certified as a compliant WMS 1.3 server against the OGC certification platform, and moreover, it is even considered as a reference implementation now!

This is the first step on our roadmap of having a fast, compliant and bullet proof web map server that is straightforward to publish from a classical QGIS project.

What does it mean?

Having a certified server means that QGIS Server successfully passes the automated and semi automated tests that ensure we are 100% compliant with the standards. That means you can trust QGIS to be used by any WMS client seamlessly.
Moreover, that certification is now powered by a continuous integration system that checks every night in developement versions if we still pass the tests.

Daily compliance reports are available on the new test.qgis.org website.

What’s next?

Building the automated testing platform and getting officially certified was only the first step. We now are starting to certify the WFS services, thanks to the latest grant application program support.

We also want QGIS server development to be performance-driven. The following projects are particularly relevant:

  • MS-Perf produces benchmark reports with MapServer and GeoServer.
  • graffiti  and PerfSuite tools have been designed to create a really light tool, easy to enrich with new datasets and performance tests, and easy to integrate in continuous integration systems. It compares QGIS-ltr, QGIS-rel and QGIS-dev nightlies for the same scenarios in details and produces html reports. It can also graph performance history for the development version to track regressions or improvements.

Many thanks to the supporters and voting members that helped bootstrap all those testing platforms and offer them to the community.

If you want to support or give a hand on the QGIS desktop client side, we think that area would deserve some love too!

QGIS 3.2 Bonn is released!

We are pleased to announce the release of QGIS 3.2 ‘Bonn’. The city of Bonn was the location of our 16th developer meeting.

splash32.png

This is the second release in the 3.x series. It comes with tons of new features (see our visual changelog).

Packages and installers for all major platforms are available from downloads.qgis.org.

We would like to thank the developers, documenters, testers and all the many folks out there who volunteer their time and effort (or fund people to do so). From the QGIS community we hope you enjoy this release! If you wish to donate time, money or otherwise get involved in making QGIS more awesome, please wander along to qgis.org and lend a hand!

QGIS is supported by donors and sponsors. A current list of donors who have made financial contributions large and small to the project can be seen on our donors list. If you would like to become and official project sponsor, please visit our sponsorship page for details. Sponsoring QGIS helps us to fund our six monthly developer meetings, maintain project infrastructure and fund bug fixing efforts. A complete list of current sponsors is provided below – our very great thank you to all of our sponsors!

QGIS is Free software and you are under no obligation to pay anything to use it – in fact we want to encourage people far and wide to use it regardless of what your financial or social status is – we believe empowering people with spatial decision making tools will result in a better society for all of humanity.


blog:i_spotkania_uzytkownikow_qgis_juz_za_nami

Pomysł na zorganizowanie tego spotkania kiełkował od lat, ale zawsze brakowało czasu na jego realizację. Główny problem polegał na określeniu docelowej grupy uczestników oraz formuły. Wiemy oczywiście, jak szerokie jest grono użytkowników programu QGIS, ale ta wiedza wcale nie ułatwiała zadania. Ostatecznie po przeprowadzeniu kilku ankiet na polskim forum QGIS postanowiliśmy zaserwować wszystkiego po trochu. Potrzebni byli tylko prelegenci, miejsce i termin. Zdecydowaliśmy się na 19 czerwca 2018…

QGIS Grant Programme 2018 Results

We are extremely pleased to announce the winning proposals for our 2018 QGIS.ORG grant programme. Funding for the programme was sourced by you, our project donors and sponsorsNote: For more context surrounding our grant programme, please see:

The QGIS.ORG Grant Programme aims to support work from our community that would typically not be funded by client/contractor agreements, and that contributes to the broadest possible swathe of our community by providing cross-cutting, foundational improvements to the QGIS Project.

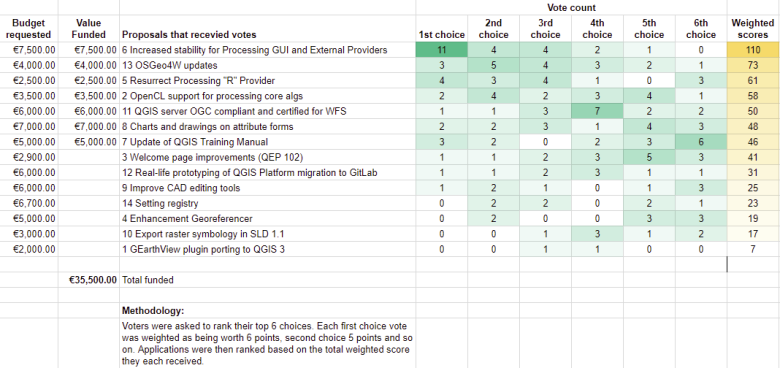
Voting to select the successful projects was carried out by our QGIS Voting Members. Each voting member was allowed to select up to 6 of the 14 submitted proposals by means of a ranked selection form. The full list of votes are available here (on the first sheet). The second sheet contains the calculations used to determine the winner (for full transparency). The table below summarizes the voting tallies for the proposals:

voting_results_2018

A couple of extra notes about the voting process:

  • The PSC has an ongoing program to fund documentation so elected to fund the QGIS Training Manual update even if this increases the total funded amount beyond the initial budget.
  • Although the budget for the grant programme was €25,000, the total amount for the winning proposals is €35,500. This increase is possible thanks to the generous support by our donors and sponsors this year.
  • Voting was carried out based on the technical merits of the proposals and the competency of the applicants to execute on these proposals.
  • No restrictions were in place in terms of how many proposals could be submitted per person / organization, or how many proposals could be awarded to each proposing person / organization.
  • Voting was ‘blind’ (voters could not see the existing votes that had been placed).

Of the 45 voting members, 29 registered their votes 17 community representatives and 12 user group representatives.

On behalf of the QGIS.ORG project, I would like to thank everyone who submitted proposals for this call!

A number of interesting and useful proposal didn’t make it because of our limited budget; we encourage organizations to pick up one of their choice and sponsor it.

PyQGIS for non-programmers

If you’re are following me on Twitter, you’ve certainly already read that I’m working on PyQGIS 101 a tutorial to help GIS users to get started with Python programming for QGIS.

I’ve often been asked to recommend Python tutorials for beginners and I’ve been surprised how difficult it can be to find an engaging tutorial for Python 3 that does not assume that the reader already knows all kinds of programming concepts.

It’s been a while since I started programming, but I do teach QGIS and Python programming for QGIS to university students and therefore have some ideas of which concepts are challenging. Nonetheless, it’s well possible that I overlook something that is not self explanatory. If you’re using PyQGIS 101 and find that some points could use further explanations, please leave a comment on the corresponding page.

PyQGIS 101 is a work in progress. I’d appreciate any feedback, particularly from beginners!

Create a QGIS vector data provider in Python is now possible


Why python data providers?

My main reasons for having Python data provider were:

  • quick prototyping
  • web services
  • why not?


This topic has been floating in my head for a while since I decided to give it a second look and I finally implemented it and merged for the next 3.2 release.


How it’s been done

To make this possible I had to:

  • create a public API for registering the providers
  • create the Python bindings (the hard part)
  • create a sample Python vector data provider (the boring part)
  • make all the tests pass


First, let me say that it wasn’t like a walk in the park: the Python bindings part is always like diving into woodoo and black magic recipes before I can get it to work properly.

For the Python provider sample implementation I decided to re-implement the memory (aka: scratch layers) provider because that’s one of the simplest providers and it does not depend on any external storage or backend.


How to and examples

For now, the main source of information is the API and the tests:

To register your own provider (PyProvider in the snippet below) these are the basic steps:

metadata = QgsProviderMetadata(PyProvider.providerKey(), PyProvider.description(), PyProvider.createProvider)
QgsProviderRegistry.instance().registerProvider(metadata)

To create your own provider you will need at least the following components:

  • the provider class itself (subclass of QgsVectorDataProvider)
  • a feature source (subclass of QgsAbstractFeatureSource)
  • a feature iterator (subclass of QgsAbstractFeatureIterator)

Be aware that the implementation of a data provider is not easy and you will need to write a lot of code, but at least you could get some inspiration from the existing example.


Enjoy wirting data providers in Python and please let me know if you’ve fond this implementation useful!

The post Create a QGIS vector data provider in Python is now possible first appeared on Open Web Solutions, GIS & Python Development.

QGIS User Conference 2018

This year’s QGIS User Conference will be embedded within the FOSS4G conference. That means that you should refer to the FOSS4G web site for all registration and event details with the exception of the QGIS Hackfest (22-26 August) which follows our normal organisation procedure on the QGIS Wiki.

There are five main activities for QGIS Users to enjoy at the conference:

  1. The QGIS Hackfest: This is our twice-yearly meet up to work on and improve the QGIS code base. Come along to this event if you want contribute documentation, bug fixes, bug reports, features and other ideas for improvements to the QGIS project. The hackfest is a side event to be held on the island of Zanzibar and will happen before the main conference. Again refer to the QGIS Hackfest wiki page for details and to register.
  2. The Workshops: FOSS4G is always popular for the wide range of workshops presented. The workshop presentations are very often by the developers of the software being explained, which gives you a unique opportunity to talk face to face with the people using the software you are using. There will be a number of QGIS specific workshops at FOSS4G – you will be able to identify them easily on the mobile app that provides the conference programme by filtering on ‘QGIS’ in the workshops section. For a current list of all the workshops at the event please refer to: https://2018.foss4g.org/workshop-schedule/ 
  3. The Presentations: There will be a wide range of QGIS related presentations during the main conference. 17 QGIS related presentations have been registered. See https://2018.foss4g.org/programme/list-of-presentations/ for a full list of the conference presentations.
  4. The Academic Track: This year a large number of academic papers have been submitted, a good number of which relate to QGIS. Watch the conference web site for more details to be published soon!
  5. The QGIS Plenary / Panel Discussion: During the conference we will have an ‘Ask Me Anything’ session with QGIS developers and community members forming a panel to field any questions you might want to ask! This is a unique opportunity to find out more about the project, its roadmap or just come along to say ‘thank you’ to the dedicated team of community members who put so much work into making QGIS!

If you have not already registered for FOSS4G2018, do so now to enjoy early bird rates! Visit the Registration Page for more details! We are looking forward to meeting you in Dar es Salaam and Zanzibar!

About the FOSS4G2018 Conference

The annual Free and Open Source Software 4 Geospatial. (FOSS4G) conference is the largest community gathering focused on open source geospatial software. FOSS4G brings together developers, users, decision-makers and observers from a broad spectrum of organizations and fields of operation. Through six days of workshops, presentations, discussions, and code sprints, FOSS4G participants, learn, exchange, and create new collaborations, geospatial products, standards.

FOSS4G is a global conference, with attendees from around the world! Last year, Boston, USA was the host city, before that in 2016 it Bonn, Germany. Now is the time for Dar es Salaam, Tanzania! FOSS4G 2018 will host numerous workshops over 27 – 28 August with exciting keynotes and presentations at the Julius Nyerere International Convention Centre 29 – 31 August, and finally Code Sprints and community building events September 1 & 2. In addition to bringing together the FOSS4G community in Dar, the 21st QGIS Developer meeting will take place in Zanzibar (a short 60min ferry trip away!) the 22 – 26 of August – the Geospatial Savanna is on the rise in East Africa!

The vision for the conference is to make it as accessible and inclusive as possible, bridging the gaps between the various communities that make us so strong, to make us stronger. This will be achieved through a Travel Grant Program that will enable economically disadvantaged participants the opportunity to attend, covering travel, lodging and conference costs. This will be bolstered by an exciting conference program, taking the very best that the open source geospatial community can offer. This ranges from locating schools to the instrumentation of communities with cheap, open source, 3D printed weather stations that improve community resilience to climate change.

The theme for FOSS4G 2018 is “Leave No-One Behind”. We live in a world where our users and developers have the opportunity to make a difference to the lives of everyone, whether it’s those in extreme poverty looking for access to clean water, to those using routing algorithms to calculate the fastest route to work. Location and geography are at the heart of these challenges and a FOSS4G 2018 in Dar es Salaam will invigorate our existing projects, bringing them to new users and developers while supporting and nurturing the existing community.

&#8220;QGZ&#8221; &#8211; A new default project file format for QGIS

Last year we had the opportunity to implement ‘.QGZ’ as  anew variant of  the QGIS 3 project file format.

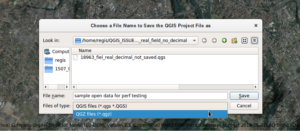
This is simply a zipped container for the QGS xml file. We took benefit of that container to store the auxiliary storage database into it – only if users choose that optional format though.

In classical mode, the auxiliary database is saved as a .qgd file  along the xml file.

qgd auxiliary storage file


qgz file format saving

When choosing the zipped container, the qgd file falls into the qgz, and this becomes totally transparent for end users. No more issues, you can’t delete it or forget to copy it when sharing project files!

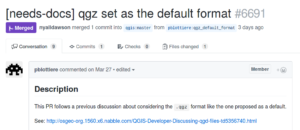
The great news today is that for qgis 3.2, qgz will be the default format!

This will offers many possibilities like embbeding:

  • Resources like fonts, SVG, color ramps, and all styling informations
  • A unified container for off-line editing embedding data into a gpkg format
  • plugins, scripts, processing algorithms and modelers

If you are interested in going further this, please contact us!

Locatieserver: about parcels and roadnumbers

For those interested in dutch OpenData: our national OpenData service PDOK has a Solr based geocoding service available. Since this week it is possible to search for ‘parcel’ codes to find cadastral parcels, but also to search on so called ‘hectometer-paaltjes': the little green number signs you see when you drive the dutch highways. So … Continue reading Locatieserver: about parcels and roadnumbers

New PyQGIS documentation

We are proud to announce our new dedicated documentation of the QGIS Python API (also called PyQGIS) which is now available at https://qgis.org/pyqgis:

While the QGIS API has long been documented, Python developers in the past had to work with the general C++ documentation that wasn’t always straightforward to use. The new PyQGIS documentation presents the API in an accessible pythonic manner.

Of course, creating a good API documentation from source code in an automated way, is not trivial. A key challenge was to automatically create Python bindings files (or SIP files). A custom Perl script known as “sipify” now enables us to automatically integrate the C++ documentation into the Python bindings and keep them up to date. Another challenge was to create the documentation itself using Sphinx. Two detailed reports containing all the technical details of the first and second generation of the documentation are available if you want to learn more about the underlying architecture.

This has been a really important infrastructure project for QGIS that has been made possible by support from our donors and sponsors, as well as the generous in-kind contributions of our community members.

  • <<
  • Page 47 of 141 ( 2819 posts )
  • >>

Back to Top

Sustaining Members