Introducing QGIS live layer effects!
I’m pleased to announce that the crowdfunded work on layer effects for QGIS is now complete and available in the current development snapshots! Let’s dive in and explore how these effects work, and check out some of the results possible using them.
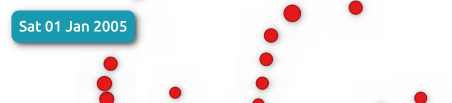
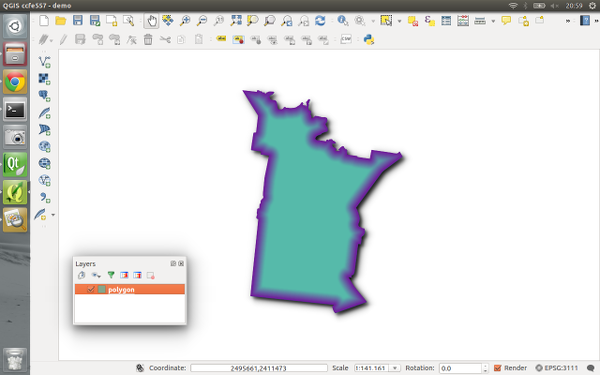
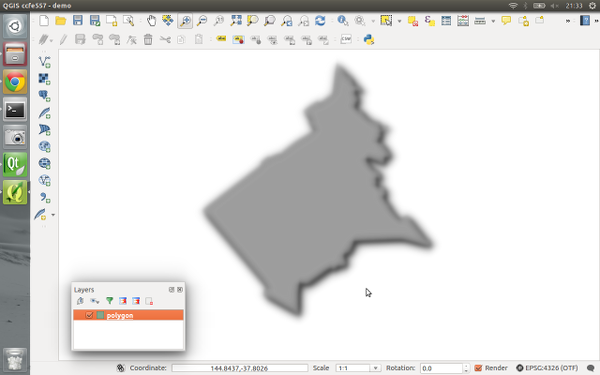
I’ll start with a simple polygon layer, with some nice plain styling:

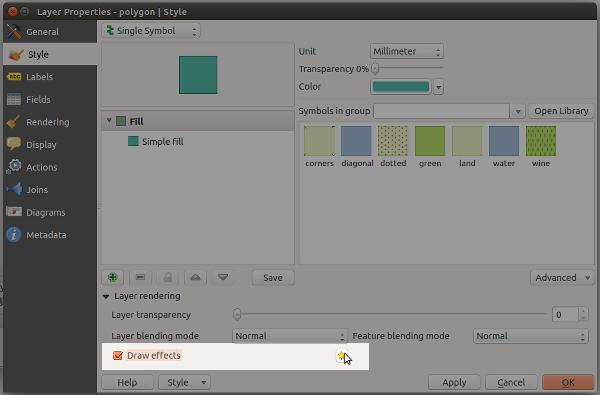
If I open the properties for this layer and switch to the Style tab, there’s a new checkbox for “Draw effects“. Let’s enable that, and then click the little customise effects button to its right:
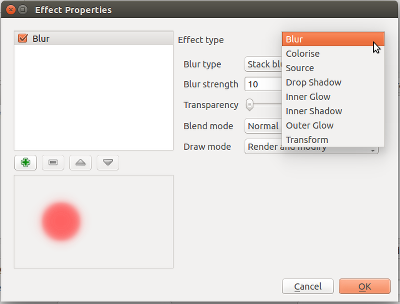
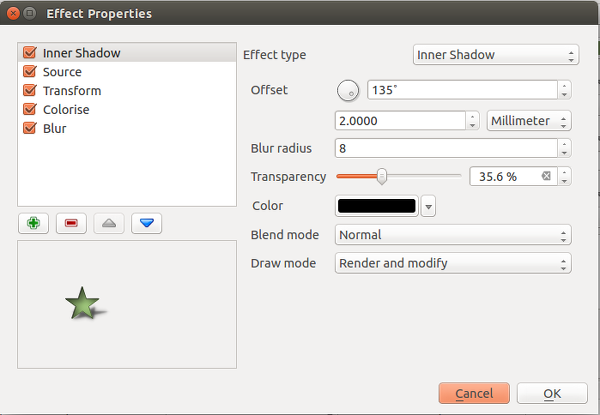
A new “Effects Properties” dialog opens:

You can see that currently the only effect listed is a “Source” effect. Source effects aren’t particularly exciting – all they do is draw the original layer unchanged. I’m going to change this to a “Blur” effect by clicking the “Effect type” combo box and selecting “Blur“:
If I apply the settings now, you’ll see that the polygon layer is now blurry. Now we’re getting somewhere!

Ok, so back to the Effects Properties dialog. Let’s try something a bit more advanced. Instead of just a single effect, it’s possible to chain multiple effects together to create different results. Let’s make a traditional drop shadow by adding a “Drop shadow” effect under the “Source” effect:

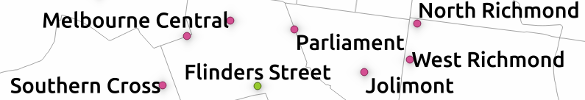
Effects are drawn top-down, so the drop shadow will appear below the source polygons:

Of course, if you really wanted, you could rearrange the effects so that the drop shadow effect is drawn above the source!..

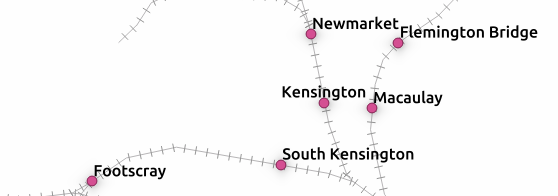
You can stack as many effects as you like. Here’s a purple inner glow over a source effect, with a drop shadow below everything:
Now it’s time to get a bit more creative… Let’s explore the “transform” effect. This effect allows you to apply all kinds of transformations to your layer, including scaling, shearing, rotation and translation:

Here’s what the layer looks like if I add a horizontally shearing transform effect above an outer glow effect:

Transforms can get really freaky. Here’s what happens if we apply a 180° rotation to a continents layer (with a subtle nod to xkcd):
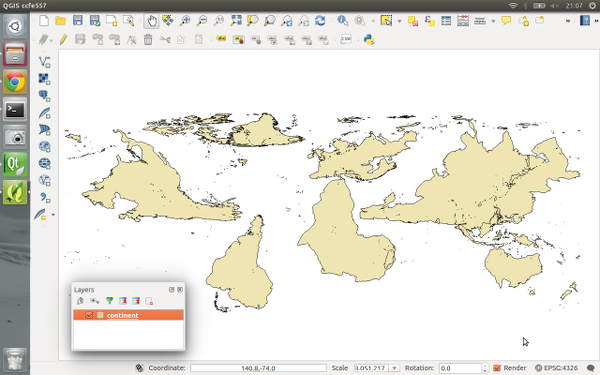
Remember that all these effects are applied when the layers are rendered, so no modifications are made to the underlying data.
Now, there’s one last concept regarding effects which really blasts open what’s possible with them, and that’s “Draw modes“. You’ll notice that this combo box contains a number of choices, including “Render“, “Modify” and “Render and Modify“:
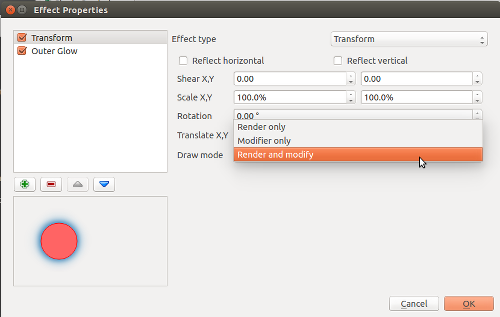
These draw modes control how effects are chained together. It’s easiest to demonstrate how draw modes work with an example, so this time I’ll start with a Transform effect over a Colorise effect. The transform effect is set to a 45° rotation, and the colorise effect set to convert to grayscale. To begin, I’ll set the transform effect to a draw mode of Render only:

In this mode, the results of the effect will be drawn but won’t be used to modify the underlying effects:
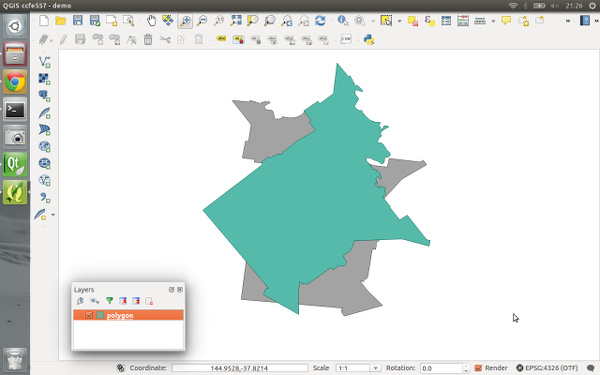
So what we have here is that the polygon is drawn rotated by 45° by the transform effect, and then underneath that there’s a grayscale copy of the original polygon drawn by the colorise effect. The results of the transform effect have been rendered, but they haven’t affected the underlying colorise effect.
If I instead set the Transform effect’s draw mode to “Modifier only” the results are quite different:
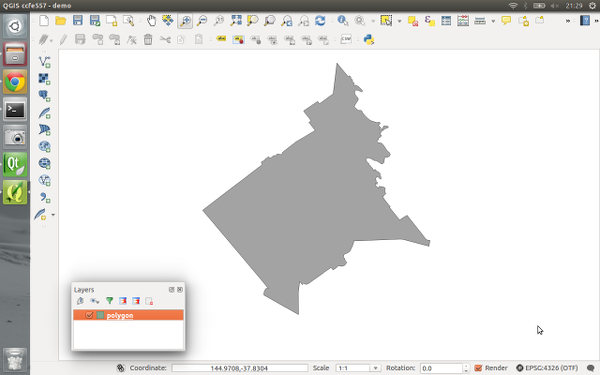
Now, the transform effect is rotating the polygon by 45° but the result is not rendered. Instead, it is passed on to the subsequent colorise effect, so that now the colorise effect draws a grayscale copy of the rotated polygon. Make sense? We could potentially chain a whole stack of modifier effects together to get some great results. Here’s a transform, blur, colorise, and drop shadow effect all chained together using modifier only draw modes:
The final draw mode, “Render and modify” both renders the effect and applies its result to underlying effects. It’s a combination of the two other modes. Using draw modes to customise the way effects chain is really powerful. Here’s a combination of effects which turn an otherwise flat star marker into something quite different:
The last thing I’d like to point out is that effects can be either applied to an entire layer, or to the individual symbol layers for features within a layer. Basically, the possibilities are almost endless! Python plugins can also extend this further by implementing additional effects.
All this work was funded through the 71 generous contributors who donated to the crowdfunding campaign. A big thank you goes out to you all whole made this work possible! I honestly believe that this feature takes QGIS’ cartographic possibilities to whole new levels, and I’m really excited to see the maps which come from it.
Lastly, there’s two other crowdfunding campaigns which are currently in progress. Lutra consulting is crowdfunding for a built in auto trace feature, and Radim’s campaign to extend the functionality of the QGIS GRASS plugin. Please check these out and contribute if you’re interested in their work and would like to see these changes land in QGIS.