Related Plugins and Tags

QGIS Planet

QA for Turn Restrictions in OSM

Correct turn restriction information is essential for the vehicle routing quality of any street network dataset – open or commercial. One of the challenges of this kind of information is that these restrictions are typically not directly visible on each map.

This post is inspired by a share on G+ which resurfaced in my notifications. In a post on the Mapbox blog, John Firebaugh presents the OSM iD editor which should make editing turn restrictions straight-forward: clicking on the source link turns the associated turn information visible. By clicking on the turn arrows, the user can easily toggle between allowed and forbidden.

iD, the web editor for OpenStreetMap, makes it even simpler to add turn restrictions to OpenStreetMap.

editing turn restrictions in iD, the web editor for OpenStreetMap. source: “Simple Editing for Turn Restrictions in OpenStreetMap” by John Firebaugh on June 06 2014

But the issue of identifying wrong turn restrictions remains. One approach to solving this issue is to compare restriction information in OSM with the information in a reference data set.

This is possible by comparing routes computed on OSM and the reference data using a method I presented at FOSS4G (video): a turn restriction basically is a forbidden combination of links. If we compute the route from the start link of the forbidden combination to the end link, we can check if the resulting route geometry violates the restriction or uses an appropriate detour:

read more about this method and results:

illustrative slide from my LBS2014 presentation on OSM vehicle routing quality – read more about this method and results for Vienna in our TGIS paper or the open pre-print version

It would be great to have an automated system comparing OSM and open government street network data to detect these differences. The quality of both data sets could benefit enormously by bundling their QA efforts. Unfortunately, the open government street network data sets I’m aware of don’t contain turn information.


Mozilla Stumbler layer: loading TMS and XYZ tilelayers in QGIS

Mozilla Location Service (MLS) layer Personally I’m very interested in the Mozilla Location Service (MLS), I wrote an earlier article about it on my work (Zuidt.nl) blog. Key in this project is that both locations of wifi points and cell towers are crowdsourced and put in a open database, so everybody can use that data … Continue reading Mozilla Stumbler layer: loading TMS and XYZ tilelayers in QGIS

Using Hy, a dialect of Lisp for Python, with QGIS

So tonight I rediscovered Hy. I had seen Hy before a while ago but never really sat down and tried it. Tonight just must have been one of those days to try something new.

So Hy is a dialect of Lisp but embedded in Python which means you can use any Python library will using a Lisp dialect. Pretty nifty.

My next thought was, how would this look using the QGIS libraries. So lets give it a try.

First we need to install Hy:

pip install Hy

Now just create a .hy file and add some code

(import qgis)
(import [qgis.core [QgsVectorLayer]])
(import [qgis.core.contextmanagers [qgisapp]])

(setv layers [])

(defn load-layer [file name]
    (setv layer (QgsVectorLayer file name "ogr"))
    (.append layers layer))

(defn print-layer [layer]
    (print "Layer Name:" (.name layer))
    (print "Valid:" (.isValid layer))
    (print "Extents:" (.toString (.extent layer))))

(defn main [app]
    (load-layer r"F:gis_datatest.shp" "test")
    (for [layer layers] (print-layer layer)))


(with [[app (apply qgisapp [] {"guienabled" False})]]
    (print "Loading QGIS")
    (main app))

run it in our shell and bingo.

F:devhy-qgis>hy qgistest.hy
Loading QGIS
Layer Name: test
Valid: True
Extents: 392515.3457026787800714,6461581.2076761415228248 : 392683.3794420150225051,6461705.1012571481987834

Sweet.

Just for reference the Python version of the above would be:

import qgis
from qgis.core import QgsVectorLayer
from qgis.core.contextmanagers import qgisapp

layers = []

def load_layer(file, name):
    layer = QgsVectorLayer(file, name, "ogr")
    layers.append(layer)

def print_layer(layer):
    print "Layer Name:", layer.name()
    print "Valid:", layer.isValid()
    print "Extents:", layer.extent().toString()

def main(app):
    load_layer(r"F:gis_datatest.shp", "test")
    for layer in layers:
        print_layer(layer)

with qgisappl(guienabled=False) as app:
    main(app)

More readable? No doubt, that is why I love Python, however the strange thing is the first time I looked at Lisp, including Hy, I thought “whoa all those parentheses back it up!1!” but strangely after using it for a while (read: not even a few hours) they don’t seem to be an issue, or not much of one anyway. YMMV.

The cool thing with using Hy is you can still use all the libraries you are used to as the example above shows, PyQt, QGIS, anything.

The other interesting, and pretty funky, thing is that you are able to import .hy files like normal Python files. If you create a file winning.hy you can just import winning into any Python application and it works.

Why bother? Mainly because learning something new is never a bad thing, and you never know what you might pick up.

Check out the Hy for more info on what you can do and how it works

I have also created a hy-qgis GitHub repo for some experiments.

Enjoy!


Filed under: Open Source

Using Hy, a dialect of Lisp for Python, with QGIS

So tonight I rediscovered Hy. I had seen Hy before a while ago but never really sat down and tried it. Tonight just must have been one of those days to try something new.

So Hy is a dialect of Lisp but embedded in Python which means you can use any Python library will using a Lisp dialect. Pretty nifty.

My next thought was, how would this look using the QGIS libraries. So lets give it a try.

First we need to install Hy:

pip install Hy

Now just create a .hy file and add some code

(import qgis)
(import [qgis.core [QgsVectorLayer]])
(import [qgis.core.contextmanagers [qgisapp]])

(setv layers [])

(defn load-layer [file name]
    (setv layer (QgsVectorLayer file name "ogr"))
    (.append layers layer))

(defn print-layer [layer]
    (print "Layer Name:" (.name layer))
    (print "Valid:" (.isValid layer))
    (print "Extents:" (.toString (.extent layer))))

(defn main [app]
    (load-layer r"F:\gis_data\test.shp" "test")
    (for [layer layers] (print-layer layer)))


(with [[app (apply qgisapp [] {"guienabled" False})]]
    (print "Loading QGIS")
    (main app))

run it in our shell and bingo.

F:\dev\hy-qgis>hy qgistest.hy
Loading QGIS
Layer Name: test
Valid: True
Extents: 392515.3457026787800714,6461581.2076761415228248 : 392683.3794420150225051,6461705.1012571481987834

Sweet.

Just for reference the Python version of the above would be:

import qgis
from qgis.core import QgsVectorLayer
from qgis.core.contextmanagers import qgisapp

layers = []

def load_layer(file, name):
    layer = QgsVectorLayer(file, name, "ogr")
    layers.append(layer)

def print_layer(layer):
    print "Layer Name:", layer.name()
    print "Valid:", layer.isValid()
    print "Extents:", layer.extent().toString()

def main(app):
    load_layer(r"F:\gis_data\test.shp", "test")
    for layer in layers:
        print_layer(layer)

with qgisappl(guienabled=False) as app:
    main(app)

More readable? No doubt, that is why I love Python, however the strange thing is the first time I looked at Lisp, including Hy, I thought "whoa all those parentheses back it up!1!" but strangely after using it for a while (read: not even a few hours) they don't seem to be an issue, or not much of one anyway. YMMV.

The cool thing with using Hy is you can still use all the libraries you are used to as the example above shows, PyQt, QGIS, anything.

The other interesting, and pretty funky, thing is that you are able to import .hy files like normal Python files. If you create a file winning.hy you can just import winning into any Python application and it works.

Why bother? Mainly because learning something new is never a bad thing, and you never know what you might pick up.

Check out the Hy for more info on what you can do and how it works

I have also created a hy-qgis GitHub repo for some experiments.

Enjoy!

Using Hy, a dialect of Lisp for Python, with QGIS

So tonight I rediscovered Hy. I had seen Hy before a while ago but never really sat down and tried it. Tonight just have been one of those days to try something new.

So Hy is a dialect of Lisp but embedded in Python which means you can use any Python library will using a Lisp dialect. Pretty nifty.

My next thought was, how would this look using the QGIS libraries. So lets give it a try.

First we need to install Hy:

pip install Hy

Now just create a .hy file and add some code

(import qgis)
(import [qgis.core [QgsVectorLayer]])
(import [qgis.core.contextmanagers [qgisapp]])

(setv layers [])

(defn load-layer [file name]
    (setv layer (QgsVectorLayer file name "ogr"))
    (.append layers layer))

(defn print-layer [layer]
    (print "Layer Name:" (.name layer))
    (print "Valid:" (.isValid layer))
    (print "Extents:" (.toString (.extent layer))))

(defn main [app]
    (load-layer r"F:\gis_data\test.shp" "test")
    (for [layer layers] (print-layer layer)))


(with [[app (apply qgisapp [] {"guienabled" False})]]
    (print "Loading QGIS")
    (main app))

run it in our shell and bingo.

F:\dev\hy-qgis>hy qgistest.hy
Loading QGIS
Layer Name: test
Valid: True
Extents: 392515.3457026787800714,6461581.2076761415228248 : 392683.3794420150225051,6461705.1012571481987834

Sweet.

Just for reference the Python version of the above would be:

import qgis
from qgis.core import QgsVectorLayer
from qgis.core.contextmanagers import qgisapp

layers = []

def load_layer(file, name):
    layer = QgsVectorLayer(file, name, "ogr")
    layers.append(layer)

def print_layer(layer):
    print "Layer Name:", layer.name()
    print "Valid:", layer.isValid()
    print "Extents:", layer.extent().toString()

def main(app):
    load_layer(r"F:\gis_data\test.shp", "test")
    for layer in layers:
        print_layer(layer)

with qgisappl(guienabled=False) as app:
    main(app)

More readable? No doubt, that is why I love Python, however the strange thing is the first time I looked at Lisp, including Hy, I thought "whoa all those parentheses back it up!1!" but strangely after using it for a while (read: not even a few hours) they don't seem to be an issue, or not much of one anyway. YMMV.

The cool thing with using Hy is you can still use all the libraries you are used to as the example above shows, PyQt, QGIS, anything.

The other interesting, and pretty funky, thing is that you are able to import .hy files like normal Python files. If you create a file winning.hy you can just import winning into any Python application and it works.

Why bother? Mainly because learning something new is never a bad thing, and you never know what you might pick up.

Check out the Hy for more info on what you can do and how it works

I have also created a hy-qgis GitHub repo for some experiments.

Enjoy!

QGIS 2.6 user guide released

The QGIS documentations team has released an updated version of the user guide:

qgisdocs26

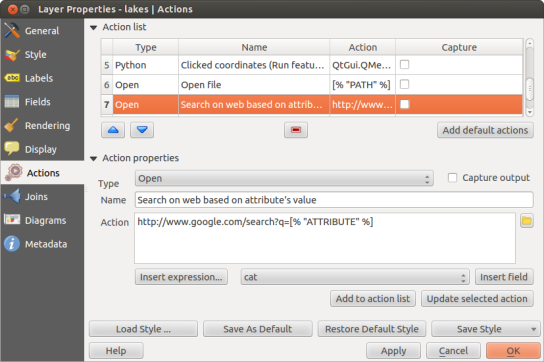
I’d like to encourage everyone to have a look and explore the content, for example the great tips in the Actions menu section:

action_dialog


QGIS 2.6.1 and QGIS 2.6 Documentation Released

QGIS 2.6.1 Just a short notice that the QGIS project (silently) released QGIS 2.6.1, a bug fix release for the latest stable version of QGIS 2.6 Brighton. Some notable fixes include: – composer stuff which was not working ok – not all attribute columns showing in attribute table – metasearch (CSW plugin) was not working … Continue reading QGIS 2.6.1 and QGIS 2.6 Documentation Released

Analyzing regional income differences

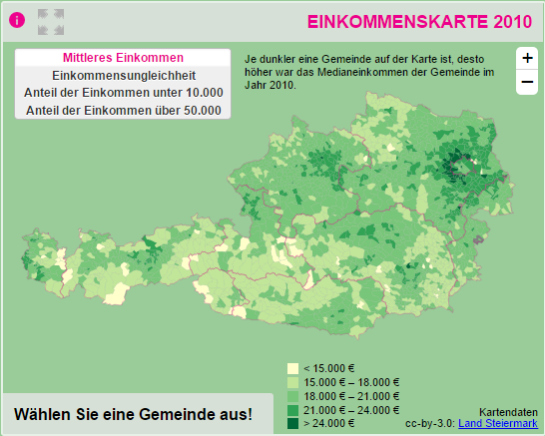
On my quest to create test data for spatial statistics, I’ve discovered income data for Austria per municipality on a news paper website:

Screenshot 2014-11-29 23.06.46

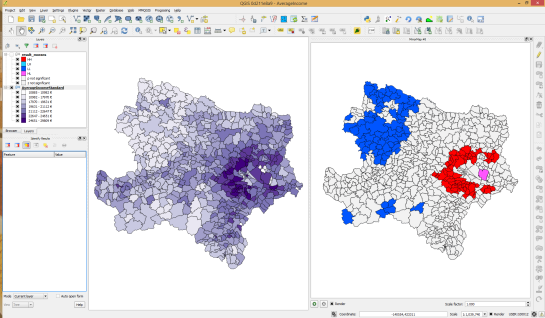
For further analysis, I decided to limit the area to Vienna and Lower Austria. Since the income data included GKZ “Gemeindekennzahl” IDs, it was possible to join them to municipalities extracted from OpenStreetMap using QuickOSM for QGIS. GRASS v.clean was used to clean the vector topology to the point where PySAL was able to compute spatial weights.

Using PySAL, I then computed income clusters: blue regions represent low clusters while red regions represent high clusters …

Municipality border data (c) OpenStreetMap and contributors Income data source: Statistik Austria via derStandard

Municipality border data (c) OpenStreetMap and contributors
Income data source: Statistik Austria via derStandard

The results show a statistically significant cluster of low income in the north west, in the area called Waldviertel, as well as a cluster of high income containing many of the municipalities surrounding Vienna, an area often referred to as the “Speckgürtel” (“bacon belt”).


Releasing TimeManager 1.2

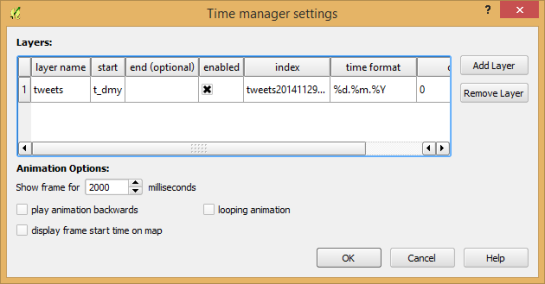
Today, I’ve released TimeManager 1.2 which adds support for additional time formats: DD.MM.YYYY, DD/MM/YYYY, and DD-MM-YYYY (thanks to a pull request by vmora) as well as French translation (thanks to bbouteilles).

TimeManager now automatically detects formats such as DD.MM.YYYY

TimeManager now automatically detects formats such as DD.MM.YYYY

But there is more: the QGIS team has released a bugfix version 2.6.1 which you can already find in Ubuntu repos and the OSGeo4W installer. Go get it! And please support the bugfix release effort whenever you can.


Landsat 8 captures Trentino in November 2014

The beautiful days in early November 2014 allowed to get some nice views of the Trentino (Northern Italy) – thanks to Landsat 8 and NASA’s open data policy:

Landsat 8: Northern Italy 1 Nov 2014

Trento captured by Landsat8

Landsat 8: San Michele - 1 Nov 2014
Landsat 8: San Michele – 1 Nov 2014

The beauty of the landscape but also the human impact (landscape and condensation trails of airplanes) are clearly visible.

All data were processed in GRASS GIS 7 and pansharpened with i.fusion.hpf written by Nikos Alexandris.

The post Landsat 8 captures Trentino in November 2014 appeared first on GFOSS Blog | GRASS GIS Courses.

A new QGIS tool (based on ogr2ogr) to import vectors in PostGIS, the fast way

In QGIS there are many tools that can be used to import vectors inside a PostGIS database, each one has pros and cons: SPIT core plugin: available since long ago but now seems to be a unmaintained tool and therefore will be probably removed in a future QGIS release. It  has the advantage to allow […]

New QGIS plugin – “Walking time”

EN | PT

I have finally “finished” my new plugin. I uses some quotation marks, since I believe that there is still space for a few improvement. This plugin arised with the need to calculate the travel time for the Cascais oficial pedestrian routes, and started as a simple python script. I have then decided to create a graphic interface and publish it as a plugin in the hope that someone else finds it useful.

icon_largeWalking time is a QGIS python plugin that uses Tobbler’s hiking function to estimate the travel time along a line depending on the slope.

The input data required are a vector layer with lines and a raster layer with elevation values ​​(1). One can adjust the base velocity (on flat terrain) according to the type of walking or walker. By default, the value used is 5 km h (2). The plugin update or create fields with estimated time in minutes in forward and in reverse direction (3). One can run the plugin for all elements of the vector layer, or only on selected routes (4).

The plugin can also been used to prepare a network (graph) to perform network analysis when the use of travel walking time as cost is intended.

Captura de tela 2014-03-24 12.12.17-01

QGIS repository: http://plugins.qgis.org/plugins/walkingtime/

Code: https://github.com/SrNetoChan/WalkingTime

Bug report: https://github.com/SrNetoChan/WalkingTime/issues


Old map in QGIS

EN | PT

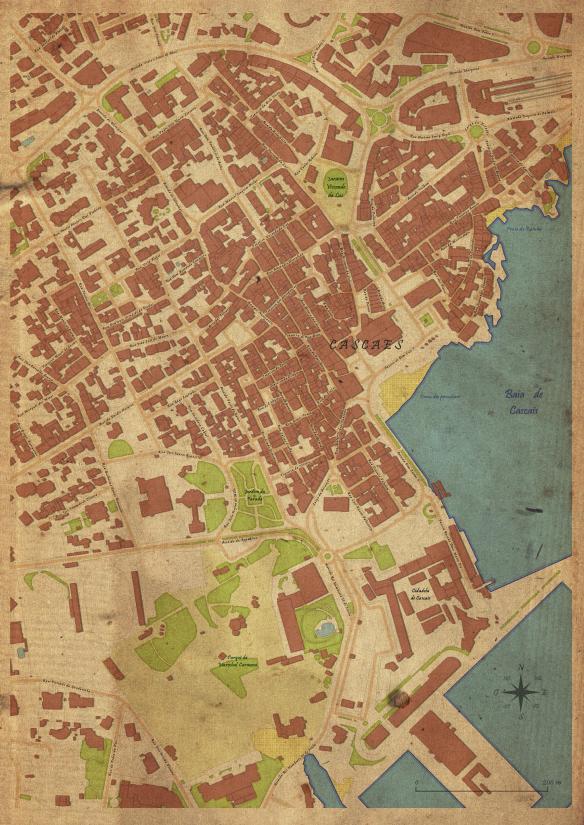
Inspired in a post by Anita Graser, I’ve tried to use QGIS to create a Cascais‘s old looking map, as if it have been drawn by hand in a methodical way.

Defining the styles

I have started by defining the styles for each elements to represent.

Buildings

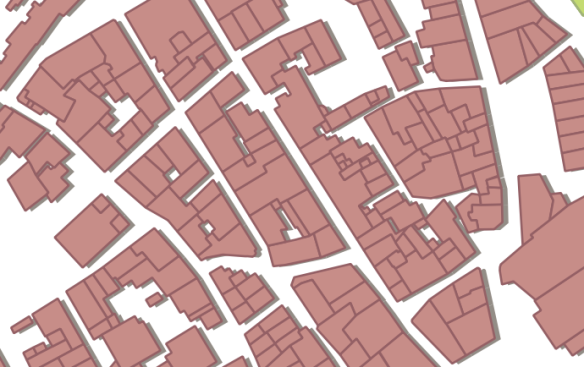
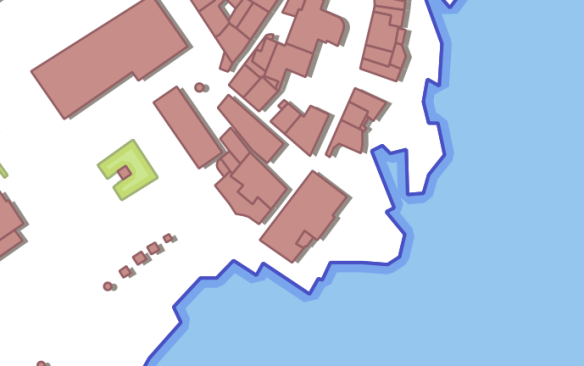
To fill the buildings, I have tried to use a color that reminds me the portuguese roofs, similar to the color commonly used in old maps of cities, with a slightly darker outline of the same color.

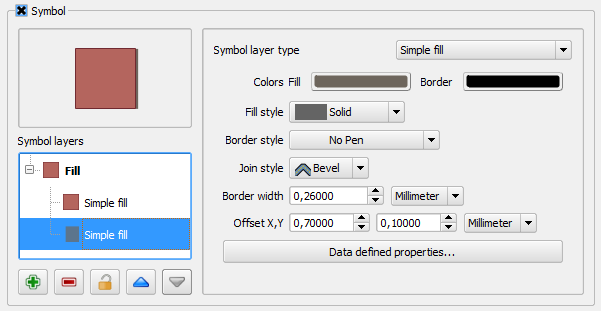
To give a bit of dimension, a shadow was created beneath, using a “simple fill” with dark colors and using a Offset X,Y. The values were chosen assuming the predominant direction of building’s facades, so that the effect could be seen all over the map area.

Capturar_4Capturar_6

Green spaces

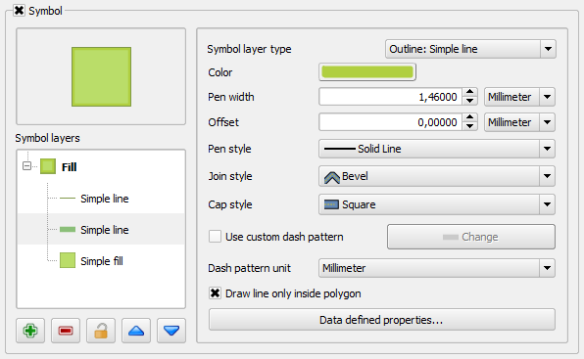
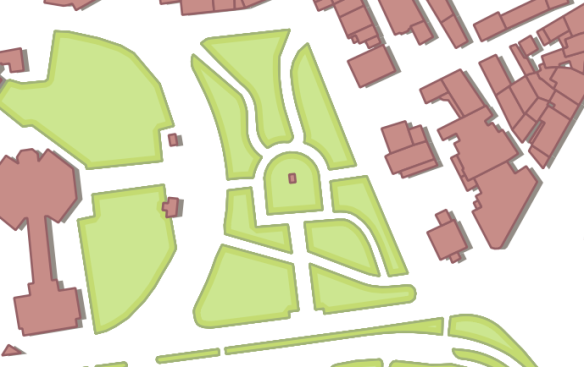
For the green spaces, 3 symbol layers were used. One with a green “simple fill”. A second one with a thick outline (outline: simple line) in a darker green, and using the new 2.2 functionality that allows one to show outlines only in the polygons inside.

Capturar_5The last symbol layer is just a tin line of a green even darker than the other two.

Capturar_7

The Sea

For the sea, the same effect as the green spaces was used, but in blues and with the middle outline even thicker.
Capturar_8

Roads

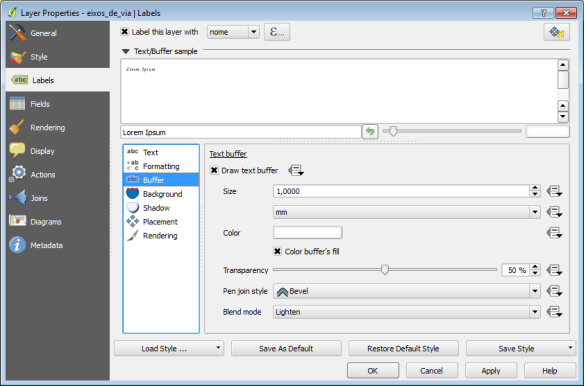
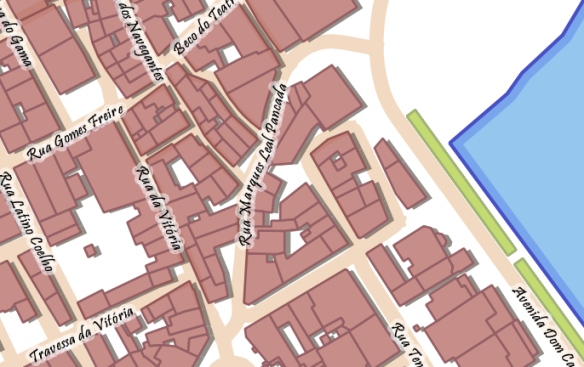
In the road, it was used a thick line with a orange pastel color. Some street names labels were created on top of the line using a script font (in have used Pristina Bold). To improve the label readability, a small white buffer with 50% transparency was added.
Captura de tela 2014-04-11 17.55.04Capturar_9

Beach

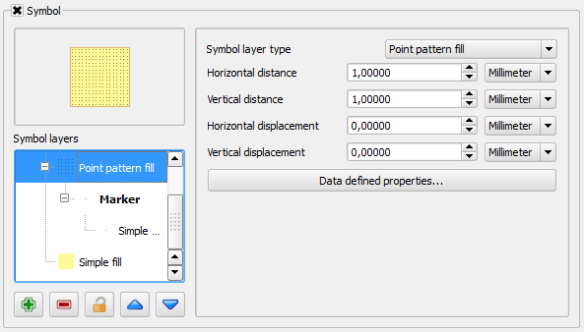
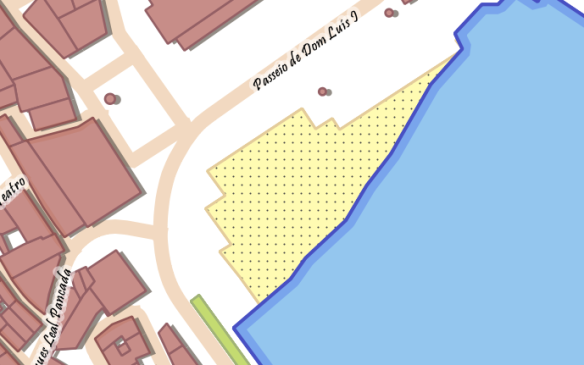
In the beaches, besides a simple fill as background, a point patern fill was used with a very small dot.
Capturar_11Capturar_10

Map composing

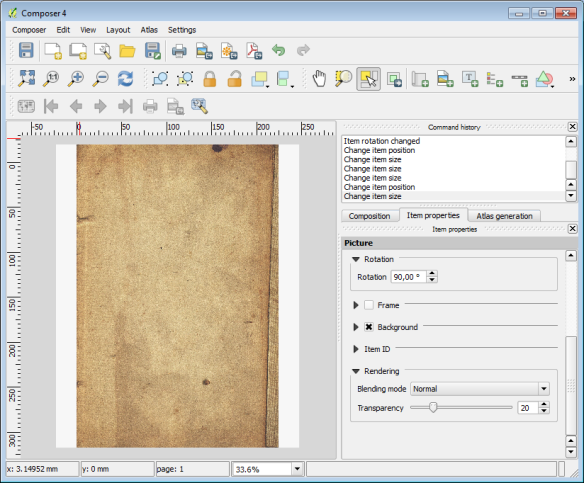
Though the map is looking almost done, it’s in the print composer that the final touches are given. First, the map sheet is totally covered with an image of an old papel (the same used by Anita). A bit of transparency is added (20%), so that the effect is not too strong.

Captura de tela 2014-04-14 11.24.53

Alterwards, the actual map is added, and in the map item properties, the rendering mode is changed from “normal” (by default) to “multiply”. This way it looks like if the map was draw directly on the old paper.

Captura de tela 2014-04-14 11.30.07

After this, it’s all about adding a few more labels (the beach and places names), a north arrow and the graphic scale (always using “multiply” rendering mode), and… Voilá, we have a map!

mapa_antigo


Map corner coordinates in QGIS

EN | PT

Some time ago in the qgis-pt mailing list, someone asked how to show the coordinates of a map corners using QGIS. Since this features wasn’t available (yet), I have tried to reach a automatic solution, but without success,  After some thought about it and after reading a blog post by Nathan Woodrow, it came to me that the solution could be creating a user defined function for the expression builder to be used in labels in the map.

Closely following the blog post instructions, I have created a file called userfunctions.py in the  .qgis2/python folder and, with a help from Nyall Dawson I wrote the following code.

from qgis.utils import qgsfunction, iface
from qgis.core import QGis

@qgsfunction(2,"python")
def map_x_min(values, feature, parent):
 """
 Returns the minimum x coordinate of a map from
 a specific composer.
 """
 composer_title = values[0]
 map_id = values[1]
 composers = iface.activeComposers()
 for composer_view in composers():
  composer_window = composer_view.composerWindow()
  window_title = composer_window.windowTitle()
  if window_title == composer_title:
   composition = composer_view.composition()
   map = composition.getComposerMapById(map_id)
   if map:
    extent = map.currentMapExtent()
    break
 result = extent.xMinimum()
 return result

After running the command import userfunctions in the python console  (Plugins > Python Console), it was already possible to use the  map_x_min() function (from the python category) in an expression to get the minimum X value of the map.

Screenshot from 2014-09-09 16^%29^%29

All I needed now was to create the other three functions,  map_x_max(), map_y_min() and map_y_max().  Since part of the code would be repeated, I have decided to put it in a function called map_bound(), that would use the print composer title and map id as arguments, and return the map extent (in the form of a QgsRectangle).

from qgis.utils import qgsfunction, iface
from qgis.core import QGis

def map_bounds(composer_title, map_id):
 """
 Returns a rectangle with the bounds of a map
 from a specific composer
 """
 composers = iface.activeComposers()
 for composer_view in composers:
  composer_window = composer_view.composerWindow()
  window_title = composer_window.windowTitle()
  if window_title == composer_title:
   composition = composer_view.composition()
   map = composition.getComposerMapById(map_id)
   if map:
    extent = map.currentMapExtent()
    break
 else:
  extent = None

 return extent

With this function available, I could now use it in the other functions to obtain the map X and Y minimum and maximum values, making the code more clear and easy to maintain. I also add some mechanisms to the original code to prevent errors.

@qgsfunction(2,"python")
def map_x_min(values, feature, parent):
 """
 Returns the minimum x coordinate of a map from a specific composer.
 Calculations are in the Spatial Reference System of the project.
<h2>Syntax</h2>
map_x_min(composer_title, map_id)
<h2>Arguments</h2>
composer_title - is string. The title of the composer where the map is.
 map_id - integer. The id of the map.
<h2>Example</h2>
map_x_min('my pretty map', 0) -> -12345.679

 """
 composer_title = values[0]
 map_id = values[1]
 map_extent = map_bounds(composer_title, map_id)
 if map_extent:
  result = map_extent.xMinimum()
 else:
  result = None

 return result

@qgsfunction(2,"python")
def map_x_max(values, feature, parent):
 """
 Returns the maximum x coordinate of a map from a specific composer.
 Calculations are in the Spatial Reference System of the project.
<h2>Syntax</h2>
map_x_max(composer_title, map_id)
<h2>Arguments</h2>
composer_title - is string. The title of the composer where the map is.
 map_id - integer. The id of the map.
<h2>Example</h2>
map_x_max('my pretty map', 0) -> 12345.679

 """
 composer_title = values[0]
 map_id = values[1]
 map_extent = map_bounds(composer_title, map_id)
 if map_extent:
  result = map_extent.xMaximum()
 else:
  result = None

 return result

@qgsfunction(2,"python")
def map_y_min(values, feature, parent):
 """
 Returns the minimum y coordinate of a map from a specific composer.
 Calculations are in the Spatial Reference System of the project.
<h2>Syntax</h2>
map_y_min(composer_title, map_id)
<h2>Arguments</h2>
composer_title - is string. The title of the composer where the map is.
 map_id - integer. The id of the map.
<h2>Example</h2>
map_y_min('my pretty map', 0) -> -12345.679

 """
 composer_title = values[0]
 map_id = values[1]
 map_extent = map_bounds(composer_title, map_id)
 if map_extent:
  result = map_extent.yMinimum()
 else:
  result = None

 return result

@qgsfunction(2,"python")
def map_y_max(values, feature, parent):
 """
 Returns the maximum y coordinate of a map from a specific composer.
 Calculations are in the Spatial Reference System of the project.
<h2>Syntax</h2>
map_y_max(composer_title, map_id)
<h2>Arguments</h2>
composer_title - is string. The title of the composer where the map is.
 map_id - integer. The id of the map.
<h2>Example</h2>
map_y_max('my pretty map', 0) -> 12345.679

 """
 composer_title = values[0]
 map_id = values[1]
 map_extent = map_bounds(composer_title, map_id)
 if map_extent:
  result = map_extent.yMaximum()
 else:
  result = None

 return result

The functions became available to the expression builder in the “Python” category (could have been any other name) and the functions descriptions are formatted as help texts to provide the user all the information needed to use them.

Screenshot from 2014-09-09 15^%39^%19

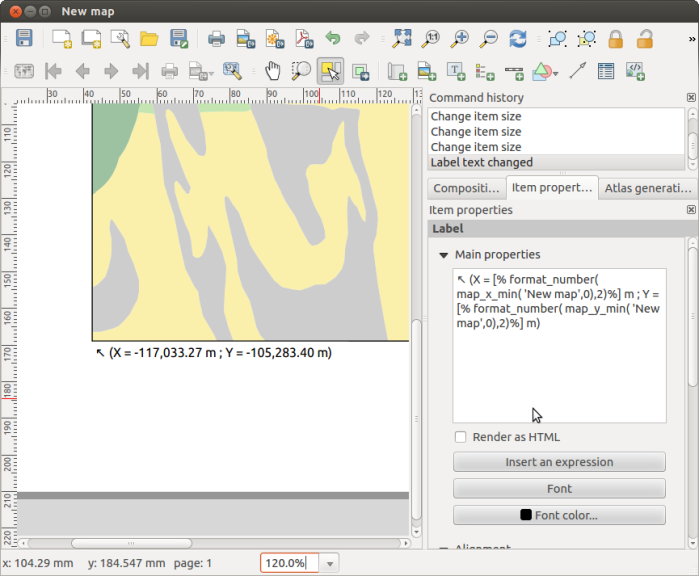
Using the created functions, it was now easy to put the corner coordinates in labels near the map corners. Any change to the map extents is reflected in the label, therefore quite useful to use with the atlas mode.

Screenshot from 2014-09-09 15^%40^%27

The functions result can be used with other functions. In the following image, there is an expression to show the coordinates in a more compact way.

Screenshot from 2014-09-09 15^%43^%55

There was a setback… For the functions to become available, it was necessary to manually import them in each QGIS session. Not very practical. Again with Nathan’s help, I found out that it’s possible to import python modules at QGIS startup by putting a startup.py file with the import statements in the .qgis2/python folder. In my case, this was enough.

import userfunctions

I was pretty satisfied with the end result. The ability to create your own functions in expressions demonstrates once more how easy it is to customize QGIS and create your own tools. I’m already thinking in more applications for this amazing functionality.

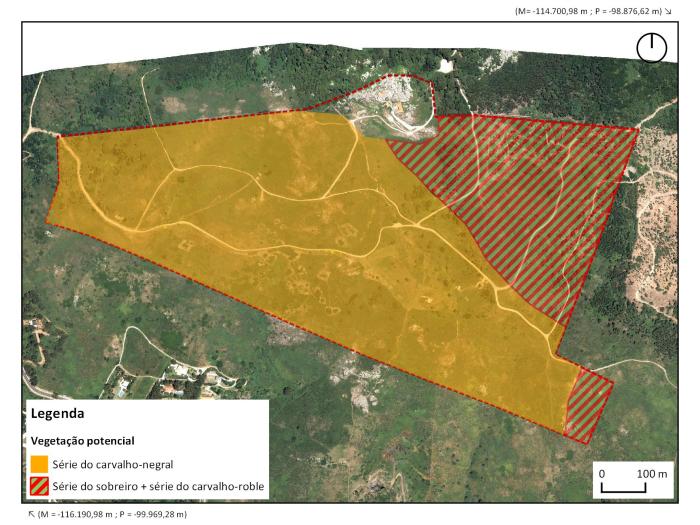
UT 9 - Qta da Peninha - Vegetação potencial

You can download the Python files with the functions HERE. Just unzip both files to the .qgis2/python folder, and restart QGIS, and the functions should become available.

Disclaimer: I’m not an English native speaker, therefore I apologize for any errors, and I will thank any advice on how to improve the text.

Multiple format map series using QGIS 2.6 – Part 1

EN | PT

As always, the new QGIS version (QGIS 2.6 Brigthon) brings a vast new set of features that will allow the user to do more, better and faster than with the earlier version. One of this features is the ability to control some of the composer’s items properties with data (for instance, size and position). Something that will allow lots of new interesting usages. In the next posts, I propose to show how to create map series with multiple formats.

In this first post, the goal is that, keeping the page size, the map is created with the most suitable orientation (landscape or portrait) to fit the atlas feature. To exemplify, I will be using the Alaska’s sample dataset to create a map for each of Alaska’s regions.

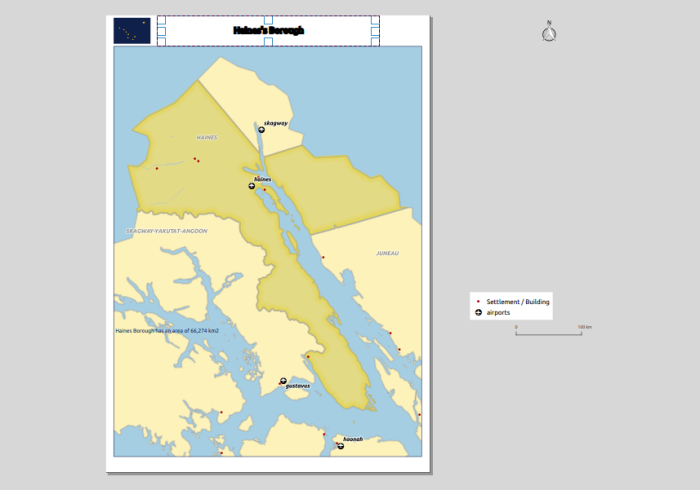
I have started by creating the layout in one of the formats, putting the items in the desired positions.

mapa_base_atlas

To control the page orientation with the atlas feature, in the composition tab, I used the following expression in the orientation data defined properties:

CASE WHEN bounds_width( $atlasgeometry ) >=  bounds_height( $atlasgeometry ) THEN 'landscape' ELSE 'portrait' END

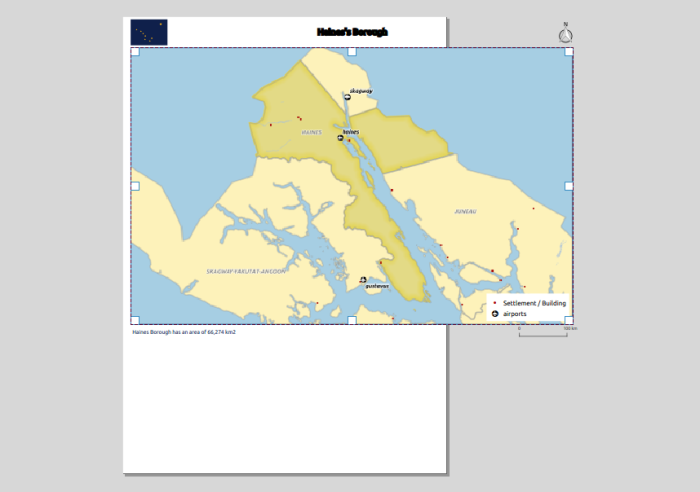
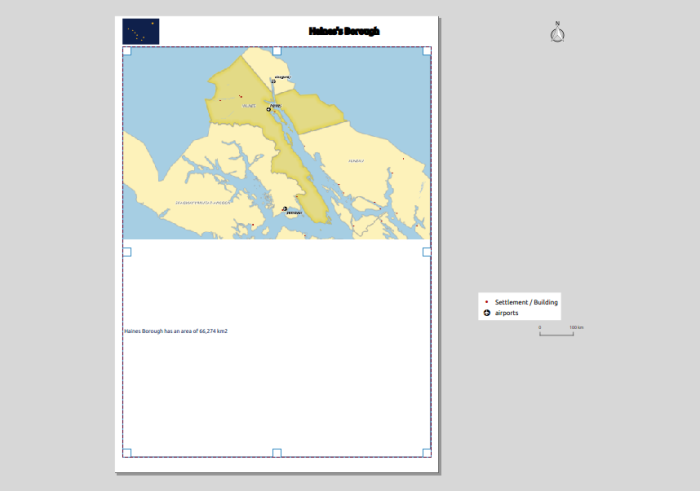
Using the atlas preview, I could verify that the page’s orientation changed according to the form of the atlas feature. However, the composition’s items did not follow this change and some got even outside the printing area

Screenshot from 2014-11-08 23:29:49

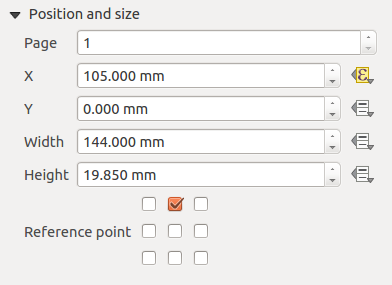
To control both size and position of the composition’s items I had in consideration the A4 page size (297 x 210 mm), the map margins ( 20 mm, 5 mm, 10 mm, 5 mm) and the item’s reference points.

For the map item, using the upper left corner as reference point, it was necessary to change it’s height and width. I knew that the item height was the subtraction of the top and bottom margins (30 mm) from the page height, therefore I used the following expression:

(CASE WHEN  bounds_width(  $atlasgeometry ) >=  bounds_height( $atlasgeometry) THEN 297 ELSE 210 END) - 30

Likewise, the expression to use in the width was:

(CASE WHEN  bounds_width(  $atlasgeometry ) >=  bounds_height( $atlasgeometry) THEN 210 ELSE 297 END) - 10

Screenshot from 2014-11-09 00:02:15

The rest of the items were always at a relative position of the page without the need to change their size and therefore only needed to control their position. For example, the title was centered at the page’s top, and therefore, using the top-center as reference point, all that was needed was the following expression for the X position:

Screenshot from 2014-11-09 00:13:17

(CASE WHEN  bounds_width(  $atlasgeometry ) >=  bounds_height( $atlasgeometry)  THEN 297 ELSE 210 END)  / 2.0

Screenshot from 2014-11-09 00:30:57

On the other hand, the legend needed to change the position in both X and Y. Using the bottom-right-corner as reference point, the X position expression was:

(CASE WHEN  bounds_width(  $atlasgeometry ) >=  bounds_height( $atlasgeometry) THEN 297 ELSE 210 END) - 7

And for the Y position:

(CASE WHEN  bounds_width(  $atlasgeometry ) >=  bounds_height( $atlasgeometry) THEN 210 ELSE 297 END) - 12

Screenshot from 2014-11-09 00:47:28

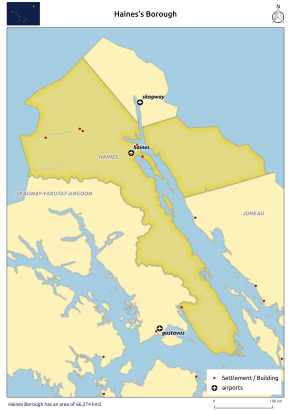
For the remaining items (North arrow, scalebar, and bottom left text), the expression were similar to the ones already mentioned, and, after setting them for each item, I got a layout that would adapt to both page orientation.

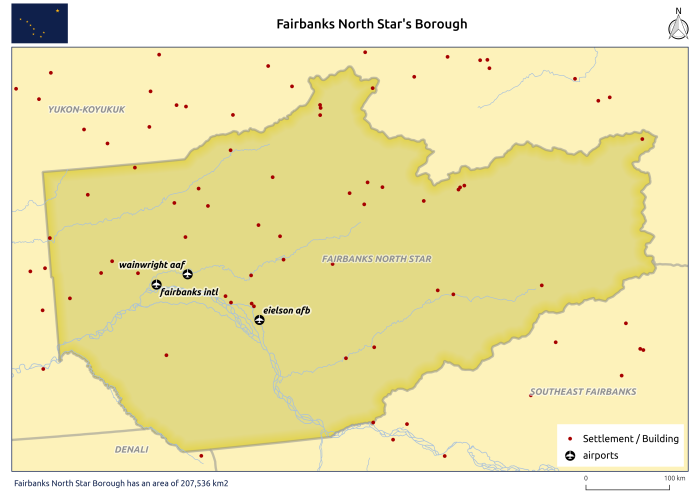
output_9

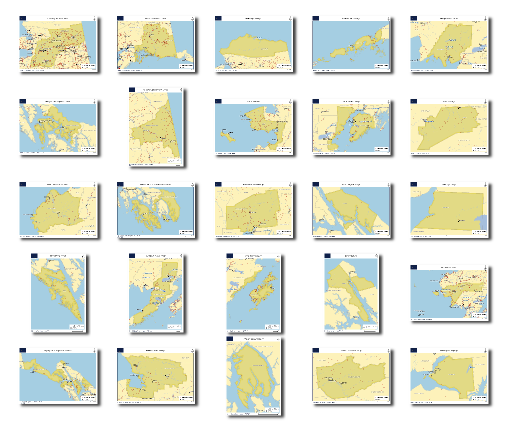
From that point, printing/exporting all (25) maps was one click away.

mosaico_regioes

In the next post of the series, I will try to explain how to create map series where it’s the size of the page that change to keep the scale’s value of the scale constant.

Dissolver polígonos em Postgres\Postgis

Trata-se de um cenário muito recorrente em análise espacial. Tendo uma camada\tabela composta por diversos polígonos, queremos “juntá-los” de acordo com valores distintos de um ou mais atributos (exemplo: de uma camada com os limites de freguesias, queremos obter os concelhos, ou, da COS ao 3º nível, obter o 2º ou o 1º)

Este artigo tem como objectivo mostrar como fazê-lo em Postgres\Postgis.

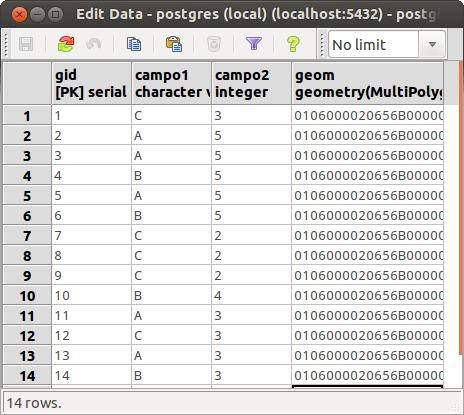
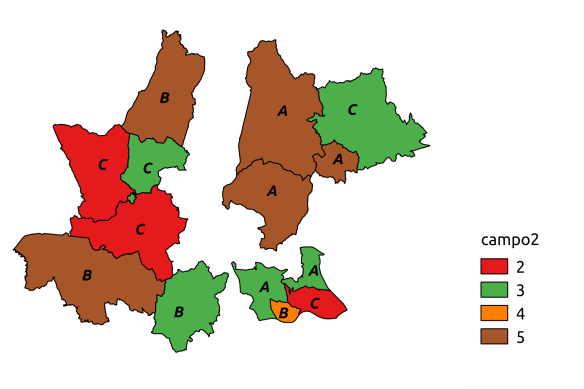
Tabela de exemplo

Como exemplo vou usar uma tabela como o seguinte formato:

CREATE TABLE tabela_1
    (gid serial PRIMARY KEY,
     campo1 character varying(128),
     campo2 integer,
     geom geometry(MultiPolygon,27493);

tabela1_original_tabela

tabela1_original

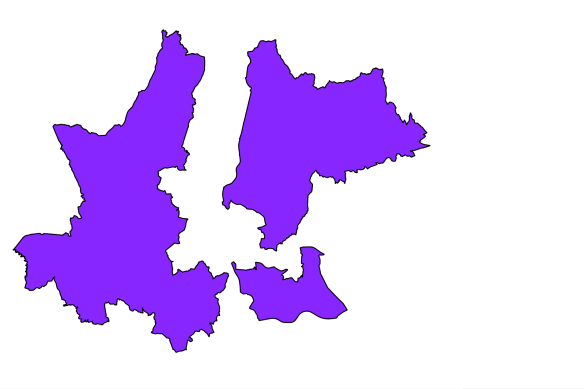
Dissolver todos os polígonos

Em primeiro lugar podemos simplesmente agregar todos os elementos num multi-polígono único. Para tal usamos a função ST_Union().

SELECT
    ST_Union(t.geom) as geom
FROM
    tabela_1 as t;

tabela1_union

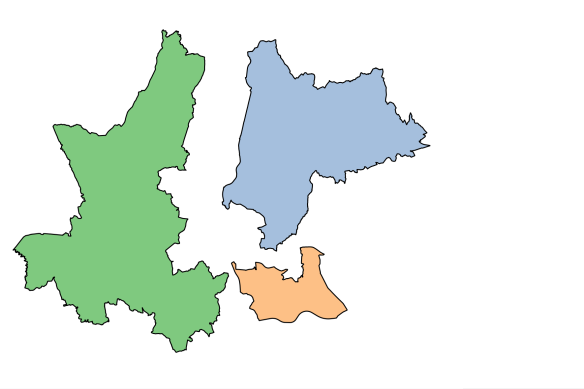
Separar polígonos que não sejam contíguos

Se por outro lado não quisermos que o resultado apresente multi-polígonos usamos a função ST_Dump() recolhendo o campo da geometria.

SELECT
    (ST_Dump(ST_Union(t.geom))).geom as geom
FROM
    tabela_1 as t;

tabela1_union_dump

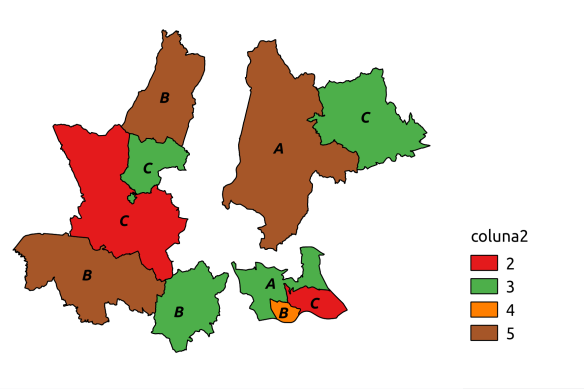
Dissolver polígonos com base em valores dos campos

Se quisermos dissolver os polígonos que tenham valores iguais num ou mais campos, basta incluí-los na cláusula GROUP BY. Se quisermos que esses campos apareçam no resultado (geralmente queremos) há que referi-los no início do SELECT.

SELECT
    campo1,
    campo2,
    (ST_Dump(ST_Union(t.geom))).geom as geom
FROM
    tabela_1 as t
GROUP BY
    campo1,
    campo2;

tabela1_union_by_value

Nota 1: Para quem prefere usar interfaces gráficos, preencher formulários e clicar em botões, o uso de SQL para fazer este tipo de operações pode parecer demasiado complicado e até um pouco retrógrado. Mas uma coisa garanto, com alguma prática as dificuldades iniciais são ultrapassadas e os benefícios que se retiram deste tipo de abordagem são muito recompensadores.

Nota 2: Visualizar o resultado deste tipos consultas de agregação (que usam a cláusula GROUP BY) no QGIS pode ser desafiante, este artigo explica como ultrapassar essa dificuldade.


Instalar duas versões de QGIS em Linux

QGIS24_QGISmaster

Em altura de testes à versão em desenvolvimento do QGIS (versão master), dá jeito  ter também instalada a última versão estável do QGIS. Em windows isso não representa um problema, uma vez que se podem instalar várias versões do QGIS em paralelo (tanto via Osgeo4w como standalone). Em linux, o processo não é tão directo pelo facto da instalação se realizar por obtenção de diversos pacotes disponíveis nos repositórios, não sendo por isso possível instalar mais do que uma versão sem que se originem quebras de dependências. Assim, instalando a versão estável através dos repositórios, as alternativas para instalação da versão em desenvolvimento são:

  • Compilar o QGIS master do código fonte;
  • Instalar o QGIS master num docker;
  • Instalar o QGIS master numa máquina virtual;

Neste artigo vou mostrar como compilar o código fonte em Ubuntu 14.04. Afinal não é tão difícil quanto parece. Meia dúzia de comandos e um pouco de paciência e vai-se lá. Usei como base as indicações do ficheiro INSTALL.TXT disponível no código fonte com umas pequenas alterações.

Instalar todas as dependências necessárias

Num terminal correr o seguinte comando para instalar todas as dependências e ferramentas necessárias à compilação do QGIS. (adicionei o ccmake e o git ao comando original)

sudo apt-get install bison cmake doxygen flex git graphviz grass-dev libexpat1-dev libfcgi-dev libgdal-dev libgeos-dev libgsl0-dev libopenscenegraph-dev libosgearth-dev libpq-dev libproj-dev libqscintilla2-dev libqt4-dev libqt4-opengl-dev libqtwebkit-dev libqwt5-qt4-dev libspatialindex-dev libspatialite-dev libsqlite3-dev lighttpd pkg-config poppler-utils pyqt4-dev-tools python-all python-all-dev python-qt4 python-qt4-dev python-sip python-sip-dev spawn-fcgi txt2tags xauth xfonts-100dpi xfonts-75dpi xfonts-base xfonts-scalable xvfb cmake-curses-gui

Configurar o ccache

Este passo permite optimizar a compilação e tornar a compilação mais rápida nas próximas vezes que se fizer:

cd /usr/local/bin
sudo ln -s /usr/bin/ccache gcc
sudo ln -s /usr/bin/ccache g++

 Obter o código fonte do Github

O código fonte pode ser colocado numa pasta à escolha de cada um. Seguindo a sugestão do ficheiro de instruções acabei por colocar tudo na minha pasta home/alexandre/dev/cpp.

mkdir -p ${HOME}/dev/cpp
cd ${HOME}/dev/cpp

Já dentro da pasta home/alexandre/dev/cpp, podemos obter o código do qgis executando o seguinte comando git:

git clone git://github.com/qgis/QGIS.git

Nota: Se pretendesse fazer alterações ao código e experimentar se funcionava, então deveria fazer o clone do fork do qgis do meu próprio repositório, ou seja:

git clone https://github.com/SrNetoChan/Quantum-GIS

Preparar directorias de compilação e instalação

O código fonte tem de ser compilado e instalado em locais próprios para evitar conflitos com outras versões do QGIS. Por isso, há que criar uma pasta para efectuar a instalação:

mkdir -p ${HOME}/apps

E outra onde será feita a compilação:

cd QGIS
mkdir build-master
cd build-master

Configuração

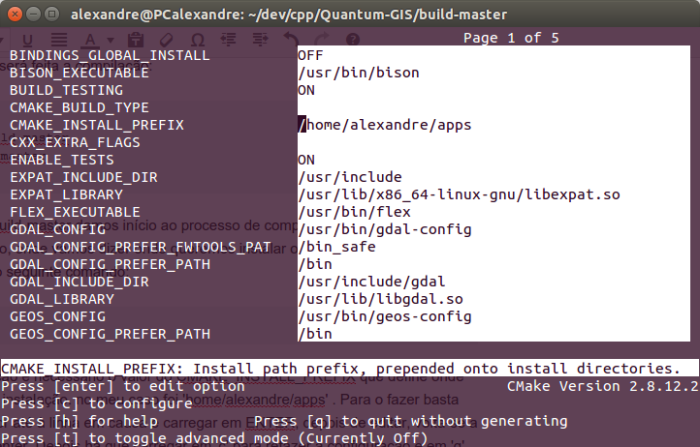
Já na pasta build-master damos início ao processo de compilação. O primeiro passo é a configuração, onde vamos dizer onde queremos instalar o QGIS master. Para isso executamos o seguinte comando (não esquecer os dois pontos):

ccmake ..

Na configuração é necessário alterar o valor do CMAKE_INSTALL_PREFIX que define onde vai ser feita a instalação, no meu caso usei a pasta já criada ‘home/alexandre/apps’ . Para editar o valor há que mover o cursor até à linha em causa e carregar em [enter], depois de editar, volta-se a carregar em [enter]. Depois há que carregar em [c] para refazer a configuração e depois em ‘g’ para gerar a configuração.

Screenshot from 2014-10-08 23:33:39

 Compilação e instalação

Já com tudo configurado resta compilar o código e depois instalá-lo:

make
sudo make install

Nota: Estes dois passos podem demorar um bocadinho, principalmente na primeira vez que o código for compilado.

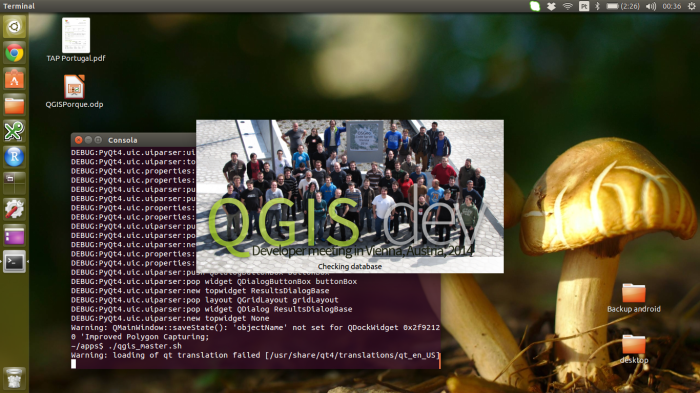
Depois de instalado podemos correr o QGIS master a partir da pasta de instalação:

cd ${HOME}/apps/bin/
export LD_LIBRARY_PATH=/home/alexandre/apps/lib
export QGIS_PREFIX_PATH=/home/alexandre/apps
${HOME}/apps/bin/qgis

Para se tornar mais cómodo, podemos colocar os últimos 3 comandos num ficheiro .sh e gravá-lo num local acessível (desktop ou home) para executarmos o qgis sempre que necessário.

Screenshot from 2014-10-09 00:36:52

UPDATE: Actualizar a versão master

Como já foi referido num comentário, a versão em desenvolvimento está constantemente a ser alterada, por isso para testar se determinados bugs foram entretanto corrigidos há que a actualizar. Trata-se de um processo bastante simples. O primeiro passo é actualizar o código fonte:

cd ${HOME}/dev/cpp/qgis
git pull origin master

E depois é voltar a correr a compilação (que desta feita será mais rápida):

cd build-master
ccmake ..
make
sudo make install

QGIS + Postgis: Consultas de agregação

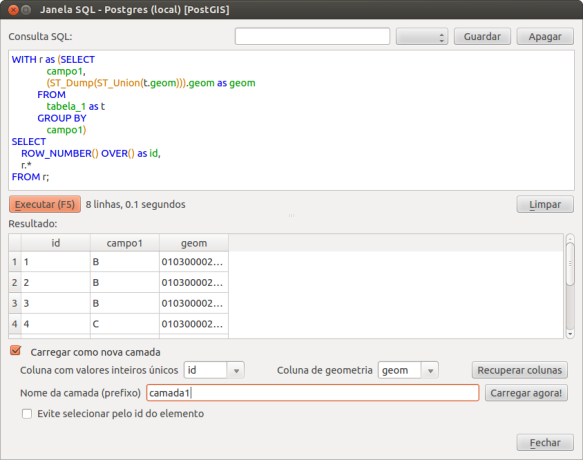
Quando através de uma consulta SQL a uma base de dados postgres\postgis se procede a uma agregação (através do uso da cláusula GROUP BY) é quase certo perder a chave primária da tabela original (geralmente o gid). No entanto, para visualizar o resultado de consultas SQL em QGIS é necessário que exista um campo com valores inteiros distintos para usar como identificadores únicos. Assim, para ultrapassar este contratempo, há que criar uma coluna com essas características.

Essa coluna pode ser feita usando a função ROW_NUMBER(), da seguinte forma:

WITH r as (SELECT
               campo1,
               (ST_Dump(ST_Union(t.geom))).geom as geom
           FROM
               tabela_1 as t
           GROUP BY
               campo1)
SELECT
    ROW_NUMBER() OVER() as id,
    r.*
FROM r;

Copiando toda para a expressão na janela SQL do DB Manager (Base de dados > Gestor BD > Janela SQL), é possível usar o campo id como identificador único.

QGIS_Janela_SQL

AgregacaoSQL_Qgis


Séries de mapas com formatos múltiplos em QGIS 2.6 – Parte 2 | Multiple format map series using QGIS 2.6 – Part 2

No último artigo, tentei mostrar como usei o QGIS 2.6 para criar séries de mapas cuja orientação da folha se adaptasse à forma do elemento do atlas. Esse método é útil quando a escala final dos mapas não é relevante, ou quando os elementos usados no atlas têm uma dimensão muito semelhante, permitindo a adopção de uma escala única. No entanto, quando é necessário manter a mesma escala de impressão dos mapas e os elementos do atlas apresentam diferenças de extensão, é necessário alterar o tamanho da folha. Nesta segunda parte do artigo, tentarei mostrar como cheguei a uma solução para isso.

In my last post, I have tried to show how I used QGIS 2.6 to create a map series where the page’s orientation adapted to the shape of the atlas features. This method is useful when the final scale of the maps is irrelevant, or when the size of the atlas elements is  similar, allowing one to use a fixed scale. On the other hand, when using a fixed scale is mandatory and the features size are too different, it is needed to change the size of the paper. In this second part ot the post, I will try to show how I came to a solution for that.

Como base usei o mapa criado na 1ª parte do artigo, do qual fiz um duplicado. Para exemplificar o método procurei criar uma série de mapas à escala 1:2.000.000. Uma vez que iria adaptar tanto a altura como a largura da folha aos elementos do atlas, não me precisava de preocupar com a orientação da folha em si e por isso comecei por desactivar as propriedades definidas por dados na opção orientação.

As a base, I used the map created in the previous post, from which I did a duplicate. To exemplify the method I tried to create a map series at 1:2.000.000 scale. Since I was going to change both width and height of the paper, I did not need to set an orientation, and therefore I deactivated the data defined properties of the orientation option:

Fiz algumas contas usando a escala, as dimensões do elemento do atlas e as margens definidas anteriormente e e cheguei às seguintes expressões a usar na  largura e altura da folha, respectivamente:

With some maths with the map scale, the size of the atlas feature and the already defined margins, I came up with the following expressions to use, respectively,  in width and height:

((bounds_width( $atlasgeometry ) / 2000000.0) * 1000.0) * 1.1 + 10
((bounds_height( $atlasgeometry ) / 2000000.0) * 1000.0) * 1.1 + 30

Passo a explicar. (bounds_width( $atlasgeometry ) / 2000000.0) é a largura do elemento do atlas representado à escala 1:2.000.000 em unidades do projecto (neste caso metros). Este resultado é multiplicado por 1000 para o converter em milímetros (unidade usada nas definições do compositor). Para que o elemento de atlas não ficasse resvés aos limites do mapa decidi dar 10% de margem em torno do mesmo, o que justifica a multiplicação por 1.1. E por fim adicionei a dimensão das margens do mapa que tinham sido definidas na 1ª parte do artigo (i.e., 20 mm, 5 mm, 10 mm, 5 mm).

Allow me to clarify. (bounds_width( $atlasgeometry ) / 2000000.0) is the atlas feature’s width in meters when represented at 1:2.000.000. This is multiplied by 1000 to convert it to millimeters (the composer’s settings units). In order to keep the atlas feature not to close to the margin, I have decided to add 10% of margin around it, hence the multiplication by 1.1. To finish I add the map margins value,that where already set in the previous post (i.e.,20 mm, 5 mm, 10 mm, 5 mm)
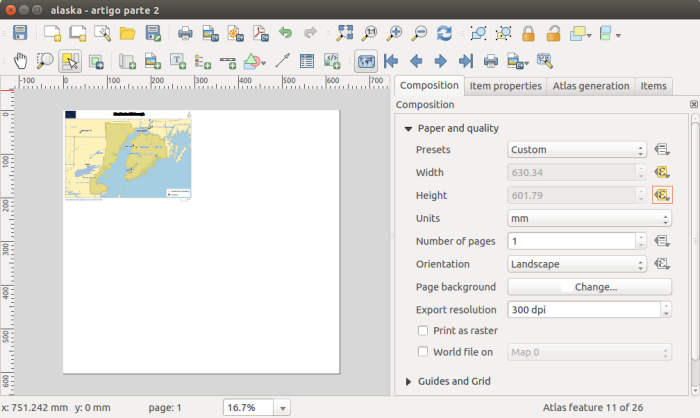
Screenshot from 2014-11-16 22:58:34

Como se pode ver pela imagem anterior, após a introdução das expressões nas opções de largura e altura da folha, a sua dimensão já se alterava em função do tamanho do elemento de atlas. No entanto, como seria de esperar, os itens do mapa mantiveram-se teimosamente na mesma posição. Foi por isso necessário alterar as expressões definidas para a dimensão e posição de cada um deles.

As one can see from the previous image, after setting the expressions in the paper width and height options, it’s size already changed according to the size of the atlas features. But, as expected, all the itens stubbornly kept their positions.For that reason, it has been necessary to change the size and position expressions for each of then.

Começado pelo tamanho do item de mapa, as expressões a usar na altura e largura não foram difíceis de perceber uma vez que seriam as dimensões da folha menos as margens:

Starting by the map item size, the expressions to use in width and height were not difficult to understand since they would be the paper size without the margins size:

((bounds_width( $atlasgeometry ) / 2000000.0) * 1000.0) * 1.1
((bounds_height( $atlasgeometry ) / 2000000.0) * 1000.0) * 1.1

Screenshot from 2014-11-16 23:07:43

Para posicionar correctamente os elementos, bastou substituir nas expressões das opções X e Y os “CASE WHEN … THEN … END” que determinavam o tamanho da largura ou altura da folha, pelas expressões descritas anteriormente. Por exemplo, as expressões usadas para a posição da legenda em X e Y:

To position the items correctly, all was needed was to replace the “CASE WHEN … THEN … END” statement by the expressions defined before. For instance, the expressions used in the X and Y options for the legend position:

(CASE WHEN  bounds_width(  $atlasgeometry ) >=  bounds_height( $atlasgeometry) THEN 297 ELSE 210 END) - 7
(CASE WHEN  bounds_width(  $atlasgeometry ) >=  bounds_height( $atlasgeometry) THEN 210 ELSE 297 END) - 12

Passaram a ser, respectivamente:
Became, respectively:

(((bounds_width( $atlasgeometry ) / 2000000.0) * 1000.0) * 1.1 + 10) - 7
(((bounds_height( $atlasgeometry ) / 2000000.0) * 1000.0) * 1.1 + 30) - 12

Screenshot from 2014-11-16 23:22:40

Alterando as expressões de posicionamento X e Y dos restantes itens do compositor cheguei à estrutura final.

Changing the expressions of the X and Y position options for the remaining composer’s items I have reached the final layout.
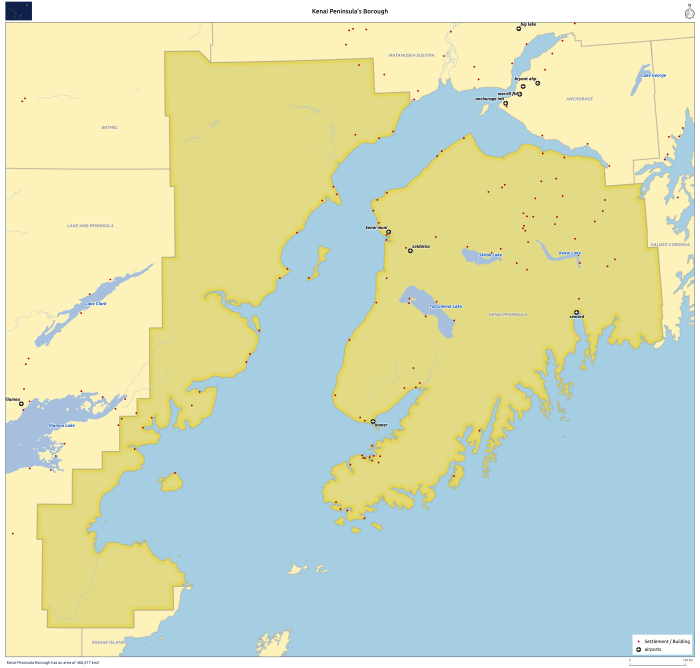
alaska_region_Kenai Peninsula

Depois disso, a impressão/exportação de todos os (25) mapas ficou, mais uma vez, à distância de um só clique.

Once again, printing/exporting all (25) maps was only one click away.

mosaico_regioes_fixed

Uma vez que o QGIS permite exportar imagens do compositor georreferenciadas, adicionando-as ao QGIS obtive este resultado interessante.

Since QGIS allows exporting the composer as georeferenced images, opening all maps in QGIS I got this interesting result.

Screenshot from 2014-11-17 00:02:38

Como se pode ver pelos resultados, através deste método, podemos obter mapas com formatos bastante estranhos. Por essa razão, na 3ª e última parte deste artigo, procurarei mostrar como criar uma série de mapas com escala fixa, mas usando formatos de folhas standard (A4, A3, A2, A1 e A0).

As one can see by the results, using this method, we can get some quite strange formats. That is why in the 3rd and last post of this article, I will try to show how to create a fixed scale map series using standard paper formats (A4, A3, A2, A1 e A0).

Disclaimer: I’m not an English native speaker, therefor I apologize for any errors, and I will thanks any advice on how to improve the text.


  • <<
  • Page 72 of 142 ( 2821 posts )
  • >>

Back to Top

Sustaining Members