Related Plugins and Tags

QGIS Planet

Use o operador “IN” sff | Please use the “IN” operator

EN | PT

It’s not the first time I see people that, to select feature by their fields values, use expressions like this:

"field" = 'value1' OR "field" = 'value2' OR "field" = 'value3' [OR ...]

A more practical and pretty way of doing this is by using the IN operator instead.

"field" IN ('value1','value2','value3'[,...])

This operator is available in almost every GIS software I know. In QGIS, it can be used even if there isn’t a small little button to click.
Captura de tela 2014-04-23 16.50.40

In fact, this is an abbreviation of what is used in SQL, where the operator is used in the WHERE statement:

SELECT *
FROM parks
WHERE "tipo" IN ('PI','CM','PJ');

Mapas de fluxos em QGIS

Hoje surgiu a questão “Como consigo fazer um mapa em que a sobreposição de símbolos aumente a opacidade?“. Fiz o meu melhor para descrever como fazê-lo em QGIS, que transcrevo agora para português.

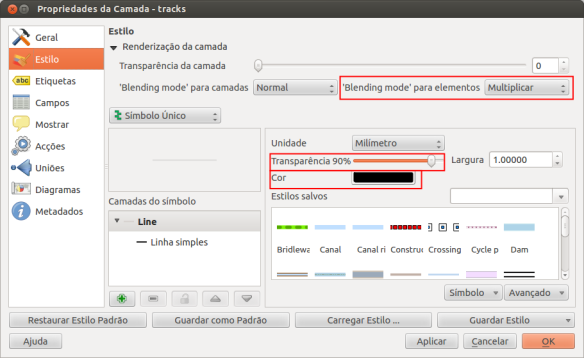
Este tipo de mapas pode ser feito em QGISs usando a uma combinação da transparência e cor dos símbolos e o blending mode dos elementos.

Note-se a diferença entre a transparência e blending mode da camada (que é aplicado a toda a camada) e a transparência do símbolo e blending dos elementos (que acumulam com outros elementos da mesma camada).

Esta opções estão disponíveis em Propriedades da camada > Estilo.

testes_opacidade_opcoes

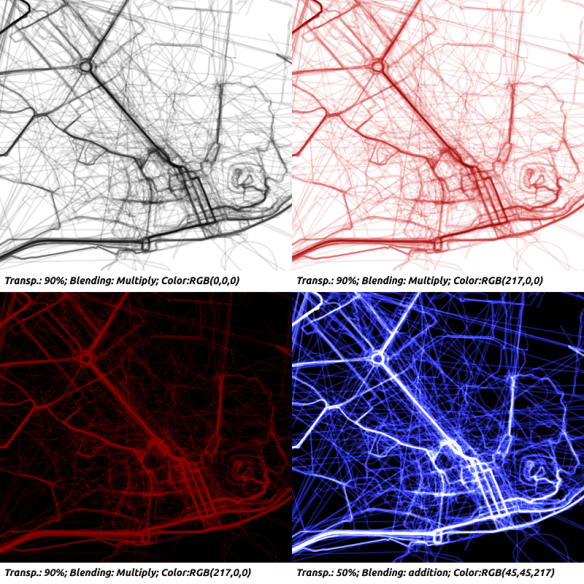
Com um valor de transparência do símbolo de 95%, a cor do elemento tornar-se à totalmente opaca quando pelo menos 20 elementos de sobrepuserem. Este número é limitado à sobreposição de 100 elementos(tranparencia 99%).

Usando diferentes modos de blending (como a multiplicação ou a adição) consegues-se obter outros efeitos.

Testes_com_opacidade_2

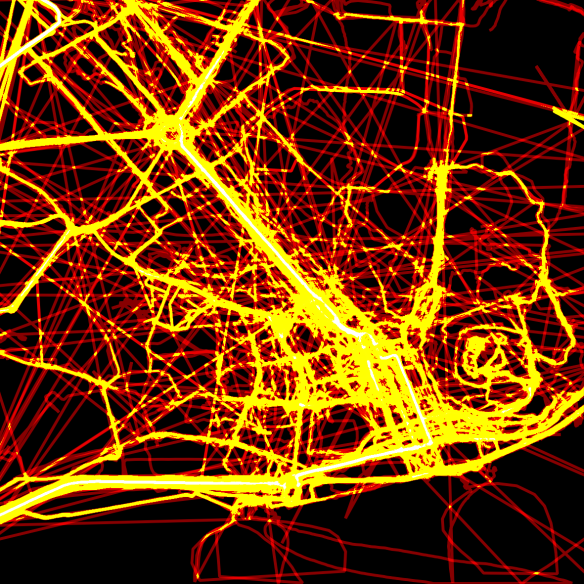
Duplicando a camada, usando diferentes cores (no exemplo abaixo o verde para uma camada e o vermelho para a imediatamente baixo) e usando blending mode dogde,consegue-se obter efeitos ainda mais interessantes.

opacity dodge


QGIS Cloud - Speed up the loading time of the web client

QGIS Cloud is your personal geo-data infrastructure in the internet. Publish maps and data. Share geo-information with others. And all of this very easily, without server, infrastructure and expert knowledge. If you know QGIS Desktop, then you know QGIS cloud just as well. Just install the QGIS cloud plugin from the official QGIS plugin repository and you’re good to go. You can publish as many maps as you want.

But the default settings of QGIS projects you like to publish via QGIS Cloud are not the best with respect to the performance of the QGIS Webclient / WMS. This point is noticeable when the published project contains many layers. Than the default settings are leading to bad performance. The size of the WMS GetCapabilities request is not negligible. Have a look at the first request:

QGIS Cloud slow response

The second request has a much faster response time than the first one:

QGIS Cloud fast response

What’s the difference between this two requests? First of all the slow request has to download and parse 3.1MB of XML data. The fast request has to download and parse 22KB only. However that work’s much faster. What makes the difference? If you have a look at the first request result, you can see, that tons of coordinate reference systems (CRS) are defined for every layer. These are all CRS supported by QGIS. In fact most of them will never be used. As the result the solution is to reduce the number of CRS in the QGIS Cloud WMS and WFS services. To achieve that you have to restrict the CRS in the QGIS project settings. Open the OWS Server tab and activate the CRS restrictions option and add all CRS of interest.

QGIS Cloud Webclient slow initialisation with none restricted CRS

QGIS Cloud Webclient fast initialisation with restricted CRS

QGIS Cloud - Speed up the loading time of the web client

QGIS Cloud is your personal geo-data infrastructure in the internet. Publish maps and data. Share geo-information with others. And all of this very easily, without server, infrastructure and expert knowledge. If you know QGIS Desktop, then you know QGIS cloud just as well. Just install the QGIS cloud plugin from the official QGIS plugin repository and you’re good to go. You can publish as many maps as you want.

But the default settings of QGIS projects you like to publish via QGIS Cloud are not the best with respect to the performance of the QGIS Webclient / WMS. This point is noticeable when the published project contains many layers. Than the default settings are leading to bad performance. The size of the WMS GetCapabilities request is not negligible. Have a look at the first request:

QGIS Cloud slow response

The second request has a much faster response time than the first one:

QGIS Cloud fast response

What’s the difference between this two requests? First of all the slow request has to download and parse 3.1MB of XML data. The fast request has to download and parse 22KB only. However that work’s much faster. What makes the difference? If you have a look at the first request result, you can see, that tons of coordinate reference systems (CRS) are defined for every layer. These are all CRS supported by QGIS. In fact most of them will never be used. As the result the solution is to reduce the number of CRS in the QGIS Cloud WMS and WFS services. To achieve that you have to restrict the CRS in the QGIS project settings. Open the OWS Server tab and activate the CRS restrictions option and add all CRS of interest.

OWS_server

QGIS Cloud Webclient slow initialisation with none restricted CRS

QGIS Cloud Webclient fast initialisation with restricted CRS

Exploring QGIS 2.6 – Item panel for map composer

In recent releases QGIS’ map composer has undergone some large usability improvements, such as the ability to select and interact with multiple items, and much improved navigation of compositions. Another massive usability improvement which is included in QGIS 2.6 is the new “Items” panel in the map composer. The panel shows a list of all items currently in the composition, and allows you to individually select, show or hide items, toggle their lock status, and rearrange them via drag and drop. You can also double click the item’s description to modify its ID, which makes managing items in the composition much easier.

QGIS composer’s new items panel

This change has been on my wish list for a long time. The best bit is that implementing the panel has allowed me to fix some of the composer’s other biggest usability issues. For instance, now locked items are no longer selectable in the main composer view. If you’ve ever tried to create fancy compositions with items which are stacked on top of other items, you’ll know that trying to interact with the lower items has been almost impossible in previous QGIS versions. Now, if you lock the higher stacked items you’ll be able to fully interact with all underlying items without the higher items getting in the way. Alternatively you could just temporarily hide them while you work with the lower items.

This feature brings us one more step closer to making QGIS’ map composer a powerful DTP tool in itself. If you’d like to help support further improvements like this in QGIS, please consider sponsoring my development work, or you can contact me directly for a quote on specific development.

More experiments with Game of Life

As promised in my recent post “Experiments with Conway’s Game of Life”, I have been been looking into how to improve my first implementation. The new version which you can now find on Github is fully contained in one Python script which runs in the QGIS console. Additionally, the repository contains a CSV with the grid definition for a Gosper glider gun and the layer style QML.

Rather than creating a new Shapefile for each iteration like in the first implementation, this script uses memory layers to save the game status.

You can see it all in action in the following video:

(video available in HD)

Thanks a lot to Nathan Woodrow for the support in getting the animation running!

Sometimes there are still hick-ups causing steps to be skipped but overall it is running nicely now. Another approach would be to change the layer attributes rather than creating more and more layers but I like to be able to go through all the resulting layers after they have been computed.


Serving live tiles from a QGIS project via TileStache

I’m more then likly way behind the 8 ball here, aren’t all the cool kids doing tiles these days, but regardless I thought it was pretty cool to share. The other day I found TileStache a neat little Python app that can generate, cache, and serve tiles from a list of providers. The normal way is via Mapnik (and others) to render a image, there is also a vector provider which can render vector tiles. Nifty.

A while ago I wrote qgis2img which can generate an image for project, or layers, and export it for you. It serves two roles, one is to benchmark a project and layer render times, the other as a simple export tool. I thought it would be pretty cool to be able to export tiles from it but was I never really up for working on the math and all the logic so I left it. Then I found TileStache.

The best part about TileStache, apart from that it’s Python, is that you can make your own providers for it, and the API is dead easy

class Provider:
    def __init__(self, layer):
        self.layer = layer

    def renderArea(self, width, height, srs, xmin, ymin, xmax, ymax, zoom):
        pass

How easy is that! Just implement one method and you are good to go. So that’s what I did. I created a custom provider that will load a QGIS project and render out images. Thanks to the work done by Martin from Lutra Consulting for the multithreaded rendering in QGIS 2.4 this is a hell of a lot easier then it used to be.

Ignoring some of the setup code to create and load the session the whole export logic is in these few lines

   extents = QgsRectangle(xmin, ymin, xmax, ymax)
   settings.setExtent(extents)
   settings.setOutputSize(QSize(width, height))
   layers = [layer.id() for layer in project.visiblelayers()]
   image, rendertime = qgis2img.render.render_layers(settings, layers, RenderType=QgsMapRendererSequentialJob)

with render_layers defined as

def render_layers(settings, layers, RenderType):
    settings.setLayers(layers)
    job = RenderType(settings)
    job.start()
    job.waitForFinished()
    image = job.renderedImage()
    return image, job.renderingTime()

As this is build on top of my qgis2img tool you can see the full code here

Running it is as simple as installing TileStache, cloneing qgis2img, updating tilestache.cfg, and running the server.

$ pip install TileStache
$ git clone https://github.com/DMS-Aus/qgis2img.git
$ cd qgis2img

In tilestache.cfg you can just change the path to the project to render:

{
  "cache": {
    "name": "Test",
    "path": "/tmp/stache"
    },
  "layers": {
    "qgis":
    {
      "provider": {"class": "qgis2img.tilestache:Provider",
                   "kwargs": {"projectfile": "data/test.qgs"}
                  }
    }
  }
}

Then run the server

$ tilestache-server /path/to/tilestache.cfg

Note: The path to the .cfg file seems to have to be the full path. I had issues with relative paths working.

To view the tiles you can load the preview URL that TileStache provides or you can use it in something like LeafLet

<!DOCTYPE html>
<html>
<head>
    <title>QGIS Tiles WOOT!</title>
    <meta charset="utf-8" />
    <meta name="viewport" content="width=device-width, initial-scale=1.0">
    <link rel="stylesheet" href="http://cdn.leafletjs.com/leaflet-0.7.3/leaflet.css" />
</head>
<body>
    <div id="map" style="position: absolute; top: 0; right: 0; bottom: 0; left: 0;"></div>
    <script src="http://cdn.leafletjs.com/leaflet-0.7.3/leaflet.js"></script>
    <script>

        var map = L.map('map').setView([51.505, -0.09], 5);

        L.tileLayer('http://10.0.0.11:8080/{id}/{z}/{x}/{y}.png', {
            maxZoom: 18,
            id: 'qgis'
        }).addTo(map);

    </script>
</body>
</html>

And the result is live tiles from a QGIS project.
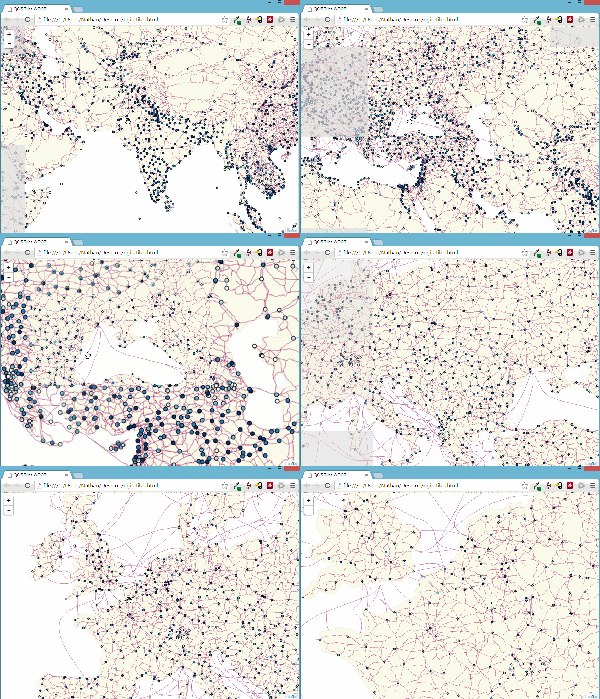
tiles

Winning!

Some Caveats

  • The provider currently doesn’t use metatiles so labels and points will get chopped at tile edge. I have working code for this but haven’t pushed it yet.

  • I don’t kill the QGIS session that I create. Creating a session for each request was really expensive so I just keep it around.

  • I only load the project once so any changes mean starting and stopping the server. Wouldn’t be hard to add a file watcher for this.

  • It’s just me using this at home for fun, I have no idea on how it would scale, or even if it would, but I would be keen to hear feedback on that theory.


Filed under: qgis

Serving live tiles from a QGIS project via TileStache

I'm more then likly way behind the 8 ball here, aren't all the cool kids doing tiles these days, but regardless I thought it was pretty cool to share. The other day I found TileStache a neat little Python app that can generate, cache, and serve tiles from a list of providers. The normal way is via Mapnik (and others) to render a image, there is also a vector provider which can render vector tiles. Nifty.

A while ago I wrote qgis2img which can generate an image for project, or layers, and export it for you. It serves two roles, one is to benchmark a project and layer render times, the other as a simple export tool. I thought it would be pretty cool to be able to export tiles from it but was I never really up for working on the math and all the logic so I left it. Then I found TileStache.

The best part about TileStache, apart from that it's Python, is that you can make your own providers for it, and the API is dead easy

class Provider:
    def __init__(self, layer):
        self.layer = layer

    def renderArea(self, width, height, srs, xmin, ymin, xmax, ymax, zoom):
        pass

How easy is that! Just implement one method and you are good to go. So that's what I did. I created a custom provider that will load a QGIS project and render out images. Thanks to the work done by Martin from Lutra Consulting for the multithreaded rendering in QGIS 2.4 this is a hell of a lot easier then it used to be.

Ignoring some of the setup code to create and load the session the whole export logic is in these few lines

   extents = QgsRectangle(xmin, ymin, xmax, ymax)
   settings.setExtent(extents)
   settings.setOutputSize(QSize(width, height))
   layers = [layer.id() for layer in project.visiblelayers()]
   image, rendertime = qgis2img.render.render_layers(settings, layers, RenderType=QgsMapRendererSequentialJob)

with render_layers defined as

def render_layers(settings, layers, RenderType):
    settings.setLayers(layers)
    job = RenderType(settings)
    job.start()
    job.waitForFinished()
    image = job.renderedImage()
    return image, job.renderingTime()

As this is build on top of my qgis2img tool you can see the full code here

Running it is as simple as installing TileStache, cloneing qgis2img, updating tilestache.cfg, and running the server.

$ pip install TileStache
$ git clone https://github.com/DMS-Aus/qgis2img.git
$ cd qgis2img

In tilestache.cfg you can just change the path to the project to render:

{
  "cache": {
    "name": "Test",
    "path": "/tmp/stache"
    },
  "layers": {
    "qgis":
    {
      "provider": {"class": "qgis2img.tilestache:Provider",
                   "kwargs": {"projectfile": "data/test.qgs"}
                  }
    }
  }
}

Then run the server

$ tilestache-server /path/to/tilestache.cfg

Note: The path to the .cfg file seems to have to be the full path. I had issues with relative paths working.

To view the tiles you can load the preview URL that TileStache provides or you can use it in something like LeafLet

<!DOCTYPE html>
<html>
<head>
    <title>QGIS Tiles WOOT!</title>
    <meta charset="utf-8" />
    <meta name="viewport" content="width=device-width, initial-scale=1.0">
    <link rel="stylesheet" href="http://cdn.leafletjs.com/leaflet-0.7.3/leaflet.css" />
</head>
<body>
    <div id="map" style="position: absolute; top: 0; right: 0; bottom: 0; left: 0;"></div>
    <script src="http://cdn.leafletjs.com/leaflet-0.7.3/leaflet.js"></script>
    <script>

        var map = L.map('map').setView([51.505, -0.09], 5);

        L.tileLayer('http://10.0.0.11:8080/{id}/{z}/{x}/{y}.png', {
            maxZoom: 18,
            id: 'qgis'
        }).addTo(map);

    </script>
</body>
</html>

And the result is live tiles from a QGIS project.

tiles

Winning!

Some Caveats

  • The provider currently doesn't use metatiles so labels and points will get chopped at tile edge. I have working code for this but haven't pushed it yet.

  • I don't kill the QGIS session that I create. Creating a session for each request was really expensive so I just keep it around.

  • I only load the project once so any changes mean starting and stopping the server. Wouldn't be hard to add a file watcher for this.

  • It's just me using this at home for fun, I have no idea on how it would scale, or even if it would, but I would be keen to hear feedback on that theory.

Open source GIS interview for XYHT

20141108_175726_0A few weeks ago, I had the pleasure to give an interview about open source GIS for the American magazine XYHT. We talked about the open source development model and the motivation behind contributing to open source projects. You can read the full interview in the November issue.

XYHT is available as a classic print magazine as well as for free online and focuses on “positioning and measurement” topics:

http://www.xyht.com


QGIS 2.6 ‘Brighton’ released

In the new release of QGIS 2.6.0 a series of new features have been added concerning

  • General: new features and bugfixes,
  • DXF export (improvements),
  • Map Composer (enhancements),
  • Processing (including a new modeler implementation),
  • QGIS Server (improvements),
  • Symbology (including user interface improvements),
  • User Interface with improvements.

A visual changelog is available for more details with lots of screenshots.

Congratulations to all QGIS developers! Looking forward to see the Fedora RPM available…

You can download QGIS 2.6 at http://qgis.org/en/site/forusers/download.html

The post QGIS 2.6 ‘Brighton’ released appeared first on GFOSS Blog | GRASS GIS Courses.

Experiments with Conway’s Game of Life

This experiment is motivated by a discussion I had with Dr. Claus Rinner about introducing students to GIS concepts using Conway’s Game of Life. Conway’s Game of Life is a popular example to demonstrate cellular automata. Based on an input grid of “alive” and “dead” cells, new cell values are computed on each iteration based on four simple rules for the cell and its 8 neighbors:

  1. Any live cell with fewer than two live neighbours dies, as if caused by under-population.
  2. Any live cell with two or three live neighbours lives on to the next generation.
  3. Any live cell with more than three live neighbours dies, as if by overcrowding.
  4. Any dead cell with exactly three live neighbours becomes a live cell, as if by reproduction.

(Source: Wikipedia – Conway’s Game of Life)

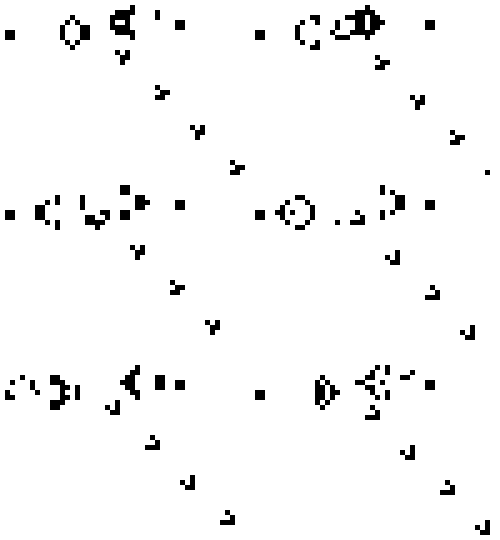
Based on these simple rules, effects like the following “glider gun” can be achieved:

Gospers glider gun.gif
Gospers glider gun” by KieffOwn work. Licensed under CC BY-SA 3.0 via Wikimedia Commons.

There are some Game of Life implementations for GIS out there, e.g. scripts for ArcGIS or a module for SAGA. Both of these examples are raster-based. Since I couldn’t find any examples of raster manipulation like this in pyQGIS, I decided to instead implement a vector version: a Processing script which receives an input grid of cells and outputs the next iteration based on the rules of Game of Life. In the following screencast, you can see the Processing script being called repeatedly by a script from the Python console:

So far, it’s a quick and dirty first implementation. To make it more smooth, I’m considering adding spatial indexing and using memory layers instead of having Processing create a bunch of Shapefiles.

It would also be interesting to see a raster version done in PyQGIS. Please leave a comment if you have any ideas how this could be achieved.


Animated QGIS map canvas item

Have you ever wanted to animate a QGIS map canvas item. No? Well soon you will.

First we need to create a custom QgsMapCanvasItem

from PyQt4.QtCore import QPointF, QRectF, QTimer, QObject, pyqtProperty, QPropertyAnimation, Qt
from PyQt4.QtGui import QPainter, QBrush, QColor
from qgis.gui import QgsMapCanvasItem
from qgis.core import QgsPoint

class PingLocationMarker(QgsMapCanvasItem):
    """
    Position marker for the current location in the viewer.
    """
    class AniObject(QObject):
        def __init__(self):
            super(PingLocationMarker.AniObject, self).__init_<a href="https://woostuff.files.wordpress.com/2014/10/marker.gif"><img src="https://woostuff.files.wordpress.com/2014/10/marker.gif?w=300" alt="marker" width="300" height="193" class="alignnone size-medium wp-image-61493" /></a>_()
            self._size = 0
            self.startsize = 0
            self.maxsize = 32

        @pyqtProperty(int)
        def size(self):
            return self._size

        @size.setter
        def size(self, value):
            self._size = value

    def __init__(self, canvas):
        self.canvas = canvas
        self.map_pos = QgsPoint(0.0, 0.0)
        self.aniobject = PingLocationMarker.AniObject()
        QgsMapCanvasItem.__init__(self, canvas)
        self.anim = QPropertyAnimation(self.aniobject, "size")
        self.anim.setDuration(1000)
        self.anim.setStartValue(self.aniobject.startsize)
        self.anim.setEndValue(self.aniobject.maxsize)
        self.anim.setLoopCount(-1)
        self.anim.valueChanged.connect(self.value_changed)
        self.anim.start()

    @property
    def size(self):
        return self.aniobject.size

    @property
    def halfsize(self):
        return self.aniobject.maxsize / 2.0

    @property
    def maxsize(self):
        return self.aniobject.maxsize

    def value_changed(self, value):
        self.update()

    def paint(self, painter, xxx, xxx2):
        self.setCenter(self.map_pos)

        rect = QRectF(0 - self.halfsize, 0 - self.halfsize, self.size, self.size)
        painter.setRenderHint(QPainter.Antialiasing)
        painter.setBrush(Qt.green)
        painter.setPen(Qt.green)
        painter.drawEllipse(QPointF(0,0), self.size, self.size)

    def boundingRect(self):
        return QRectF(-self.halfsize * 2.0, -self.halfsize * 2.0, 2.0 * self.maxsize, 2.0 * self.maxsize)

    def setCenter(self, map_pos):
        self.map_pos = map_pos
        self.setPos(self.toCanvasCoordinates(self.map_pos))

    def updatePosition(self):
        self.setCenter(self.map_pos)

marker = PingLocationMarker(iface.mapCanvas())

and this is the result

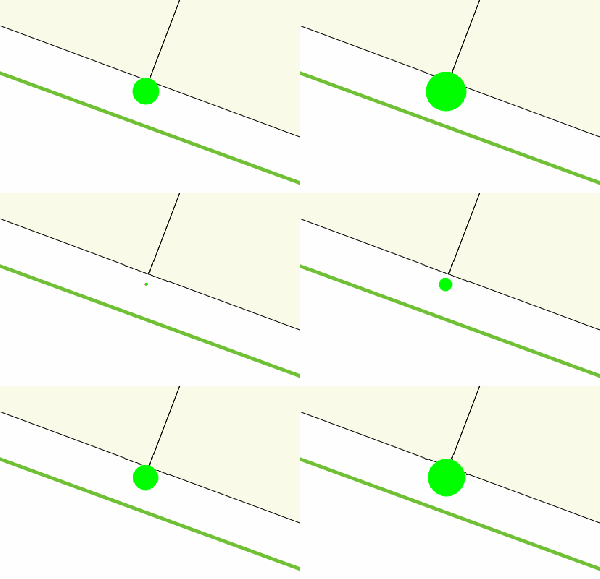
marker

wweeeee animated canvas item.

Run the above code in a QGIS Python console editor window and you should get the same effect.

So what is this magic? Well it turns out to be pretty easy all thanks to the handy class QPropertyAnimation. QPropertyAnimation takes a QObject and sets a property value until the end value is hit over the duration, the cool thing with this class is that it can take any QVariant type, which is pretty much anything, and it will go from start value to end value. You can also use other easing curves to change how the values change over time.

Super nifty!

The main important part of this is:

self.anim = QPropertyAnimation(self.aniobject, "size")
self.anim.setDuration(1000)
self.anim.setStartValue(self.aniobject.startsize)
self.anim.setEndValue(self.aniobject.maxsize)
self.anim.setLoopCount(-1)
self.anim.valueChanged.connect(self.value_changed)
self.anim.start()

which calls the value_changed and self.update() methods, when update is called paint will be called and we grab the current animation value. Note: -1 loop count means run forever.

self.aniobject is a custom QObject to hold our current animation value. QgsMapCanvasItem is not a QObject so we have to make another object to hold that value for us. I tried double inheritance here and it didn’t like it so I went with a nested class which is nice anyway.

And that is all you need to make a animated QgsMapCanvasItem, remember that QPropertyAnimation can be used on any QObject so you could do some pretty cool stuff with this if you have the need.

Be interested to hear any ideas on if we can use this in QGIS.

Note: A canvas item like this isn’t part of any layer. Canvas items live on on the canvas itself, above or below the map image. The markers that you see when you enable editing on a layer are canvas items, as are the lines when drawing a measure line, even the image you see in the canvas is a canvas item, etc.


Filed under: Open Source

Animated QGIS map canvas item

Have you ever wanted to animate a QGIS map canvas item. No? Well soon you will.

First we need to create a custom QgsMapCanvasItem

from PyQt4.QtCore import QPointF, QRectF, QTimer, QObject, pyqtProperty, QPropertyAnimation, Qt
from PyQt4.QtGui import QPainter, QBrush, QColor
from qgis.gui import QgsMapCanvasItem
from qgis.core import QgsPoint

class PingLocationMarker(QgsMapCanvasItem):
    """
    Position marker for the current location in the viewer.
    """
    class AniObject(QObject):
        def __init__(self):
            super(PingLocationMarker.AniObject, self).__init__()
            self._size = 0
            self.startsize = 0
            self.maxsize = 32

        @pyqtProperty(int)
        def size(self):
            return self._size

        @size.setter
        def size(self, value):
            self._size = value

    def __init__(self, canvas):
        self.canvas = canvas
        self.map_pos = QgsPoint(0.0, 0.0)
        self.aniobject = PingLocationMarker.AniObject()
        QgsMapCanvasItem.__init__(self, canvas)
        self.anim = QPropertyAnimation(self.aniobject, "size")
        self.anim.setDuration(1000)
        self.anim.setStartValue(self.aniobject.startsize)
        self.anim.setEndValue(self.aniobject.maxsize)
        self.anim.setLoopCount(-1)
        self.anim.valueChanged.connect(self.value_changed)
        self.anim.start()

    @property
    def size(self):
        return self.aniobject.size

    @property
    def halfsize(self):
        return self.aniobject.maxsize / 2.0

    @property
    def maxsize(self):
        return self.aniobject.maxsize

    def value_changed(self, value):
        self.update()

    def paint(self, painter, xxx, xxx2):
        self.setCenter(self.map_pos)

        rect = QRectF(0 - self.halfsize, 0 - self.halfsize, self.size, self.size)
        painter.setRenderHint(QPainter.Antialiasing)
        painter.setBrush(Qt.green)
        painter.setPen(Qt.green)
        painter.drawEllipse(QPointF(0,0), self.size, self.size)

    def boundingRect(self):
        return QRectF(-self.halfsize * 2.0, -self.halfsize * 2.0, 2.0 * self.maxsize, 2.0 * self.maxsize)

    def setCenter(self, map_pos):
        self.map_pos = map_pos
        self.setPos(self.toCanvasCoordinates(self.map_pos))

    def updatePosition(self):
        self.setCenter(self.map_pos)

marker = PingLocationMarker(iface.mapCanvas())

and this is the result

marker

wweeeee animated canvas item.

Run the above code in a QGIS Python console editor window and you should get the same effect.

So what is this magic? Well it turns out to be pretty easy all thanks to the handy class QPropertyAnimation. QPropertyAnimation takes a QObject and sets a property value until the end value is hit over the duration, the cool thing with this class is that it can take any QVariant type, which is pretty much anything, and it will go from start value to end value. You can also use other easing curves to change how the values change over time.

Super nifty!

The main important part of this is:

self.anim = QPropertyAnimation(self.aniobject, "size")
self.anim.setDuration(1000)
self.anim.setStartValue(self.aniobject.startsize)
self.anim.setEndValue(self.aniobject.maxsize)
self.anim.setLoopCount(-1)
self.anim.valueChanged.connect(self.value_changed)
self.anim.start()

which calls the value_changed and self.update() methods, when update is called paint will be called and we grab the current animation value. Note: -1 loop count means run forever.

self.aniobject is a custom QObject to hold our current animation value. QgsMapCanvasItem is not a QObject so we have to make another object to hold that value for us. I tried double inheritance here and it didn't like it so I went with a nested class which is nice anyway.

And that is all you need to make a animated QgsMapCanvasItem, remember that QPropertyAnimation can be used on any QObject so you could do some pretty cool stuff with this if you have the need.

Be interested to hear any ideas on if we can use this in QGIS.

Note: A canvas item like this isn't part of any layer. Canvas items live on on the canvas itself, above or below the map image. The markers that you see when you enable editing on a layer are canvas items, as are the lines when drawing a measure line, even the image you see in the canvas is a canvas item, etc.

Visualize flows with FlowMapper

This article explains the presentation of flows on a map, using the FlowMapper plugin. For this demonstration, data on commuting patterns between 40 regions are used (from Statistics Netherlands). Preparing the data After the plugin is installed in the usual way, the manual can be found in the folder C:\Users\{username}\.qgis2\python\plugins\FlowMapper2_documentation.Three text files are required, with node … Continue reading Visualize flows with FlowMapper

Thank you from Stacey and I.

Though the kindness of everyone we made it to over $2000 to donate two, not one like we had planned at the start, camera packs to hospitals that need them. One will be going to the new Gold Coast hospital where Ellie was born and the other to another hospital who needs it. Both cameras will have Ellie’s name on them in her memory. They will go a long way to help preserve the memories of those last minutes just like it did for us with Ellie.

The money is now with Heartfelt and hopefully the cameras will be done soon. I will update this post with photos once they are done.

It was really amazing to see the number of people who I have never meet in person from all over the internet throwing in what they could to help us reach the goal. We are extremely grateful for everything everyone put in.

A massive thanks to everyone who donated:

  • Lyn Noble
  • Kylie and Nathan
  • Luke Bassett
  • Joanne Smith
  • Darryl & Angela Browning
  • Digital Mapping Solutions
  • David Baxter
  • Carl Wezel
  • Grandad and Grandma Woodrow
  • Bill Williamson
  • Helen Gillman
  • Karlie Jones
  • Lisa Gill
  • Andrew & Peta
  • Sally Drews
  • Matt Travis
  • Mummy, Daddy, Harry & Little Sis..
  • Terry Stigers
  • James McKeown
  • Jill Pask
  • Kym Zevenbergen
  • Jessica Nayler
  • Amelia Woodrow
  • Judy Burt
  • Russell and Suzann Woodrow
  • Jenny & Mark Gill
  • Emeley Sands
  • Rebecca Penny
  • Larissa Collins
  • Ross McDonald
  • Shantelle Sweedman
  • Rebbecca Ben izzy Erica
  • Aidan Woodrow & Andrew Smith
  • simbamangu
  • Sarah Rayner
  • Sassá
  • Matt Travis
  • Marco Giana
  • Heikki Vesanto
  • Jorge Sanz
  • Pure K.
  • Toby Bellwood
  • Andy Tice
  • Ujaval Gandhi
  • Matt Robinson
  • Geraldine Hollyman
  • Anonymous
  • Teresa Baldwin
  • Alexandre Neto
  • Chelsea Fell
  • Stephane Bullier
  • Nathan Saylor
  • Adrien ANDRÉ
  • Steven Feldman
  • Anita Graser
  • Chris Scott
  • Vicky Gallardo
  • Anonymous
  • Anonymous
  • Stevie Little

I will also add a massive thank you to DMS who has been super supportive though this whole year since Elly died, and they know very well the effect it has had on Stace and I over the past year.

In a perfect world we would never had to run a fund raiser for this but I’m glad Heartfelt exist to help those of us in need at the time.

Thank you from Stacey and I.


Filed under: Open Source

Thank you from Stacey and I.

Though the kindness of everyone we made it to over $2000 to donate two, not one like we had planned at the start, camera packs to hospitals that need them. One will be going to the new Gold Coast hospital where Ellie was born and the other to another hospital who needs it. Both cameras will have Ellie’s name on them in her memory. They will go a long way to help preserve the memories of those last minutes just like it did for us with Ellie.

The money is now with Heartfelt and hopefully the cameras will be done soon. I will update this post with photos once they are done.

It was really amazing to see the number of people who I have never meet in person from all over the internet throwing in what they could to help us reach the goal. We are extremely grateful for everything everyone put in.

A massive thanks to everyone who donated:

  • Lyn Noble
  • Kylie and Nathan
  • Luke Bassett
  • Joanne Smith
  • Darryl & Angela Browning
  • Digital Mapping Solutions
  • David Baxter
  • Carl Wezel
  • Grandad and Grandma Woodrow
  • Bill Williamson
  • Helen Gillman
  • Karlie Jones
  • Lisa Gill
  • Andrew & Peta
  • Sally Drews
  • Matt Travis
  • Mummy, Daddy, Harry & Little Sis..
  • Terry Stigers
  • James McKeown
  • Jill Pask
  • Kym Zevenbergen
  • Jessica Nayler
  • Amelia Woodrow
  • Judy Burt
  • Russell and Suzann Woodrow
  • Jenny & Mark Gill
  • Emeley Sands
  • Rebecca Penny
  • Larissa Collins
  • Ross McDonald
  • Shantelle Sweedman
  • Rebbecca Ben izzy Erica
  • Aidan Woodrow & Andrew Smith
  • simbamangu
  • Sarah Rayner
  • Sassá
  • Matt Travis
  • Marco Giana
  • Heikki Vesanto
  • Jorge Sanz
  • Pure K.
  • Toby Bellwood
  • Andy Tice
  • Ujaval Gandhi
  • Matt Robinson
  • Geraldine Hollyman
  • Anonymous
  • Teresa Baldwin
  • Alexandre Neto
  • Chelsea Fell
  • Stephane Bullier
  • Nathan Saylor
  • Adrien ANDRÉ
  • Steven Feldman
  • Anita Graser
  • Chris Scott
  • Vicky Gallardo
  • Anonymous
  • Anonymous
  • Stevie Little

I will also add a massive thank you to DMS who has been super supportive though this whole year since Elly died, and they know very well the effect it has had on Stace and I over the past year.

In a perfect world we would never had to run a fund raiser for this but I’m glad Heartfelt exist to help those of us in need at the time.

Thank you from Stacey and I.


Filed under: Open Source

  • <<
  • Page 73 of 142 ( 2821 posts )
  • >>

Back to Top

Sustaining Members