Related Plugins and Tags

QGIS Planet

Thank you from Stacey and I.

Though the kindness of everyone we made it to over $2000 to donate two, not one like we had planned at the start, camera packs to hospitals that need them. One will be going to the new Gold Coast hospital where Ellie was born and the other to another hospital who needs it. Both cameras will have Ellie's name on them in her memory. They will go a long way to help preserve the memories of those last minutes just like it did for us with Ellie.

The money is now with Heartfelt and hopefully the cameras will be done soon. I will update this post with photos once they are done.

It was really amazing to see the number of people who I have never meet in person from all over the internet throwing in what they could to help us reach the goal. We are extremely grateful for everything everyone put in.

A massive thanks to everyone who donated:

  • Lyn Noble
  • Kylie and Nathan
  • Luke Bassett
  • Joanne Smith
  • Darryl & Angela Browning
  • Digital Mapping Solutions
  • David Baxter
  • Carl Wezel
  • Grandad and Grandma Woodrow
  • Bill Williamson
  • Helen Gillman
  • Karlie Jones
  • Lisa Gill
  • Andrew & Peta
  • Sally Drews
  • Matt Travis
  • Mummy, Daddy, Harry & Little Sis..
  • Terry Stigers
  • James McKeown
  • Jill Pask
  • Kym Zevenbergen
  • Jessica Nayler
  • Amelia Woodrow
  • Judy Burt
  • Russell and Suzann Woodrow
  • Jenny & Mark Gill
  • Emeley Sands
  • Rebecca Penny
  • Larissa Collins
  • Ross McDonald
  • Shantelle Sweedman
  • Rebbecca Ben izzy Erica
  • Aidan Woodrow & Andrew Smith
  • simbamangu
  • Sarah Rayner
  • Sassá
  • Matt Travis
  • Marco Giana
  • Heikki Vesanto
  • Jorge Sanz
  • Pure K.
  • Toby Bellwood
  • Andy Tice
  • Ujaval Gandhi
  • Matt Robinson
  • Geraldine Hollyman
  • Anonymous
  • Teresa Baldwin
  • Alexandre Neto
  • Chelsea Fell
  • Stephane Bullier
  • Nathan Saylor
  • Adrien ANDRÉ
  • Steven Feldman
  • Anita Graser
  • Chris Scott
  • Vicky Gallardo
  • Anonymous
  • Anonymous
  • Stevie Little

I will also add a massive thank you to DMS who has been super supportive though this whole year since Elly died, and they know very well the effect it has had on Stace and I over the past year.

In a perfect world we would never had to run a fund raiser for this but I'm glad Heartfelt exist to help those of us in need at the time.

Thank you from Stacey and I.

Thank you from Stacey and I.

Though the kindness of everyone we made it to over $2000 to donate two, not one like we had planned at the start, camera packs to hospitals that need them. One will be going to the new Gold Coast hospital where Ellie was born and the other to another hospital who needs it. Both cameras will have Ellie's name on them in her memory. They will go a long way to help preserve the memories of those last minutes just like it did for us with Ellie.

The money is now with Heartfelt and hopefully the cameras will be done soon. I will update this post with photos once they are done.

It was really amazing to see the number of people who I have never meet in person from all over the internet throwing in what they could to help us reach the goal. We are extremely grateful for everything everyone put in.

A massive thanks to everyone who donated:

  • Lyn Noble
  • Kylie and Nathan
  • Luke Bassett
  • Joanne Smith
  • Darryl & Angela Browning
  • Digital Mapping Solutions
  • David Baxter
  • Carl Wezel
  • Grandad and Grandma Woodrow
  • Bill Williamson
  • Helen Gillman
  • Karlie Jones
  • Lisa Gill
  • Andrew & Peta
  • Sally Drews
  • Matt Travis
  • Mummy, Daddy, Harry & Little Sis..
  • Terry Stigers
  • James McKeown
  • Jill Pask
  • Kym Zevenbergen
  • Jessica Nayler
  • Amelia Woodrow
  • Judy Burt
  • Russell and Suzann Woodrow
  • Jenny & Mark Gill
  • Emeley Sands
  • Rebecca Penny
  • Larissa Collins
  • Ross McDonald
  • Shantelle Sweedman
  • Rebbecca Ben izzy Erica
  • Aidan Woodrow & Andrew Smith
  • simbamangu
  • Sarah Rayner
  • Sassá
  • Matt Travis
  • Marco Giana
  • Heikki Vesanto
  • Jorge Sanz
  • Pure K.
  • Toby Bellwood
  • Andy Tice
  • Ujaval Gandhi
  • Matt Robinson
  • Geraldine Hollyman
  • Anonymous
  • Teresa Baldwin
  • Alexandre Neto
  • Chelsea Fell
  • Stephane Bullier
  • Nathan Saylor
  • Adrien ANDRÉ
  • Steven Feldman
  • Anita Graser
  • Chris Scott
  • Vicky Gallardo
  • Anonymous
  • Anonymous
  • Stevie Little

I will also add a massive thank you to DMS who has been super supportive though this whole year since Elly died, and they know very well the effect it has had on Stace and I over the past year.

In a perfect world we would never had to run a fund raiser for this but I'm glad Heartfelt exist to help those of us in need at the time.

Thank you from Stacey and I.

QGIS UK Edinburgh – Photos

QGIS UK user group Edinburgh QGIS UK user group Edinburgh QGIS UK user group Edinburgh QGIS UK user group Edinburgh QGIS UK user group Edinburgh QGIS UK user group Edinburgh QGIS UK user group Edinburgh QGIS UK user group Edinburgh QGIS UK user group Edinburgh QGIS UK user group Edinburgh QGIS UK user group Edinburgh QGIS UK user group Edinburgh

South-East User group meeting:

2nd South-East QGIS user group – 4th November

The Venue: Royal Borough of Windsor and Maidenhead, Town Hall, St. Ives Road, Maidenhead. SL6 1RF.

Tickets: You can grab them from here and they are FREE!

Agenda

9.30-10:  Arrive
10.00: Welcome
10.15 – 12:  Lutra Consultancy – Python Plugin Development *
12 – 12.30: Discussion / Its your floor: This part of the agenda is entirely driven by you. It’s your chance to stand up and let everyone know what you are doing with QGIS or ask a burning question about QGIS? The best question or lightening talk will win a prize! If your lightening talk requires a bit of power-point, then put together no more than a 5 slider presentation and send them over to [email protected]

12.30 – 1.30: Lunch / Networking: There is a cafe within the Town Hall, or a plethora of eating establishments in Maidenhead.
1.30 – 3.00: Talks

Tim Martin from the OS on Terrain5, Topo and building heights to create a 3d using the QGIS2ThreeJs plugin. *
Simon Miles from the RBWM doing a bit of show and tell on how QGIS is used and configured at the Council.

3.00 – 5.00: Unconference: This part of the day is over to you, its your user group! Bring along your own laptop, project or piece of code; or borrow one of the laptops dotted around the room and do a bit of show and tell, or ask someone a burning practical QGIS question. Some of the machines will have QGIS Master on them and there will be a Windows tablet running QGIS on to have a play with. Some suggested topics – Styling features, Creating forms, WMS resources, Print Composer

* Bring along your own laptop if you would like to follow along with the Plugin workshop in morning or with Tim Martin in the afternoon. Software and data requirements will be forwarded to you prior to the day.


PyQGIS Resources

Here is a short list of resources available when writing Python code in QGIS. If you know of others, please leave a comment.

Blogs/Websites

In alphabetical order:

Documentation

Example Code

  • Existing plugins can be a great learning tool
  • Code Snippets in the PyQGIS Cookbook

Plugins/Tools

  • Script Runner: Run scripts to automate QGIS tasks
  • Plugin Builder: Create a starter plugin that you can customize to complete your own plugin
  • pb_tool: Tool to compile and deploy your plugins

Books

Getting Started Writing QGIS Python Plugins

This blog post is a QGIS plugin tutorial for beginners. It was written to support a workshop we ran for the Scottish QGIS user group here in the UK and aims to be a simple step-by-step guide.

In this tutorial you will develop your first QGIS plugin - a Map Tool for selecting the closest feature within multiple loaded vector layers. Knowledge of Python is recommended but not required.

The Goal

Before we get started let’s look at where we’re going.

We will develop a plugin that implements a new QGIS Map Tool. The Identify Features QGIS Identify Tool and Pan Map QGIS Pan Tool tools are both examples of QGIS Map Tools. A Map Tool is a tool which performs an action when used with the map canvas.

We will create a new Select Nearest Feature Map Tool Nearest Feature Tool which will sit in the plugins toolbar.

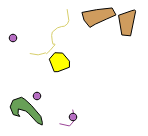
Our Select Nearest Feature Map Tool will allow the user to select the feature nearest a mouse click on the canvas. For example, clicking here:
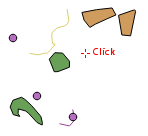
Example Canvas Click

would select the following polygon:

Example Polygon Selection

The Starting Point

Before getting started:

The QGIS Plugin Builder plugin was used to create a base plugin which we’ll modify to fit our requirements.

This base plugin can be found in the zip file mentioned above under code/01__Empty Plugin/NearestFeature

code/01__Empty Plugin contains a batch file install.bat that can be used to copy the plugin into your QGIS plugins folder, making it available to QGIS.

Let’s now load and run this simple base plugin in QGIS.

  • Run install.bat
  • Restart QGIS if already open
  • Open the Plugin Manager: Plugins > Manage and Install Plugins
  • Enable the Nearest Feature plugin

A new action Nearest Feature Tool should now be visible in the plugins toolbar which opens the following dialog:
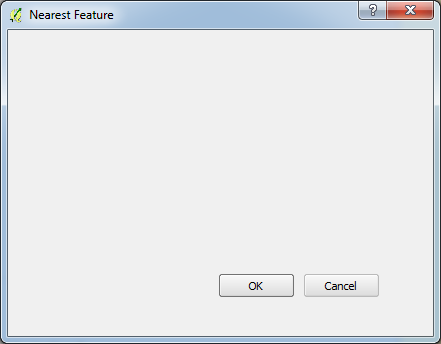
Empty Dialog

Creating a Basic Map Tool

When activated, our plugin currently shows a simple dialog (functionality provided by the Plugin Builder plugin. We’re going to adapt it to instead activate a Map Tool.

A basic Map Tool is included within the zip file mentioned above. It can be found in nearest_feature_map_tool.py in the Additional Files folder.

  • Copy nearest_feature_map_tool.py into the NearestFeature folder and open it in an editor.
  • Note that many of the code segments (highlighted in gray) below link to relevant parts of the API docs. Those links will open in a dedicated browser tab.

nearest_feature_tool.py defines a new NearestFeatureMapTool class (line 28) which inherits (is based on) QgsMapTool, the QGIS Map Tool class. Its __init__() method expects to be passed a reference to a QgsMapCanvas. This canvas reference is passed to the constructor of the underlying QgsMapTool class on line 32 and then stored on line 33 for later use. The QGIS API documentation describes the functionality made available by QgsMapTool.

On line 34 we define a simple, different-looking cursor (a QCursor based on Qt.CrossCursor) later used to indicate that the Map Tool is active.

Our class definition features a method called activate(). Notice the API documentation for QgsMapTool already defines a method with the same name. Any methods defined as virtual methods in the API documentation can be overwritten or redefined as they have been within this file. Here we have overwritten the default implementation of activate().

The activate() method is called when the tool is activated. The new cursor based on Qt.CrossCursor defined above is set with a call to QgsMapCanvas.setCursor().

For the moment, when activated, our Map Tool would simply change the cursor style - that’s all.

Great - next we’ll get our plugin to use the new Map Tool.

Connecting the Basic Map Tool

In this section we will modify the plugin to make use of our new Map Tool.

  • Open nearest_feature.py in a text editor.

We need to first import the NearestFeatureMapTool class before we can use it.

  • Add the following code towards the top of the file just before os.path is imported:
from nearest_feature_map_tool import NearestFeatureMapTool

Next we will create a new instance of the NearestFeatureMapTool class and store a reference to it in self.nearestFeatureMapTool.

  • Add the following code to the initGui() method just before the call to self.add_action() taking care to ensure the indentation is correct:
# Create a new NearestFeatureMapTool and keep reference
self.nearestFeatureMapTool = NearestFeatureMapTool(self.iface.mapCanvas())

Notice that a reference to the map canvas has been passed when creating the new NearestFeatureMapTool instance.

The run() method is called when our plugin is called by the user. It’s currently used to show the dialog we saw previously. Let’s overwrite its current implementation with the following:

# Simply activate our tool
self.iface.mapCanvas().setMapTool(self.nearestFeatureMapTool)

The QGIS map canvas (QgsMapCanvas class) provides the setMapTool() method for setting map tools. This method takes a reference to the new map tool, in this case a reference to a NearestFeatureMapTool.

To ensure that we leave things in a clean state when the plugin is unloaded (or reloaded) we should also ensure the Map Tool is unset when the plugin’s unload() method is called.

  • Add the following code to the end of the unload() method:
# Unset the map tool in case it's set
self.iface.mapCanvas().unsetMapTool(self.nearestFeatureMapTool)

Now let’s see the new map tool in action.

  • Save your files
  • Run install.bat to copy the updated files to the QGIS plugin folder
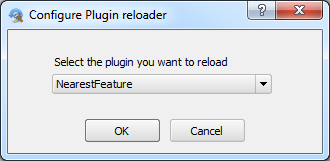
  • Configure the Plugin Reloader plugin to reload the NearestFeature plugin using its configure button, Configure Plugin Reloader Tool

Configure Plugin Reloader Dialog

  • Reload the Nearest Feature plugin using the Reload Plugin Tool button.
  • Click the Nearest Feature Tool button

When passing the mouse over the map canvas the cursor should now be shown as a simple cursor resembling a plus sign. Congratulations - the Map Tool is being activated.

Map Tool State

When you use the Identify Features Map Tool you’ll notice that its button remains depressed when the tool is in use. The button for our map tool does not yet act in this way. Let’s fix that.

The action (QAction) associated with our plugin is defined in the initGui() method with a call to self.add_action().

self.add_action() actually returns a reference to the new action that’s been added. We’ll make use of this behaviour to make the action / button associated with our Map Tool toggleable (checkable).

  • Modify the call to add_action() as follows:
action = self.add_action(
            icon_path,
            text=self.tr(u'Select nearest feature.'),
            callback=self.run,
            parent=self.iface.mainWindow())

action.setCheckable(True)

We now use the reference to the new action to make it checkable.

The QgsMapTool class has a setAction() method which can be used to associate a QAction with the Map Tool. This allows the Map Tool to handle making the associated button look pressed.

  • Add the following line to the end of initGui():
self.nearestFeatureMapTool.setAction(action)
  • Save your files and run install.bat
  • Reload the Nearest Feature plugin using the Reload Plugin button
  • Click the Nearest Feature Tool button

The button should now remain pressed, indicating that the tool is in use.

  • Activate the Identify Features Identify Features Tool tool

The Nearest Feature button should now appear unpressed.

Handling Mouse Clicks

The QgsMapTool class has a number of methods for handling user events such as mouse clicks and movement. We will override the canvasReleaseEvent() method to implement the search for the closest feature. canvasReleaseEvent() is called whenever the user clicks on the map canvas and is passed a QMouseEvent as an argument.

We will now write some functionality which:

  1. Loops through all visible vector layers and for each:
    • Deselects all features
    • Loops through all features and for each:
      • Determines their distance from the mouse click
      • Keeps track of the closest feature and its distance
  2. Determines the closest feature from all layers
  3. Selects that feature


  • Add the following method to the NearestFeatureMapTool class:
def canvasReleaseEvent(self, mouseEvent):
    """
    Each time the mouse is clicked on the map canvas, perform
    the following tasks:
        Loop through all visible vector layers and for each:
            Ensure no features are selected
            Determine the distance of the closes feature in the layer to the mouse click
            Keep track of the layer id and id of the closest feature
        Select the id of the closes feature
    """

    layerData = []

    for layer in self.canvas.layers():

        if layer.type() != QgsMapLayer.VectorLayer:
            # Ignore this layer as it's not a vector
            continue

        if layer.featureCount() == 0:
            # There are no features - skip
            continue

        layer.removeSelection()

The layers() method of QgsMapCanvas (stored earlier in self.canvas) returns a list of QgsMapLayer. These are references to all visible layers and could represent vector layers, raster layers or even plugin layers.

We use the type() and featureCount() methods to skip non-vector layers and empty vector layers.

Finally we use the layer’s removeSelection() method to clear any existing selection. layerData is a list that we’ll use in a moment.

Our plugin now clears the selection in all visible vector layers.

  • Open the Shapefiles included in the Data folder.
  • Make a selection of one or more layers.
  • Reload the plugin and ensure it is working as expected (removing any selection).

Accessing Features and Geometry

We now need access to each feature and its geometry to determine its distance from the mouse click.

  • Add the following code to canvasReleaseEvent() within the loop over layers:
# Determine the location of the click in real-world coords
layerPoint = self.toLayerCoordinates( layer, mouseEvent.pos() )

shortestDistance = float("inf")
closestFeatureId = -1

# Loop through all features in the layer
for f in layer.getFeatures():
    dist = f.geometry().distance( QgsGeometry.fromPoint( layerPoint) )
    if dist < shortestDistance:
        shortestDistance = dist
        closestFeatureId = f.id()

info = (layer, closestFeatureId, shortestDistance)
layerData.append(info)

The mouse click event (a QMouseEvent) is stored in mouseEvent. Its pos() method returns a QPoint describing the position of the mouse click relative to the map canvas (x and y pixel coordinates). To calculate its distance to each feature we’ll need to first convert the mouse click position into real world (layer) coordinates. This can be done using a call to QgsMapTool.toLayerCoordinates() which automatically deals with on-the-fly projection and returns a QPoint in layer coordinates.

The features of a vector layer can be accessed using the layer’s getFeatures() method which returns (by default) a list of all QgsFeature in the layer that we can iterate over using a simple loop.

With access to features we can easily gain access to geometry using QgsFeature.geometry(). The QgsGeometry class has a number of spatial relationship methods including distance() which returns the distance to a second QgsGeometry passed as an argument.

In the code above we loop over all features, keeping track of the feature id of the closest feature using QgsFeature.id(). The shortest distance and closest feature id are stored in shortestDistance and closestFeature. When we are finished iterating through all the features in this layer, we store a note of the layer, its closest feature id and associated distance into layerData.

Note that we convert layerPoint (a QgsPoint) into a QgsGeometry so we can use it directly in spatial relationship operations such as QgsGeometry.distance().

Completing canvasReleaseEvent

We’re almost done. At this point layerData is a list of tuples, one for each vector layer containing:

  1. A reference to the layer
  2. The id of the closest feature within that layer
  3. The distance of that closest feature from the mouse click

Now we can simply sort layerData by distance (its 3rd column) and make a selection based on the layer and feature in the first row of layerData.

  • Add the following code to canvasReleaseEvent() outside the outer for loop:
if not len(layerData) > 0:
    # Looks like no vector layers were found - do nothing
    return

# Sort the layer information by shortest distance
layerData.sort( key=lambda element: element[2] )

# Select the closest feature
layerWithClosestFeature, closestFeatureId, shortestDistance = layerData[0]
layerWithClosestFeature.select( closestFeatureId )

The code above returns early if no workable vector layers were found. It sorts layerData (the list of tuples) by the 3rd element (the distance).

The code then calls QgsVectorLayer.select() to select the closest feature by its feature id.

The plugin should now be finished.

  • Reload the plugin
  • Ensure it works as expected.

Summary

Within this tutorial we’ve worked briefly with the following parts of the QGIS API:

  • Map Tools
  • Map Canvas
  • Vector Layers
  • Features
  • Geometry

Hopefully this has been a useful tutorial. Please feel free to contact us with any specific questions.

You may also like...

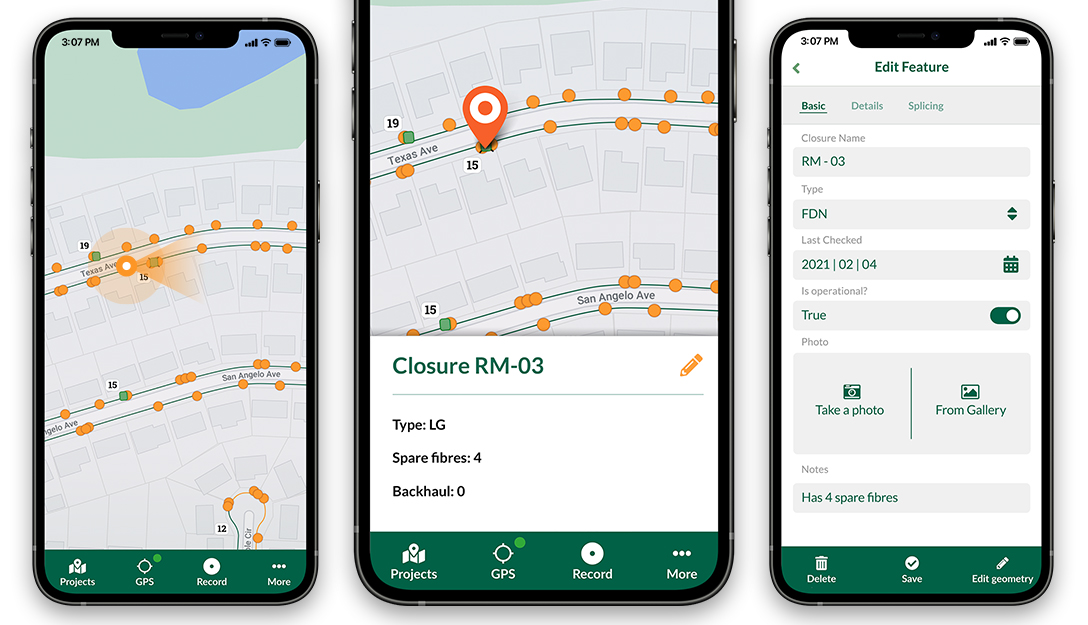
Mergin Maps, a field data collection app based on QGIS. Mergin Maps makes field work easy with its simple interface and cloud-based sync. Available on Android, iOS and Windows. Screenshots of the Mergin Maps mobile app for Field Data Collection
Get it on Google Play Get it on Apple store

A Quick Guide to Getting Started with PyQGIS on Windows

Getting started with Python and QGIS can be a bit overwhelming. In this post we give you a quick start to get you up and running and maybe make your PyQGIS life a little easier.

There are likely many ways to setup a working PyQGIS development environment—this one works pretty well.

Contents

Requirements

  • OSGeo4W Advanced Install of QGIS
  • pip (for installing/managing Python packages)
  • pb_tool (cross-platform tool for compiling/deploying/distributing QGIS plugin)
  • A customized startup script to set the environment (pyqgis.cmd)
  • IDE (optional)
  • Vim (just kidding)

We’ll start with the installs.

Installing

Almost everything we need can be installed using the OSGeo4W installer available on the QGIS website.

OSGeo4W

From the QGIS website, download the appropriate network installer (32 or 64 bit)

  • Run the installer and choose the Advanced Install option
  • Install from Internet
  • Choose a directory for the install—I prefer a path without spaces such as C:\OSGeo4W
  • Accept default for local package directory and Start menu name
  • Tweak network connection option if needed on the Select Your Internet Connection screen
  • Accept default download site location
  • From the Select packages screen, select the following for installation:
    • Desktop -> qgis: QGIS Desktop
    • Libs -> qt4-devel (needed for lrelease/translations)
    • Libs -> setuptools (needed for installing pip)

When you click Next a bunch of additional packages will be suggested—just accept them and continue the install.

Once complete you will have a functioning QGIS install along with the other parts we need. If you want to work with the nightly build of QGIS, choose Desktop -> qgis-dev instead.

If you’ve already installed QGIS using the OSGeo4W installer, just install the qt4-devel and setutools packages. If you installed QGIS using the standalone installer, the easiest option is to remove it and install from OSGeo4W. You can run both the standalone and OSGeo4W versions on the same machine, but you need to be extra careful not to mix up the environment.

Setting the Environment

To continue with the setup, we need to set the environment by creating a .cmd script. The following is adapted from several sources, and trimmed down to the minimum. Copy and paste it into a file named pyqgis.cmd and save it to a convenient location (like your HOME directory).

@echo off
SET OSGEO4W_ROOT=C:\OSGeo4W
call "%OSGEO4W_ROOT%"\bin\o4w_env.bat
call "%OSGEO4W_ROOT%"\apps\grass\grass-6.4.3\etc\env.bat
@echo off
path %PATH%;%OSGEO4W_ROOT%\apps\qgis\bin
path %PATH%;%OSGEO4W_ROOT%\apps\grass\grass-6.4.3\lib

set PYTHONPATH=%PYTHONPATH%;%OSGEO4W_ROOT%\apps\qgis\python;
set PYTHONPATH=%PYTHONPATH%;%OSGEO4W_ROOT%\apps\Python27\Lib\site-packages
set QGIS_PREFIX_PATH=%OSGEO4W_ROOT%\apps\qgis
set PATH=C:\Program Files (x86)\Git\cmd;C:\Program Files (x86)\Vim\vim74;%PATH%
cd %HOMEPATH%\development
cmd.exe

You should customize the set PATH statement to add any paths you want available when working from the command line. I added paths to my git and vim installs.

The cd %HOMEPATH%\development statement starts the shell in my normal working directory—customize or remove as you see fit.

The last line starts a cmd shell with the settings specified above it. We’ll see an example of starting an IDE in a bit.

You can test to make sure all is well by double-clicking on our pyqgis.cmd script, then starting Python and attempting to import one of the QGIS modules:

C:\Users\gsherman\development>python
Python 2.7.5 (default, May 15 2013, 22:44:16) [MSC v.1500 64 bit (AMD64)] on win
32
Type "help", "copyright", "credits" or "license" for more information.
>>> import qgis.core
>>>

If you don’t get any complaints on import, things are looking good.

Python Packages

We need a couple of Python packages as well.

pip

There are several ways to install pip, but since we installed setuptools we can use easy_install:

easy_install pip

Make sure to issue this command from your customized shell (double-click on pyqgis.cmd to start it).

pb_tool

With pip installed we can use it to install pb_tool:

pip install pb_tool

More information on using pb_tool is available on the project website.

Working on the Command Line

Just double-click on your pyqgis.cmd script from the Explorer or a desktop shortcut to start a cmd shell. From here you can use Python interactively and also use pb_tool to compile and deploy your plugin for testing.

IDE Example

With slight modification, we can start our IDE with the proper settings to recognize the QGIS libraries:

@echo off
SET OSGEO4W_ROOT=C:\OSGeo4W
call "%OSGEO4W_ROOT%"\bin\o4w_env.bat
call "%OSGEO4W_ROOT%"\apps\grass\grass-6.4.3\etc\env.bat
@echo off
path %PATH%;%OSGEO4W_ROOT%\apps\qgis\bin
path %PATH%;%OSGEO4W_ROOT%\apps\grass\grass-6.4.3\lib

set PYTHONPATH=%PYTHONPATH%;%OSGEO4W_ROOT%\apps\qgis\python;
set PYTHONPATH=%PYTHONPATH%;%OSGEO4W_ROOT%\apps\Python27\Lib\site-packages
set QGIS_PREFIX_PATH=%OSGEO4W_ROOT%\apps\qgis
set PATH=C:\Program Files (x86)\Git\cmd;C:\Program Files (x86)\Vim\vim74;%PATH%
cd %HOMEPATH%\development
start "PyCharm aware of Quantum GIS" /B "C:\Program Files (x86)\JetBrains\PyCharm 3.4.1\bin\pycharm.exe" %*

We only changed the last line, adding the start statement with the path to the IDE (PyCharm). If you save this to something like pycharm.cmd, you can double-click on it to start PyCharm. The same method works for other IDEs, such as PyDev.

Within your IDE settings, point it to use the Python interpreter included with OSGeo4W—typically at: %OSGEO4W_ROOT%\bin\python.exe. This will make it pick up all the QGIS goodies needed for development, completion, and debugging. In my case OSGEO4W_ROOT is C:\OSGeo4W, so in the IDE, the path to the correct Python interpreter would be: C:\OSGeo4W\bin\python.exe.

Make sure you adjust the paths in your .cmd scripts to match your system and software locations.

Workflow

Here is an example of a workflow you can use once you’re setup for development.

Creating a New Plugin

  1. Use the Plugin Builder plugin to create a starting point [1]
  2. Start your pyqgis.cmd shell
  3. Use pb_tool to compile and deploy the plugin (pb_tool deploy will do it all in one pass)
  4. Activate it in QGIS and test it out
  5. Add code, deploy, test, repeat

Working with Existing Plugin Code

The steps are basically the same was creating a new plugin, except we start by using pb_tool to create a new config file:

  1. Start your pyqgis.cmd shell
  2. Change to the directory containing your plugin code
  3. Use pb_tool create to create a config file
  4. Edit pb_tool.cfg to adjust/add things create may have missed
  5. Start at step 3 in Creating a New Plugin and press on

Troubleshooting

Assuming you have things properly installed, trouble usually stems from an incorrect environment.

  • Make sure QGIS runs and the Python console is available and working
  • Check all the paths in your pygis.cmd or your custom IDE cmd script
  • Make sure your IDE is using the Python interpreter that comes with OSGeo4W

[1] Plugin Builder 2.6 will support generation of a pb_tool config file

QGIS Development with Plugin Builder and pb_tool

The Plugin Builder is a great tool for generating a working plugin project that you can customize.

One of the main tasks in the development cycle is deploying the plugin to the QGIS plugin directory for testing. Plugin Builder comes with a Makefile that can be used on Linux and OS X to aid in development. Depending on your configuration, the Makefile may work on Windows.

To help in managing development of your projects, we’ve come up with another option—a Python tool called pb_tool, which works anywhere QGIS runs.

Here’s what it provides:

Usage: pb_tool [OPTIONS] COMMAND [ARGS]...

  Simple Python tool to compile and deploy a QGIS plugin. For help on a
  command use --help after the command: pb_tool deploy --help.

  pb_tool requires a configuration file (default: pb_tool.cfg) that declares
  the files and resources used in your plugin. Plugin Builder 2.6.0 creates
  a config file when you generate a new plugin template.

  See http://g-sherman.github.io/plugin_build_tool for for an example config
  file. You can also use the create command to generate a best-guess config
  file for an existing project, then tweak as needed.

Options:
  --help  Show this message and exit.

Commands:
  clean       Remove compiled resource and ui files
  clean_docs  Remove the built HTML help files from the...
  compile     Compile the resource and ui files
  create      Create a config file based on source files in...
  dclean      Remove the deployed plugin from the...
  deploy      Deploy the plugin to QGIS plugin directory...
  doc         Build HTML version of the help files using...
  list        List the contents of the configuration file
  translate   Build translations using lrelease.
  validate    Check the pb_tool.cfg file for mandatory...
  version     Return the version of pb_tool and exit
  zip         Package the plugin into a zip file suitable...

In the command summary, a description ending in … means there is more to see using the help switch:

1
2
3
4
5
6
7
8
9
pb_tool zip --help
Usage: pb_tool zip [OPTIONS]

  Package the plugin into a zip file suitable for uploading to the QGIS
  plugin repository

Options:
  --config TEXT  Name of the config file to use if other than pb_tool.cfg
  --help         Show this message and exit.

The Configuration File

pb_tool relies on a configuration file to do its work. Here’s a sample pb_tool.cfg file:

# Configuration file for plugin builder tool
# Sane defaults for your plugin generated by the Plugin Builder are
# already set below.
#
[plugin]
# Name of the plugin. This is the name of the directory that will
# be created in .qgis2/python/plugins
name: TestPlugin

[files]
# Python  files that should be deployed with the plugin
python_files: __init__.py test_plugin.py test_plugin_dialog.py

# The main dialog file that is loaded (not compiled)
main_dialog: test_plugin_dialog_base.ui

# Other ui files for dialogs you create (these will be compiled)
compiled_ui_files: foo.ui

# Resource file(s) that will be compiled
resource_files: resources.qrc

# Other files required for the plugin
extras: icon.png metadata.txt

# Other directories to be deployed with the plugin.
# These must be subdirectories under the plugin directory
extra_dirs:

# ISO code(s) for any locales (translations), separated by spaces.
# Corresponding .ts files must exist in the i18n directory
locales: af

[help]
# the built help directory that should be deployed with the plugin
dir: help/build/html
# the name of the directory to target in the deployed plugin
target: help

The configuration file is pretty much self-explanatory and represents that generated by Plugin Builder 2.6 for a new plugin. As you develop your code, you simply add the file names to the appropriate sections.

Plugin Builder 2.6 will be available the week of the QGIS 2.6 release. In the meantime, you can use pb_tool create to create a config file. See the pb_tool website for more information.

Deploying

Here’s what a deployment looks like with pb_tool:

$ pb_tool deploy
Deploying will:
            * Remove your currently deployed version
            * Compile the ui and resource files
            * Build the help docs
            * Copy everything to your .qgis2/python/plugins directory

Proceed? [y/N]: y
Removing plugin from /Users/gsherman/.qgis2/python/plugins/TestPlugin
Deploying to /Users/gsherman/.qgis2/python/plugins/TestPlugin
Compiling to make sure install is clean
Skipping foo.ui (unchanged)
Compiled 0 UI files
Skipping resources.qrc (unchanged)
Compiled 0 resource files
Building the help documentation
sphinx-build -b html -d build/doctrees   source build/html
Running Sphinx v1.2b1
loading pickled environment... done
building [html]: targets for 0 source files that are out of date
updating environment: 0 added, 0 changed, 0 removed
looking for now-outdated files... none found
no targets are out of date.

Build finished. The HTML pages are in build/html.
Copying __init__.py
Copying test_plugin.py
Copying test_plugin_dialog.py
Copying test_plugin_dialog_base.ui
Copying foo.py
Copying resources_rc.py
Copying icon.png
Copying metadata.txt
Copying help/build/html to /Users/gsherman/.qgis2/python/plugins/TestPlugin/help

Getting Started

For details on installing and using pb_tool, see: http://g-sherman.github.io/plugin_build_tool

QGIS talks at FOSS4G 2014

Did you miss FOSS4G 2014? Don’t despair: the talks have been recorded and are available on Vimeo. I suggest to start with the following video of Pirmin’s talk wrapping up the developments since last year:

From Nottingham to PDX: QGIS 2014 roundup — Pirmin Kalberer, Sourcepole AG from FOSS4G on Vimeo.

Other talks include:

For the full list see https://vimeo.com/search/sort:plays/format:detail?q=qgis+foss4g

And of course – last but not least – watch Gary Sherman’s Sol Katz Award acceptance speech if you haven’t seen it yet. Congratulations Gary!

Gary Sherman’s Sol Katz Award acceptance from Gateway Geomatics on Vimeo.


Creating custom colour schemes in PyQGIS

In my last post I explored some of the new colour related features available in QGIS 2.6. At the end of that post I hinted at the possibility of creating QGIS colour schemes using python. Let’s take a look…

We’ll start with something nice and easy – a colour scheme which contains a predefined set of colours (e.g., standard company colours). This is done by subclassing QgsColorScheme and implementing the required methods ‘schemeName‘, ‘fetchColors‘ and ‘clone‘. It’s all fairly self explanatory – most of the important stuff happens in fetchColors, which returns a list of QColor/string pairs. Here’s a sample:

from PyQt4.QtCore import *
from PyQt4.QtGui import *

class QgsCgaLightColorScheme(QgsColorScheme):
    def __init__(self, parent=None): 
        QgsColorScheme.__init__(self)
 
    def schemeName(self):
        return "CGA Colors!"
 
    def fetchColors(self,context='', basecolor=QColor()):
        return [[QColor('#555555'),'Gray'],
                    [QColor('#5555FF'),'Light Blue'],
                    [QColor('#55FF55'),'Light Green'],
                    [QColor('#55FFFF'),'Light Cyan'],
                    [QColor('#FF5555'),'Light Red'],
                    [QColor('#FF55FF'),'Light Magenta'],
                    [QColor('#FFFF55'),'Yellow'],
                    [QColor('#FFFFFF'),'White']]
    def flags(self):
        return QgsColorScheme.ShowInAllContexts
 
    def clone(self):
        return QgsCgaLightColorScheme()

cgaScheme = QgsCgaLightColorScheme()
QgsColorSchemeRegistry.instance().addColorScheme(cgaScheme)

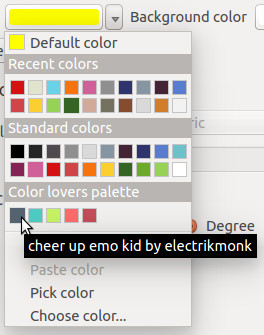
This scheme will now appear in all colour buttons and colour picker dialogs:

CGA colours… what your map was missing!

If you only wanted the scheme to appear in the colour picker dialog, you’d modify the flags method to return QgsColorScheme.ShowInColorDialog instead.

QgsColorSchemes can also utilise a “base colour” when generating their colour list. Here’s a sample colour scheme which generates slightly randomised variations on the base colour. The magic again happens in the fetchColors method, which copies the hue of the base colour and generates random saturation and value components for the returned colours.

from PyQt4.QtCore import *
from PyQt4.QtGui import *
import random

class QgsRandomColorScheme(QgsColorScheme):
    def __init__(self, parent=None): 
        QgsColorScheme.__init__(self)

    def schemeName(self):
        return "Random colors!"

    def fetchColors(self, context='', basecolor=QColor() ):
        noColors = random.randrange(30)
        minVal = 130;
        maxVal = 255;
        colorList = []
        for i in range(noColors):
            if basecolor.isValid():
                h = basecolor.hue()
            else:
                #generate random hue
                h = random.randrange(360);

            s = random.randrange(100,255)
            v = random.randrange(100,255)

            colorList.append( [ QColor.fromHsv( h, s, v), "random color! " + str(i) ] )

        return colorList

    def flags(self):
        return QgsColorScheme.ShowInAllContexts

    def clone(self):
        return QgsRandomColorScheme()

randomScheme = QgsRandomColorScheme()
QgsColorSchemeRegistry.instance().addColorScheme(randomScheme)

Here’s the random colour scheme in action… note how the colours are all based loosely around the current red base colour.

Randomised colours

You may also have noticed the context argument for fetchColors. This can be used to tweak the returned colour list depending on the context of the colour picker. Possible values include ‘composer‘, ‘symbology‘, ‘gui‘ or ‘labelling‘.

One final fun example… here’s a colour scheme which grabs its colours using the Colour Lovers API to fetch a random popular palette from the site:

from PyQt4.QtCore import *
from PyQt4.QtGui import *
from xml.etree import ElementTree
import urllib2
import random

class colorLoversScheme(QgsColorScheme):

    def __init__(self, parent=None): 
        QgsColorScheme.__init__(self)
        xmlurl = 'http://www.colourlovers.com/api/palettes/top'

        headers = { 'User-Agent' : 'Mozilla/5.0' }
        req = urllib2.Request(xmlurl, None, headers)
        doc = ElementTree.parse(urllib2.urlopen(req)).getroot()

        palettes = doc.findall('palette')
        palette = random.choice(palettes)

        title = palette.find('title').text
        username = palette.find('userName').text
        attrString = title + ' by ' + username
        colors = ['#'+c.text for c in palette.find('colors').findall('hex')]

        self.color_list = [[QColor(c), attrString] for c in colors]

    def schemeName(self):
        return "Color lovers popular palette"

    def fetchColors(self, context='', basecolor=QColor()):
        return self.color_list

    def flags(self):
        return QgsColorScheme.ShowInAllContexts

    def clone(self):
        return colorLoversScheme()

loversScheme = colorLoversScheme()      
QgsColorSchemeRegistry.instance().addColorScheme( loversScheme )

Clicking a colour button will now give us some daily colour scheme inspiration…

Grabbing a palette from the Colours Lovers site

Grabbing a palette from the Colours Lovers site

Ok, now it’s over to all you PyQGIS plugin developers – time to go wild!

What’s new in QGIS 2.6 – Tons of colour improvements!

With one month left before the release of QGIS 2.6, it’s time to dive into some of the new features it will bring… starting with colours.

Working with colours is a huge part of cartography. In QGIS 2.4 I made a few changes to improve interaction with colours. These included the ability to copy and paste colours by right clicking on a colour button, and dragging-and-dropping colours between buttons. However, this was just the beginning of the awesomeness awaiting colours in QGIS 2.6… so let’s dive in!
Part 1 – New colour picker dialog

While sometimes it’s best to stick with an operating system’s native dialog boxes, colour pickers are one exception to this. That’s because most native colours pickers are woefully inadequate, and are missing a bunch of features which make working with colours much easier. So, in QGIS 2.6, we’ve taken the step of rolling out our very own colour picker:

New QGIS colour picker

Before starting work on this, I conducted a review of a number of existing colour picker implementations to find out what works and what doesn’t. Then, I shamelessly modelled this new dialog off the best bits of all of these! (GIMP users will find the new dialog especially familiar – that’s no coincidence, it’s a testament to how well crafted GIMP’s colour picker is.)

The new QGIS colour picker features:

  • Colour sliders and spin boxes for Hue, Saturation, Value, Red, Green and Blue colour components
  • An opacity slider (no more guessing what level of transparency “189” corresponds to!)
  • A text entry box which accepts hex colours, colour names and CSS rgb(#,#,#) type colours. (The drop down arrow you can see on this box in the screenshot above allows you to specify the display format for colours, with options like #RRGGBB and #RRGGBBAA)
  • A grid of colour swatches for storing custom colours
  • A visual preview of the new colour compared to the previous colour
  • Support for dragging and dropping colours into and out of the dialog
  • A colour wheel and triangle method for tweaking colours (by the way, all these colour widgets are reusable, so you can easily dump them into your PyQGIS plugins)
    Colour wheel widget
  • A colour palettes tab. This tab supports adding and removing colours from a palette, creating new palettes and importing and exporting colours from a GPL palette file. (We’ll explore colour palettes in more detail later in this post.)
    Colour palettes
  • A colour sampler! This tab allows you to sample a colour from under the mouse pointer. Just click the “Sample color” button, and then click anywhere on the screen (or press the space bar if you’re sampling outside of the QGIS window). You even get the choice of averaging the colour sample over a range of pixels. (Note that support for sampling is operating system dependant, and currently it is not available under OSX.)
    Built in colour sampler! Woohoo!

Part 2 – New colour button menus

Just like the new colour dialog is heavily based off other colour dialog implementations, this new feature is inspired by Microsoft’s excellent colour buttons in their recent Office versions (I make no claim to originality here!). Now, all QGIS colour buttons come with a handy drop down menu which allows you to quickly choose from some frequently used colour shortcuts. You’ve got the previously available options of copying and pasting colours from 2.4, plus handy swatches for recently used colours and for other standard colours.

colour_menu

Handy colour menu for buttons

Part 3 – Colour palettes

You may have noticed in the above screenshot the “Standard colors” swatches, and wondered what these were all about.  Well, QGIS 2.6 has extensive support for color palettes. There’s a few different “built-in” color palettes:

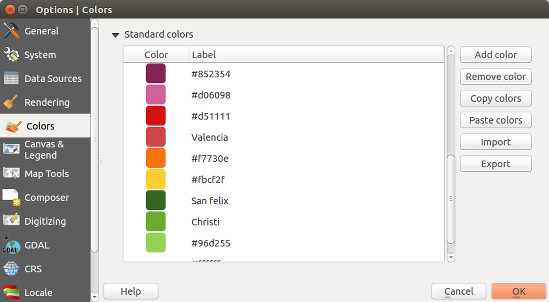
  • The “Standard colors” palette. This palette can be modified through the Options → Colors tab. You can add, remove, edit, and rename colours, as well as import color schemes from a GPL palette file. These standard colours apply to your QGIS installation, so they’ll be available regardless of what project you’re currently working on.

    Customising the standard colours

    Customising the standard QGIS colours

  • The “Project colors” palette. This can be accessed via the Project Properties → Default styles tab. This palette is saved inside the .qgs project file, so it’s handy for setting up a project-specific colour scheme.
  • The “Recent colors” palette. This simply shows colours you’ve recently used within QGIS.

You can easily create new colour palettes directly from the colour picker dialog. Behind the scenes, these palettes are saved into your .qgis/palettes folder as standard GPL palette files, which makes it nice and easy to modify them in other apps or transfer them between installations. It’s also possible to just dump a stack of quality palettes directly into this folder and they’ll be available from within QGIS.
Perhaps the best bit about colour schemes in QGIS is that they can be created using PyQGIS plugins, which opens up tons of creative possibilities… More on this in a future blog post!

So there we go. Tons of improvements for working with colours are heading your way in QGIS 2.6, which is due out on the 24th October.

(Before we end, let’s take a quick look at what the competition offers over in MapInfo land. Yeah… no thanks. You might want to invest some development time there Pitney Bowes!)
QGIS atlas on non geometry tables

This is proof that no matter how close you are to a project you can still miss some really cool stuff that you never knew or considered was possible.
The problem to solve:

You have a CSV with a row of colours. Each row should be a new map and each column is the colour for that feature.

This is example of that kind of input

A       B
#93b2f3    #FF0000 
#dfbdbb    #FF0000
#f9d230    #FF0000

This questhion was asked on GIS.SE this morning. When I first saw it I had no idea it was even possible, I was thinking along the same lines as the person asking, that it would have to be done with Python. Not hard, but a lot harder then something built in and I put it in the too hard basket. I thought the atlas can almost do that, almost but not really.

Well almost was wrong. It can.

Note: You will need QGIS 2.5 (2.6 when released) for this to work

Lets make some cool maps! (and go to GIS.SE and upvote Nyalls answer)

First open your vector layer and the CSV. Don’t worry about style just yet, we will do it later.

Create a composer and add your map.

Here comes the first part of the trick.

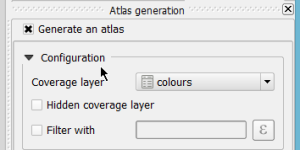
Enable Atlas and set the coverage layer to the CSV layer. Wait? What? That doesn’t make any sense. If you think about it for a while it does. We need a map for each row (or “feature”) in the CSV and atlas does just that.

atlas_colours

How do we style the features? Well here is the other part of the trick. In 2.6 there is a magic expression function that returns a field value from another feature. And it’s as simple as attribute( $atlasfeature , 'A' ) – give me the attribute from the current atlas feature for field ‘A’. Simple.

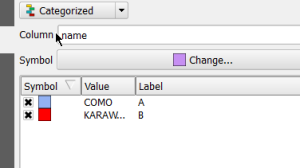
First we categorize our features so we have a symbol for each feature. I’m using a sample layer I have but you can understand how this works. The first feature is A and the other is B, etc, etc

render

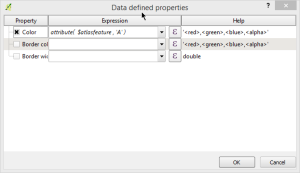
Now to use another awesome feature of QGIS. The data defined symbol properties (and labels too). Change each symbol and define the colour data defined property. Using attribute( $atlasfeature , 'A' ) for the first one and attribute( $atlasfeature , 'B' ) for the second.

atlas_feature

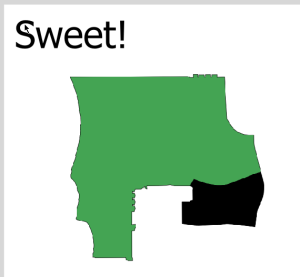
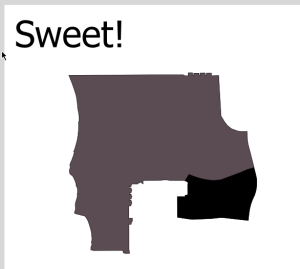
That is it. Now jump back over to your composer and enable Atlas preview.

atlas1

atlas2

Bam! Magic! How awesome is that!

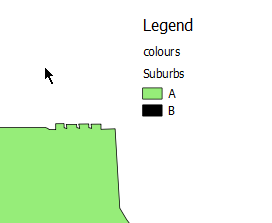
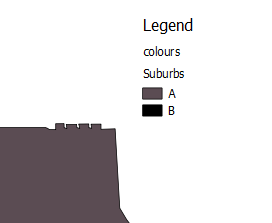
Now my other thought was. “Ok cool, but the legend won’t update”. I should learn by now not to assume anything. The legend will also update based on the colours from the feature.

atlas1_legend

atlas2_legend

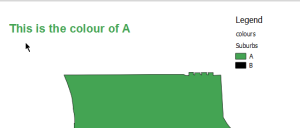
How far can we take this. What if you need the label to match the colour. Simple just make the label text look like this:

<h1 style='color:[% "A" %]'>This is the colour of A</h1>

atlas1_label

Heaps of credit to Nyall and the others who have added all this great stuff to the composer, atlas, and the data defined properties. It’s not something that you will do every day but it’s great to see the flexibility of QGIS in these situations.

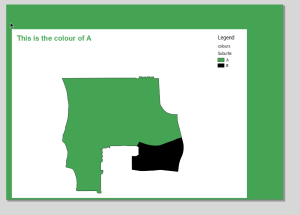
You can even make the background colour of the page match the atlas feature

atlas1_back

but don’t do that because people might think you are mad ;)


Filed under: Open Source

QGIS training (3 days) and Birdwatching/Field data collection (2 days) in South Portugal, January 2015

Faunalia and Imagine-Science are pleased to announce a QGIS training (3 days) course during a week that will include 2 days of field activities related to birdwatching and field data collection. Where: Portugal/Algarve, specifically “Ria de Alvor -Mexilhoeira Grande” near Portimão. When: 26 to 30 January 2015.   For more informations about QGIS training program, […]

QGIS atlas on non geometry tables

This is proof that no matter how close you are to a project you can still miss some really cool stuff that you never knew or considered was possible.

The problem to solve:

You have a CSV with a row of colours. Each row should be a new map and each column is the colour for that feature.

This is example of that kind of input

A       B
#93b2f3 #FF0000 
#dfbdbb #FF0000
#f9d230 #FF0000

This questhion was asked on GIS.SE this morning. When I first saw it I had no idea it was even possible, I was thinking along the same lines as the person asking, that it would have to be done with Python. Not hard, but a lot harder then something built in and I put it in the too hard basket. I thought the atlas can almost do that, almost but not really.

Well almost was wrong. It can.

Note: You will need QGIS 2.5 (2.6 when released) for this to work

Lets make some cool maps! (and go to GIS.SE and upvote Nyalls answer)

First open your vector layer and the CSV. Don't worry about style just yet, we will do it later.

Create a composer and add your map.

Here comes the first part of the trick.

Enable Atlas and set the coverage layer to the CSV layer. Wait? What? That doesn't make any sense. If you think about it for a while it does. We need a map for each row (or "feature") in the CSV and atlas does just that.

Alt Text

How do we style the features? Well here is the other part of the trick. In 2.6 there is a magic expression function that returns a field value from another feature. And it's as simple as attribute( $atlasfeature , 'A' ) - give me the attribute from the current atlas feature for field 'A'. Simple.

First we categorize our features so we have a symbol for each feature. I'm using a sample layer I have but you can understand how this works. The first feature is A and the other is B, etc, etc

Alt Text

Now to use another awesome feature of QGIS. The data defined symbol properties (and labels too). Change each symbol and define the colour data defined property. Using attribute( $atlasfeature , 'A' ) for the first one and attribute( $atlasfeature , 'B' ) for the second.

Alt Text

That is it. Now jump back over to your composer and enable Atlas preview.

Alt Text

Alt Text

Bam! Magic! How awesome is that!

Now my other thought was. "Ok cool, but the legend won't update". I should learn by now not to assume anything. The legend will also update based on the colours from the feature.

Alt Text

Alt Text

How far can we take this. What if you need the label to match the colour. Simple just make the label text look like this:

<h1 style='color:[% "A" %]'>This is the colour of A</h1>

Alt Text

Heaps of credit to Nyall and the others who have added all this great stuff to the composer, atlas, and the data defined properties. It's not something that you will do every day but it's great to see the flexibility of QGIS in these situations.

You can even make the background colour of the page match the atlas feature

Alt Text

but don't do that because people might think you are mad ;)

QGIS atlas on non geometry tables

This is proof that no matter how close you are to a project you can still miss some really cool stuff that you never knew or considered was possible.

The problem to solve:

You have a CSV with a row of colours. Each row should be a new map and each column is the colour for that feature.

This is example of that kind of input

A       B
#93b2f3 #FF0000 
#dfbdbb #FF0000
#f9d230 #FF0000

This questhion was asked on GIS.SE this morning. When I first saw it I had no idea it was even possible, I was thinking along the same lines as the person asking, that it would have to be done with Python. Not hard, but a lot harder then something built in and I put it in the too hard basket. I thought the atlas can almost do that, almost but not really.

Well almost was wrong. It can.

Note: You will need QGIS 2.5 (2.6 when released) for this to work

Lets make some cool maps! (and go to GIS.SE and upvote Nyalls answer)

First open your vector layer and the CSV. Don't worry about style just yet, we will do it later.

Create a composer and add your map.

Here comes the first part of the trick.

Enable Atlas and set the coverage layer to the CSV layer. Wait? What? That doesn't make any sense. If you think about it for a while it does. We need a map for each row (or "feature") in the CSV and atlas does just that.

atlas_colours.png

How do we style the features? Well here is the other part of the trick. In 2.6 there is a magic expression function that returns a field value from another feature. And it's as simple as attribute( $atlasfeature , 'A' ) - give me the attribute from the current atlas feature for field 'A'. Simple.

First we categorize our features so we have a symbol for each feature. I'm using a sample layer I have but you can understand how this works. The first feature is A and the other is B, etc, etc

render.png

Now to use another awesome feature of QGIS. The data defined symbol properties (and labels too). Change each symbol and define the colour data defined property. Using attribute( $atlasfeature , 'A' ) for the first one and attribute( $atlasfeature , 'B' ) for the second.

atlas_feature.png

That is it. Now jump back over to your composer and enable Atlas preview.

atlas1.png

atlas2.png

Bam! Magic! How awesome is that!

Now my other thought was. "Ok cool, but the legend won't update". I should learn by now not to assume anything. The legend will also update based on the colours from the feature.

atlas1_legend.png

atlas2_legend.png

How far can we take this. What if you need the label to match the colour. Simple just make the label text look like this:

<h1 style='color:[% "A" %]'>This is the colour of A</h1>

atlas1_label.png

Heaps of credit to Nyall and the others who have added all this great stuff to the composer, atlas, and the data defined properties. It's not something that you will do every day but it's great to see the flexibility of QGIS in these situations.

You can even make the background colour of the page match the atlas feature

atlas1_back.png

but don't do that because people might think you are mad ;)

QGIS atlas on non geometry tables

This is proof that no matter how close you are to a project you can still miss some really cool stuff that you never knew or considered was possible.

The problem to solve:

You have a CSV with a row of colours. Each row should be a new map and each column is the colour for that feature.

This is example of that kind of input

A       B
#93b2f3 #FF0000 
#dfbdbb #FF0000
#f9d230 #FF0000

This questhion was asked on GIS.SE this morning. When I first saw it I had no idea it was even possible, I was thinking along the same lines as the person asking, that it would have to be done with Python. Not hard, but a lot harder then something built in and I put it in the too hard basket. I thought the atlas can almost do that, almost but not really.

Well almost was wrong. It can.

Note: You will need QGIS 2.5 (2.6 when released) for this to work

Lets make some cool maps! (and go to GIS.SE and upvote Nyalls answer)

First open your vector layer and the CSV. Don't worry about style just yet, we will do it later.

Create a composer and add your map.

Here comes the first part of the trick.

Enable Atlas and set the coverage layer to the CSV layer. Wait? What? That doesn't make any sense. If you think about it for a while it does. We need a map for each row (or "feature") in the CSV and atlas does just that.

Alt Text

How do we style the features? Well here is the other part of the trick. In 2.6 there is a magic expression function that returns a field value from another feature. And it's as simple as attribute( $atlasfeature , 'A' ) - give me the attribute from the current atlas feature for field 'A'. Simple.

First we categorize our features so we have a symbol for each feature. I'm using a sample layer I have but you can understand how this works. The first feature is A and the other is B, etc, etc

Alt Text

Now to use another awesome feature of QGIS. The data defined symbol properties (and labels too). Change each symbol and define the colour data defined property. Using attribute( $atlasfeature , 'A' ) for the first one and attribute( $atlasfeature , 'B' ) for the second.

Alt Text

That is it. Now jump back over to your composer and enable Atlas preview.

Alt Text

Alt Text

Bam! Magic! How awesome is that!

Now my other thought was. "Ok cool, but the legend won't update". I should learn by now not to assume anything. The legend will also update based on the colours from the feature.

Alt Text

Alt Text

How far can we take this. What if you need the label to match the colour. Simple just make the label text look like this:

<h1 style='color:[% "A" %]'>This is the colour of A</h1>

Alt Text

Heaps of credit to Nyall and the others who have added all this great stuff to the composer, atlas, and the data defined properties. It's not something that you will do every day but it's great to see the flexibility of QGIS in these situations.

You can even make the background colour of the page match the atlas feature

Alt Text

but don't do that because people might think you are mad ;)

Labels as text in SVG exports

Today’s post is inspired by a recent thread on the QGIS user mailing list titled “exporting text to Illustrator?”. The issue was that with the introduction of the new labeling system, all labels were exported as paths when creating an SVG. Unnoticed by almost everyone (and huge thanks to Alex Mandel for pointing out!) an option has been added to 2.4 by Larry Shaffer which allows exporting labels as texts again.

To export labels as text, open the Automatic Placement Settings (button in the upper right corner of the label dialog) and uncheck the Draw text as outlines option.

Screenshot 2014-09-20 21.03.26

Note that we are also cautioned that

For now the developers recommend you only toggle this option right
before exporting
and that you recheck it after.

Alex even recorded a video showcasing the functionality:


Registration is open

Registration is open now for the Scottish QGIS user group.  You can register here:

https://www.eventbrite.co.uk/e/qgis-uk-scottish-user-group-tickets-13092023595

The planned agenda for the day is as follows:

  • arrive for coffee 9.00
  • welcome and intro 9.30
  • workshops 10.00 – 12.00
  • lightning talks 12.00 – 12.30
  • lunch 12.30 – 13.30
  • afternoon presentations 13.30 – 16.00
  • close
  • geobeers

There is a great line up of talks and after feedback from the last user group there are now two workshops in the morning for you to choose from.

  • Workshop 1: QGIS plugin development with Python
  • Workshop 2: Using the QGIS Processing module
  • Michael Spencer – Raster time series analysis using FOSS4G
  • Heikki Versanto – Visualising population demographics in 3D
  • Simon Willcocks – Using PgRouting with OS ITN in QGIS
  • Ross McDonald – Cartographic experiments in QGIS
  • Mag Low – Rendering OS MasterMap buildings using QGIS2threeJS
  • Paul Weedon – PostGIS, QGIS and Associated Street Data
  • Lightning talks – a few minutes to tell us about, well, anything really.

Thanks to EDINA, thinkWhere and Ordnance Survey for helping to make the day happen!


Exporting QGIS symbols as images

Ever wanted to export your QGIS symbols as images? Yes. Well here is some Python code that will let you do just that:

from PyQt4.QtCore import QSize
from PyQt4.QtGui import QImage, QPainter

style = QgsStyleV2.defaultStyle()
names = style.symbolNames()
size = QSize(64, 64)

for name in names:
    symbol = style.symbol(name)
    if not symbol.type() == QgsSymbolV2.Marker:
        continue

    image = QImage(size, QImage.Format_ARGB32_Premultiplied)
    image.fill(0) 
    painter = QPainter(image)
    symbol.drawPreviewIcon(painter, size)
    painter.end()
    image.save(r"C:temp{}.png".format(name), "PNG")

Or in 2.6 it’s even easier:

from PyQt4.QtCore import QSize
from PyQt4.QtGui import QImage, QPainter

style = QgsStyleV2.defaultStyle()
names = style.symbolNames()
size = QSize(64, 64)

for name in names:
    symbol = style.symbol(name)
    if not symbol.type() == QgsSymbolV2.Marker:
        continue

    image = symbol.asImage(size)
    image.save(r"C:temp{}.png".format(name), "PNG")

Bam!

symbols

Why? Because we can.


Filed under: qgis

  • <<
  • Page 74 of 142 ( 2821 posts )
  • >>

Back to Top

Sustaining Members