Related Plugins and Tags

QGIS Planet

QGIS server 3.28 is officially OGC compliant

QGIS Server provides numerous services like WMS, WFS, WCS, WMTS and OGC API for Features. These last years, a lot of efforts were made to offer a robust implementation of the WMS 1.3.0 specification.

We are pleased to announce that QGIS Server LTR 3.28 is now certified against WMS 1.3.0.

This formal OGC certification process is performed once a year, specifically for the Long Term Release versions. But, as every change in QGIS source code is now tested against the formal OGC test suites (using OGC TeamEngine) to avoid any kind of regressions, you can always check any revision of the code against OGC failures in our Github continuous integration results.

All this has been possible thanks to the QGIS’s sustaining members and contributors.

I’ve archived my Tweets: Goodbye Twitter, Hello Mastodon

Today, Jeff Sikes @[email protected], alerted me to the fact that “Twitter has removed all media attachments from 2014 and prior” (source: https://firefish.social/notes/9imgvtckzqffboxt). So far, it seems unclear whether this was intentional or a system failure (source: https://mas.to/@carnage4life/110922114407553901).

Since I’ve been on Twitter since 2011, this means that some media files are now lost. While the loss of a few low-res images is probably not a major loss for humanity, I would prefer to have some control over when and how content I created vanishes. So, to avoid losing more content, I have followed Jeff’s recommendation to create a proper archival page:

https://anitagraser.github.io/twitter-archive/

It is based on an export I pulled in October 2022 when I started to use Mastodon as my primary social media account. Unfortunately, this export did not include media files.

To follow me in the future, find me on:

https://fosstodon.org/@underdarkGIS

Btw, a recent study published on Nature News shows that Mastodon is the top-ranking Twitter replacement for scientists.

To find other interesting people on Mastodon, there are many useful tools and lists, including, for example:


Update 2023-11-04: I’ve completely deleted my X / Twitter account. If you find any account pretending they are me on that platform, it’s an impostor.

Plugin Update June & July 2023

In this summer plugin update, we explore 51 new plugins that have been published in the QGIS plugin repository.

Here’s the quick overview in reverse chronological order. If any of the names or short descriptions piques your interest, you can find the direct link to the plugin page in the table below the screenshot.

JAPATI
The QGIS plugin is used by agencies in the West Java provincial government to upload data and create map services on the geoserver in order to publish data internally and publicly
BD TOPO® Extractor
This tool allows you to extract specific data from IGN’s BD TOPO®. The extraction is based on either an extent drawned by the user on the map canvas or a layer’s extent.
Opacity Set
Sets opacity 0.5, 0.75 or 1 for selected raster layer.
USM toolset (Urban Sprawl Metric toolset)
The USM Toolset was developed to facilitate the calculation of Weighted Urban Proliferation (WUP) and all components of urban sprawl for landscapes that include built-up areas (e.g., dispersion (DIS), land uptake per person (LUP).
DAI
DAI (Daily Aerial Image)
France Commune Cadastre
Search for a cadastral parcel with the French cadastre API
Two distances intersection
Get the intersection of two distances (2D cartesian)
IDG
Plugin providing easy access to data from different SDI
SPAN
SPAN is a flexible and easy to use open-source plugin based on the QGIS software for rooftop mounted PV potential estimation capable of estimating every roof surface’s PV potential.
CSV Batch Import
Batch import of CSV vector layers
Imagine Sustainability
sustainability assessment tool based on geographic MCDA algorithms. Especially suitable for Natura 2000 sites, based on pyrepo-mcda package(https://pyrepo-mcda.readthedocs.io/)
QGIS Hub Plugin
A QGIS plugin to fetch resources from the QGIS Hub
VFK Plugin
Data českého katastru nemovitostí (VFK)<br><br>Czech cadastre data (VFK)
LinearReferencing
Tools for linear referenced data
CIGeoE Circumvent Polygon
Changes the line to circumvent a polygon between the intersection points
UA XML importer
Імпортує геометрію ділянки, обмежень, угідь та територіальних зон з кадастрового обмінного файлу XML
eagris
QGIS eAGRI plugin
Geojson Filling
Allows to fill imported geojson layers with pre-defined field values
Save All
File saving script that saves qgis project file and all vector and raster layers into user-specified folder. Automatically detects file type and saves as that file type (supports SHP, GPKG, KML, CSV, and TIF). All styles and formatting are saved with each layer (except for KML), ensuring that they are opened up with the proper style the next time the project is opened. Temporary layers are made permanent automatically.
Fast Density Analysis
A fast kernel density visualization plugin for geospatial analytics
StreetSmart
This plugin manages the Street Smart imagery
FilePath
Copies the path of layer
pandapower QGis Plugin
Plugin to work with pandapower or pandapipes networks
Eqip
Qgis Pip Management
Infra-O plugin
Plugin for Finnish municipal asset management.
Add to Felt
Create a collaborative Felt (felt.com) map from QGIS
Lahar Flow Map Tools
This plugin is for opening and processing results from LaharFlow
Station Offset
This plugin computes the station and offset of points along polylines and exports those values to csv for other applications
Jilin1Tiles
Jilin1Tiles
SiweiEarth
This plugin is used to load the daily new map provided by Siwei Earth.
QdrawEVT
Easily draw and select entities in the drawing footprint. Installation of the plugin “Memory layer saver” highly recommended. See Read_me.txt file in the Help folder of the plugin. Dessiner et selectionner facilement les entités dans l’emprise du dessin. Installation du plugin “Memory layer saver” fortement recommandé. Voir fichier Lisez_moi dans le dossier Hepl du plugin. Merci !
Fuzzy Logic Toolbox
This plugin implements the fuzzy inference system
feature_space
A plugin to plot feature space and export areas as raster or vector
Panorama Viewer
Plugin for QGIS to view 360-degrees panoramic photos
Map Segmenter
Uses machine learning to segment a map into ares of interest.
ALKIS Plugin
Das Plugin verfügt über zwei Werkzeugkästen und insgesamt vier einfache Werkzeuge. Im Werkzeugkasten “Gebäude” finden Sie drei nützliche Werkzeuge, um ALKIS-Gebäudedaten aufzubereiten. Sie können Dachüberstände erstellen, Gebäude auf der Erdoberfläche extrahieren und redundante Gebäudeteile eliminieren. Im Werkzeugkasten “Nutzung” steht Ihnen ein weiteres Werkzeug zur Verfügung, mit dem Sie die Objektarten in den Objektartengruppen Vegetation, Siedlung, Verkehr und Gewässer zuordnen können. Das Plugin erfordert als Datengrundlage ALKIS-Daten im vereinfachten Format, die in NRW, Deutschland, frei verfügbar sind. Dieses Plugin wurde zu Demonstrationszwecken entwickelt. Das Ziel besteht darin, in einer Videoreihe die Entwicklung eines Plugins ohne die Anwendung von Python vorzustellen. Die Tutorials dazu findet ihr in der folgenden Playlist: https://www.youtube.com/playlist?list=PLq5L9pOv_ur5wRAVHt3iVw61mUUpb54aJ
isobenefit
Isobenefit Urbanism plugin for QGIS.
UA_MBD_TOOLS
Tools for
Qpositional
assessment the positional quality of geographic data
Terraform
Implementation of popular topographic correction algorithms and various methods of their evaluation.
PathoGAME
The goal is to find the location of the contamination as soon as possible.
Azure Maps Creator
Provides access to Azure Maps Creator services
CIGeoE Identify Dangles
Identifies dangles in a viewport
Delete Duplicate Fields
Delete duplicate or redundant fields from a vector file
LocationFinder
Allow QGIS to use LocationFinder (interactive geocoding)
COA TPW Polygonizer
This plugin can be used to create polygons that track the shape of a line network, including the proper handling of intersections with common nodes of the line segments.
XPlan-Umring
Create XPlanGML from polygon(s)
Tweet my river
AI Tweet classifier for river layers
3DCityDB Tools
Tools to visualize and manipulate CityGML data stored in the 3D City Database
GroundTruther
A toolset for Seafloor Caracterization
Faunalia Toolkit
Cartographic and spatial awesome analysis tool and much much more!

QGIS Contributor meeting at BIDS ‘23 Vienna

We are happy to announce that OSGeo kindly extended an invitation to have a QGIS contributor meeting joining the OSGeo Community Sprint 2023 during the Big Data from Space 2023 conference in Vienna.

The 26th QGIS Contributor Meeting will be held from Monday, November 6th to Thursday, 9th.

For more details and to sign up, please visit the corresponding OSGeo announcement page.

About QGIS contributor meetings

QGIS Contributors Meetings are volunteer-driven events where contributors to the QGIS project from around the world get together in a common space – usually a university campus. During these events, contributors to the QGIS project take the opportunity to plan their work, hold face-to-face discussions and present new improvements to the QGIS project that they have been working on. Everybody attending the event donates their time to the project for the days of the event. As a project that is built primarily through online collaboration, these meetings provide a crucial ingredient to the future development of the QGIS project. The event is planned largely as an ‘unconference’ with minimal structured programme planning. We do this to allow attendees the freedom to meet dynamically with those they encounter at the event. Those sessions that are planned are advertised on the event web page, and we try to enable remote participation through video conferencing software. Although our hosts are not funded and donate the working space to us, we show our appreciation by making one of our software release’s splash screens in honour of that host, which is a great way to gain exposure of your institution and country to the hundreds of thousands of users that make use of QGIS.

About OSGeo

The Open Source Geospatial Foundation (OSGeo) has a long tradition of organizing code sprints for developers of Free and Open Source GIS software.

Since 2009, the Open Source Geospatial Foundation (OSGeo) has been organizing a yearly Code Sprint of the “C Tribe” OSGeo projects, which has evolved into a full OSGeo Community Sprint and all “Tribes” are included/welcome. Leading developers of projects like GDAL, PostGIS,
MapServer, GeoServer, GRASS, QGIS, PDAL, pygeoapi and many more get together to discuss new ideas, hack, decide, tackle large geospatial problems and have fun.

The OSGeo Community Sprint is open to all who wish to participate in one or more projects. There is always plenty to do – it’s not all about programming. Translation, documentation, feedback, discussions, testing – all this is also important for projects so everyone is cordially invited to attend the code sprint!

About BiDS

BiDS brings together key actors from industry, academia, EU entities and government to reveal user needs, exchange ideas and showcase the latest technical solutions and applications touching all aspects of space and big data technologies, providing a unique opportunity to discuss and present the most recent innovations and challenges encountered in the context of big data from space. The 2023 edition of BiDS will focus not only on technologies enabling insight and foresight inferable from big data from space. Together, we want to emphasize how breakthrough space data-driven technologies impact society’s grand challenges, such as climate change and the green transition.

The event, organized by the European Space Agency (ESA) together with the European Union Satellite Center (SatCen) and the Joint Research Center (JRC), will take place at the Austria center Vienna, and counts on the support of the partners FFG, Austria in Space and the Federal Ministry Republic of Austria.

2.8.5 - Insightful Indri

Changes

🐛 Bug Fixes

  • Fix geometry highlighter crash for certain polygons containing overlapping vertices
  • Fix memory leaks when aborting an ongoing map canvas rendering operation

Note: on Windows, while the installer filename contains 2.8.5, the actual version is 2.8.2

2.8.4 - Insightful Indri

Changes

🐛 Bug Fixes

  • Fix /vsicurl/ data sources
  • Fix show visible layer features action when the vector layer CRS does not match that of the project

FOSS4G 2023 Prizren

FOSS4G is the annual global event of free and open source geographic technologies and open geospatial data hosted by OSGeo. In 2023 it took place in Prizren, Kosovo.

QField background tracking

Years ago, the QField community and its users showed their love for their favourite field app by supporting a successful crowdfunding to improve camera handling.

Since then, OPENGIS.ch has continued to lead the development of QField with the regular support of sponsors. We couldn’t be prouder of the progress we have made, with plenty of new features added in every major release. This includes major improvements to positioning including location tracking, integration of external GNSS receivers through not only Bluetooth but TCP/UDP and serial port connections, accuracy indicator and constraints, and most recently sensors reading to list a few.

We are now calling for the community to help further better QField and unlock an important milestone: background location tracking service.

Main goal: background location tracking on Android – 25’000€

Currently, QField requires users to keep their devices’ screen on and have the app in the foreground to keep track of the device’s positioning location. On mobile devices, this can drain batteries faster than many would want to, in environments where charging options are limited.

This crowdfunding aims at removing this constraint and allow QField – via a background service – to constantly keep tracking location even while the device is suspended (i.e., when the screen is turned off / locked). 

To achieve this, a significant amount of work is required as the positioning framework on Android will need to be relocated to a dedicated background service. Recent work we’ve done adding a background service to synchronize captured image attachments in QFieldCloud projects armed us with the assurances that we can achieve our goal while giving us an appreciation of the large amount of work needed.

Some of the benefits

Running out of battery is the nightmare of most field surveyors. By moving location tracking to a background service, users will be able to improve their battery life considerably and keep focusing on their tasks even if it involves switching to a different app.

Furthermore, while OPENGIS.ch ninjas remain busy squashing reported QField crashes all year long, there will always be unexpected scenarios leading to abrupt app shutdowns, such as third-party apps, systems running out of battery, etc. To address this, the background service framework will also act as a safeguard to avoid location data loss when QField unexpectedly shuts down and offer users means to recover that data upon re-opening QField.

Stretch goal 1: background navigation audio feedback 5’000€

The second stretch goal builds onto QField’s nice fly-to-point navigation system. If the QField community meets this threshold, a new background navigation audio feedback informing users in the field of their proximity to their target will be implemented. 

The audio feedback will use text-to-speech technology to state the distance to target in meters for a given time or distance interval.

Stretch goal 2: iOS 15’000€

The main goal will cover the Android implementation only. Due to being a very low level work we will have to replicate the work for each platform we support. If we reach stretch goal 2 we will also implement this for iOS.

Pledge now:

In case you do not see the embedded form you can open it directly here.

Thanks for supporting our crowdfunding and keep an eye on our blog for updates on the status.

Plugin Update May 2023

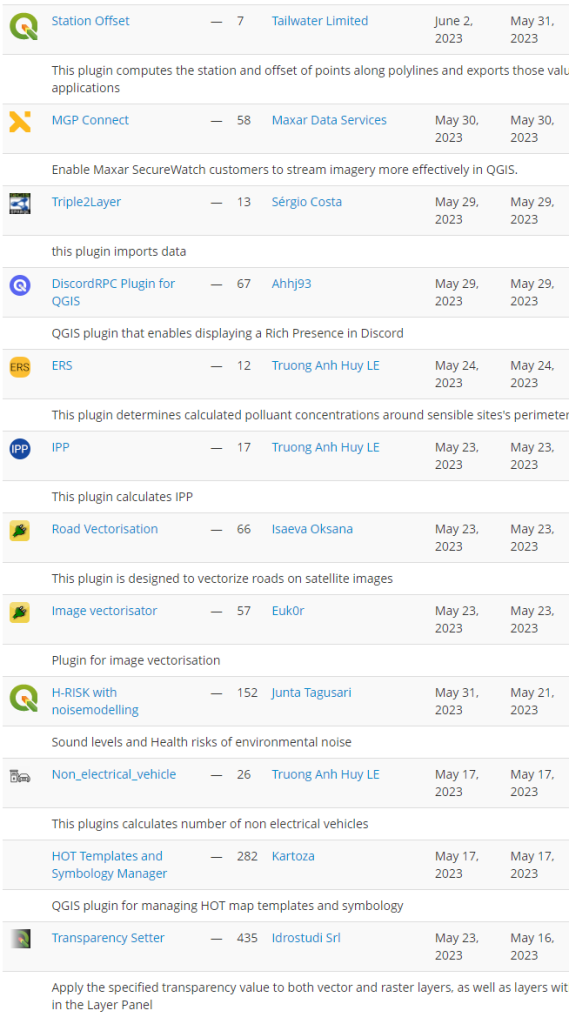
In May 22 new plugins that have been published in the QGIS plugin repository.

Here’s the quick overview in reverse chronological order. If any of the names or short descriptions piques your interest, you can find the direct link to the plugin page in the table below the screenshot.

Station Offset
This plugin computes the station and offset of points along polylines and exports those values to csv for other applications
MGP Connect
Enable Maxar SecureWatch customers to stream imagery more effectively in QGIS.
Triple2Layer
this plugin imports data
DiscordRPC Plugin for QGIS
QGIS plugin that enables displaying a Rich Presence in Discord
ERS
This plugin determines calculated polluant concentrations around sensible sites’s perimeters
IPP
This plugin calculates IPP
Road Vectorisation
This plugin is designed to vectorize roads on satellite images
Image vectorisator
Plugin for image vectorisation
H-RISK with noisemodelling
Sound levels and Health risks of environmental noise
Non_electrical_vehicle
This plugins calculates number of non electrical vehicles
HOT Templates and Symbology Manager
QGIS plugin for managing HOT map templates and symbology
Transparency Setter
Apply the specified transparency value to both vector and raster layers, as well as layers within the selected groups in the Layer Panel
DBGI
Creates geopackages that match the requirements for the DBGI project
StyleLoadSave
Load or Save active vector layer style
PixelCalculator
Interactively calculate the mean value of selected pixels of a raster layer.
GISTDA sphere basemap
A plugin for adding base map layers from GISTDA sphere platform (https://sphere.gistda.or.th/).
Adjust Style
Adjust the style of a map with a few clicks instead of altering every single symbol (and symbol layer) for many layers, categories or a number of label rules. A quick way to adjust the symbology of all layers (or selected layers) consistantly, to check out how different colors / stroke widths / fonts work for a project, and to save and load styles of all layers – or even to apply styles to another project. With one click, it allows to: adjust color of all symbols (including color ramps and any number of symbol layers) and labels using the HSV color model (rotate hue, change saturation and value); change line thickness (i.e. stroke width of all symbols / symbol borders); change font size of all labels; replace a font family used in labels with another font family; save / load the styles of all layers at once into/from a given folder.
APLS
This plugin performs Average Path Length Similarity
qaequilibrae
Transportation modeling toolbox for QGIS
QGPT Agent
QGPT Agent is LLM Assistant that uses openai GPT model to automate QGIS processes
FuzzyJoinTables
Join tables using min Damerau-Levenshtein distance
Chandrayaan-2 IIRS
Generates reflectance from Radiance data of Imaging Infrared Spectrometer sensor of Chandrayaan 2

QGIS Grant Programme 2023 Results

We are extremely pleased to announce the 4 winning proposals for our 2023 QGIS.ORG grant programme:

Funding for the programme was sourced by you, our project donors and sponsorsNote: For more context surrounding our grant programme, please see: QGIS Grants #8: Call for Grant Proposals 2023.

The QGIS.ORG Grant Programme aims to support work from our community that would typically not be funded by client/contractor agreements. This means that we did not accept proposals for the development of new features. Instead proposals focus on infrastructure improvements and polishing of existing features.

Voting to select the successful projects was carried out by our QGIS Voting Members. Each voting member was allowed to select up to 6 proposals. The full list of votes are available here (on the first sheet). The following sheets contain the calculations used to determine the winner (for full transparency). The table below summarizes the voting tallies for the proposals:

A couple of extra notes about the voting process:

  • Voting was carried out based on the technical merits of the proposals and the competency of the applicants to execute on these proposals.
  • No restrictions were in place in terms of how many proposals could be submitted per person / organization, or how many proposals could be awarded to each proposing person / organization.
  • Voting was ‘blind’ (voters could not see the existing votes that had been placed).

We received 35 votes from 20 community representatives and 15 user group representatives.

On behalf of the QGIS.ORG project, I would like to thank everyone who submitted proposals for this call!

2.8.3 - Insightful Indri

Changes

✨ Improvements

  • File association to support opening .mbtiles standalone datasets

🐛 Bug Fixes

  • Fix a narrow scenario when checkbox editor widget fails to toggle to False
  • Fix compass direction not pointing towards north for a number of CRSes
  • Fix copying of bookmark details into the clipboard

2.8.0 - Insightful Indri

Changes

28_highlights

🚀 Features

  • Sensors data handling (reading, writing to feature, tracking) within QField
  • Skip the welcome screen and jump right into your last opened - or user-specified - project when launching QField
  • Functionality to log NMEA streams to text field
  • IMU correction for supported Happy GNSS devices
  • Global map shading rendering support

✨ Improvements

  • Greatly improved feature search for the value relation editor widget
  • Draw in the bottom navigation bar when set to gesture mode
  • Handle opening of individual datasets with mixed geometry layers
  • Feature lists are now sorted, everywhere

‘Add to Felt’ QGIS Plugin

The gift economy of Open Source is community driven and filled by folks with ideas that just go for it!

We at North Road are blessed that we get to join these creatives on their journey in order to get their products to you. Recently, the first QGIS flagship sponsor, Felt, engaged us to further strengthen their support for the up to 600,000 daily QGIS users to integrate their workflows between QGIS and Felt.

The result is the “Add to Felt” QGIS Plugin, which makes it super-simple to publish your QGIS maps to the Felt platform.

To get started, install the Add to Felt Plugin from the QGIS Plugin manager.

If you don’t have a free Felt account, you’ll need to sign up for one online (or from the Add to Felt plugin itself once you have installed it).

Within QGIS, users can easily publish their maps and layers to Felt. You can either:

  • Publish a single layer by right-clicking the layer and selecting “Share Layer to Felt” from the Export sub-menu
  • Publish your whole QGIS project/map by selecting the Project Menu, Export, “Add to Felt” action

Whilst Felt is loading up your map, you can continue working and it will let you know once your map is ready to open on Felt and share with others.

We are happy to let you know that the collaboration does not stop there! As with our SLYR tool, there is ongoing development as the requirements of the community and technology grow.  So install the Add to Felt Plugin via the QGIS Plugin manager, and let us know where you want it to go via the Add to Felt GitHub page.

Read more about it here:

Unterstützung für WMTS im QGIS Swiss Locator

Das QGIS swiss locator Plugin erleichtert in der Schweiz vielen Anwendern das Leben dadurch, dass es die umfangreichen Geodaten von swisstopo und opendata.swiss zugänglich macht. Darunter ein breites Angebot an GIS Layern, aber auch Objektinformationen und eine Ortsnamensuche.

Dank eines Förderprojektes der Anwendergruppe Schweiz durfte OPENGIS.ch ihr Plugin um eine zusätzliche Funktionalität erweitern. Dieses Mal mit der Integration von WMTS als Datenquelle, eine ziemlich coole Sache. Doch was ist eigentlich der Unterschied zwischen WMS und WMTS?

WMS vs. WMTS

Zuerst zu den Gemeinsamkeiten: Beide Protokolle – WMS und WMTS – sind dazu geeignet, Kartenbilder von einem Server zu einem Client zu übertragen. Dabei werden Rasterdaten, also Pixel, übertragen. Ausserdem werden dabei gerenderte Bilder übertragen, also keine Rohdaten. Diese sind dadurch für die Präsentation geeignet, im Browser, im Desktop GIS oder für einen PDF Export.

Der Unterschied liegt im T. Das T steht für “Tiled”, oder auf Deutsch “gekachelt”. Bei einem WMS (ohne Kachelung) können beliebige Bildausschnitte angefragt werden. Bei einem WMTS werden die Daten in einem genau vordefinierten Gitternetz — als Kacheln — ausgeliefert. 

Der Hauptvorteil von WMTS liegt in dieser Standardisierung auf einem Gitternetz. Dadurch können diese Kacheln zwischengespeichert (also gecached) werden. Dies kann auf dem Server geschehen, der bereits alle Kacheln vorberechnen kann und bei einer Anfrage direkt eine Datei zurückschicken kann, ohne ein Bild neu berechnen zu müssen. Es erlaubt aber auch ein clientseitiges Caching, das heisst der Browser – oder im Fall von Swiss Locator QGIS – kann jede Kachel einfach wiederverwenden, ganz ohne den Server nochmals zu kontaktieren. Dadurch kann die Reaktionszeit enorm gesteigert werden und flott mit Applikationen gearbeitet werden.

Warum also noch WMS verwenden?

Auch das hat natürlich seine Vorteile. Der WMS kann optimierte Bilder ausliefern für genau eine Abfrage. Er kann Beispielsweise alle Beschriftungen optimal platzieren, so dass diese nicht am Kartenrand abgeschnitten sind, bei Kacheln mit den vielen Rändern ist das schwieriger. Ein WMS kann auch verschiedene abgefragte Layer mit Effekten kombinieren, Blending-Modi sind eine mächtige Möglichkeit, um visuell ansprechende Karten zu erzeugen. Weiter kann ein WMS auch in beliebigen Auflösungen arbeiten (DPI), was dazu führt, dass Schriften und Symbole auf jedem Display in einer angenehmen Grösse angezeigt werden, währenddem das Kartenbild selber scharf bleibt. Dasselbe gilt natürlich auch für einen PDF Export.

Ein WMS hat zudem auch die Eigenschaft, dass im Normalfall kein Caching geschieht. Bei einer dahinterliegenden Datenbank wird immer der aktuelle Datenstand ausgeliefert. Das kann auch gewünscht sein, zum Beispiel soll nicht zufälligerweise noch der AV-Datensatz von gestern ausgeliefert werden.

Dies bedingt jedoch immer, dass der Server das auch entsprechend umsetzt. Bei den von swisstopo via map.geo.admin.ch publizierten Karten ist die Schriftgrösse auch bei WMS fix ins Kartenbild integriert und kann nicht vom Server noch angepasst werden.

Im Falle von QGIS Swiss Locator geht es oft darum, Hintergrundkarten zu laden, z.B. Orthofotos oder Landeskarten zur Orientierung. Daneben natürlich oft auch auch weitere Daten, von eher statischer Natur. In diesem Szenario kommen die Vorteile von WMTS bestmöglich zum tragen. Und deshalb möchten wir der QGIS Anwendergruppe Schweiz im Namen von allen Schweizer QGIS Anwender dafür danken, diese Umsetzung ermöglicht zu haben!

Der QGIS Swiss Locator ist das schweizer Taschenmesser von QGIS. Fehlt dir ein Werkzeug, das du gerne integrieren würdest? Schreib uns einen Kommentar!

Webinar: Processing LiDAR data in QGIS 3.32

Join this webinar to learn more about the new features in QGIS to process LiDAR data:

Date: Monday, June 26, 2023 at 14:00 GMT

Duration: 30 minutes + 15 minutes Q&A session

Speaker: Martin Dobias, CTO at Lutra Consulting with more than 15 years of QGIS development experience

Martin Dobias

Description

Point clouds are an increasingly popular data type thanks to the decreasing cost of their acquisition through lidar surveys and photogrammetry. On top of that, more and more national mapping agencies release high resolution point cloud data (spanning large areas and consisting of billions of points), unlocking many new use cases.

This webinar will summarize the latest QGIS release 3.32 and the addition of tools for point cloud analysis right from QGIS Processing toolbox: clip, filter, merge, export to raster, extract boundaries and more - all backed by PDAL library that already ships with QGIS, without having to rely on third party proprietary software.

This work was made possible by the generous donations to our crowdfunding.

Live on Monday, June 26, 2023 at 14:00 GMT

Add it to your calendar!

2.8.2 - Insightful Indri

Changes

🐛 Bug Fixes

  • Fix occasional crash on exit which would leave temporary geopackage files (.wal) behind.

Virtual Point Clouds (VPC)

As a part of our crowdfunding campaign we have introduced a new method to handle a large number of point cloud files. In this article, we delve into the technical details of the new format, rationale behind our choice and how you can create, view and process virtual point cloud files.

Rationale

Lidar surveys of larger areas are often multi-terabyte datasets with many billions of points. Having such large datasets represented as a single point cloud file is not practical due to the difficulties of storage, transfer, display and analysis. Point cloud data are therefore typically stored and distributed split into square tiles (e.g. 1km x 1km), each tile having a more manageable file size (e.g. ~200 MB when compressed).

Tiling of data solves the problems with size of data, but it introduces issues when processing or viewing an area of interest that does not fit entirely into a single tile. Users need to develop workflows that take into account multiple tiles and special care needs to be taken to deal with data near edges of tiles to avoid unwanted artefacts in outputs. Similarly, when viewing point cloud data, it becomes cumbersome to load many individual files and apply the same symbology.

Here is an example of several point cloud tiles loaded in QGIS. Each tile is styled based on min/max Z values of the tile, creating visible artefacts on tile edges. The styling has to be adjusted for each layer separately:
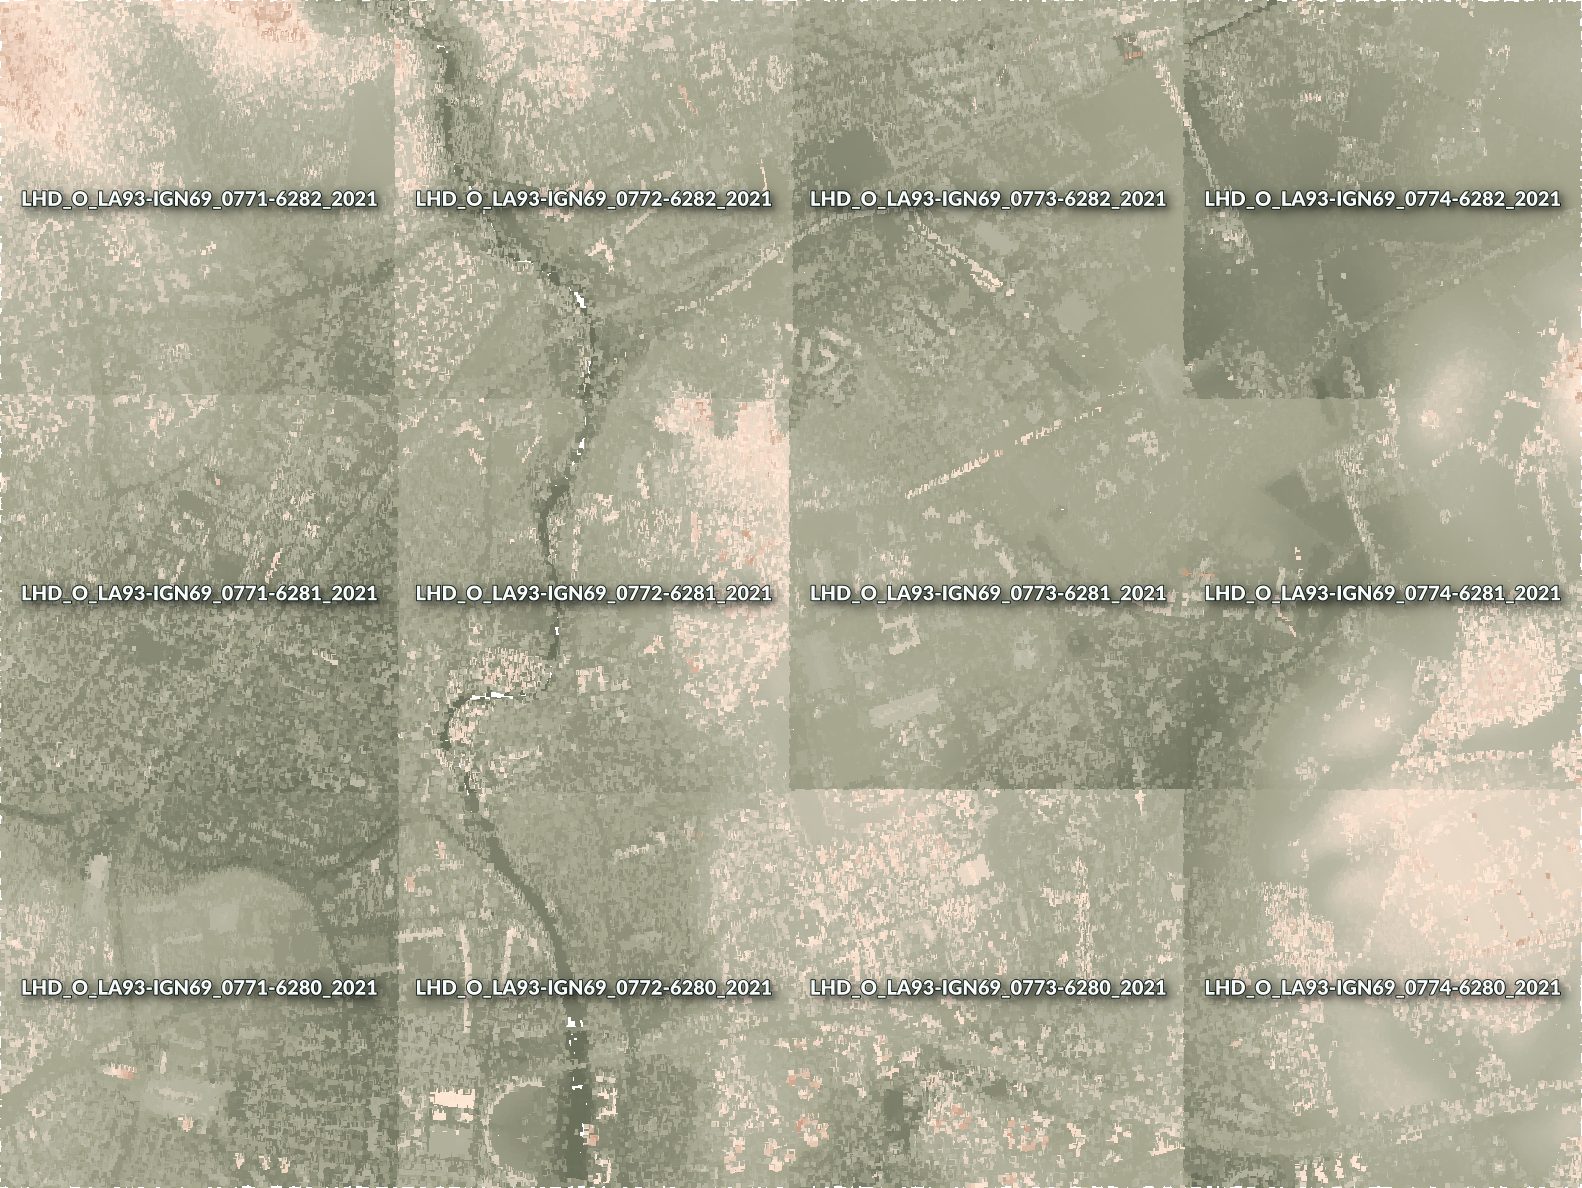
An example of individual point cloud tiles loaded in QGIS, each styled differently

Virtual Point Clouds

In the GIS world, many users are familiar with the concept of virtual rasters. A virtual raster is a file that simply references other raster files with actual data. In this way, GIS software then treats the whole dataset comprising many files as a single raster layer, making the display and analysis of all the rasters listed in the virtual file much easier.

Borrowing the concept of virtual rasters from GDAL, we have introduced a new file format that references other point cloud files - and we started to call it virtual point cloud (VPC). Software supporting virtual point clouds handles the whole tiled dataset as a single data source.

At the core, a virtual point cloud file is a simple JSON file with .vpc extension, containing references to actual data files (e.g. LAS/LAZ or COPC files) and additional metadata extracted from the files. Even though it is possible to write VPC files by hand, it is strongly recommended to create them using an automated tool as described later in this post.

On a more technical level, a virtual point cloud file is based on the increasingly popular STAC specification (the whole file is a STAC API ItemCollection). For more details, please refer to the VPC specification that also contains best practices and optional extensions (such as overviews).

Virtual Point Clouds in QGIS

We have added support for virtual point clouds in QGIS 3.32 (released in June 2023) thanks to the many organisations and individuals who contributed to our last year’s joint crowdfunding with North Road and Hobu. The support in QGIS consists of three parts:

  1. Create virtual point clouds from a list of individual files
  2. Load virtual point clouds as a single map layer
  3. Run processing algorithms using virtual point clouds

Those who prefer using command line tools, PDAL wrench includes a build_vpc command to create virtual point clouds, and all the other PDAL wrench commands support virtual point clouds as the input.

Using Virtual Point Clouds

In this tutorial, we are going to generate a VPC using the new Processing algorithm, load it in QGIS and then generate a DTM from terrain class. You will need QGIS 3.32 or later for this. For the purpose of this example, we are using the LiDAR data provided by the IGN France data hub.

In QGIS, open the Processing toolbox panel, search for the Build virtual point cloud (VPC) algorithm ((located in the Point cloud data management group):
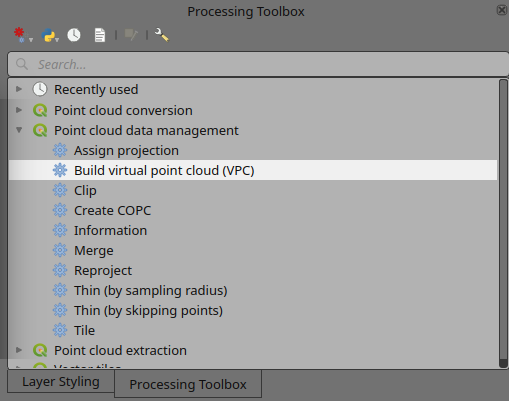
VPC in the Processing toolbox

VPC algorithm in the Processing toolbox

In the algorithm’s window, you can add point cloud layers already loaded in QGIS or alternatively point it to a folder containing your LAZ/LAS files. It is recommended to also check the optional parameters:

  • Calculate boundary polygons - QGIS will be able to show the exact boundaries of data (rather than just rectangular extent)

  • Calculate statistics - will help QGIS to understand ranges of values of various attributes

  • Build overview point cloud - will also generate a single “thinned” point cloud of all your input data (using only every 1000th point from original data). The overview point cloud will be created next to the VPC file - for example, for mydata.vpc, the overview point cloud would be named mydata-overview.copc.laz
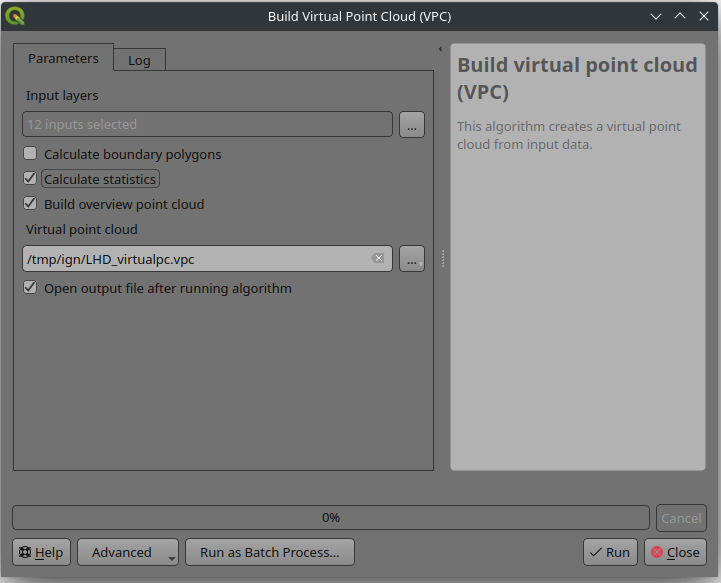
VPC algorithm inputs, outputs and options

VPC algorithm inputs, outputs and options

After you set the output file and start the process, you should end up with a single VPC file referencing all your data. If you leave the optional parameters unchecked, the VPC file will be built very quickly as the algorithm will only read metadata of input files. With any of the optional parameters set, the algorithm will read all points which can take some time.

Now you can load the VPC file in QGIS as any other layer - using QGIS browser, Data sources dialog in QGIS or by doing drag&drop from a file browser. After loading a VPC in QGIS, the 2D canvas will show boundaries of individual files - and as you zoom in, the actual point cloud data will be shown. Here, a VPC loaded together with the overview point cloud:
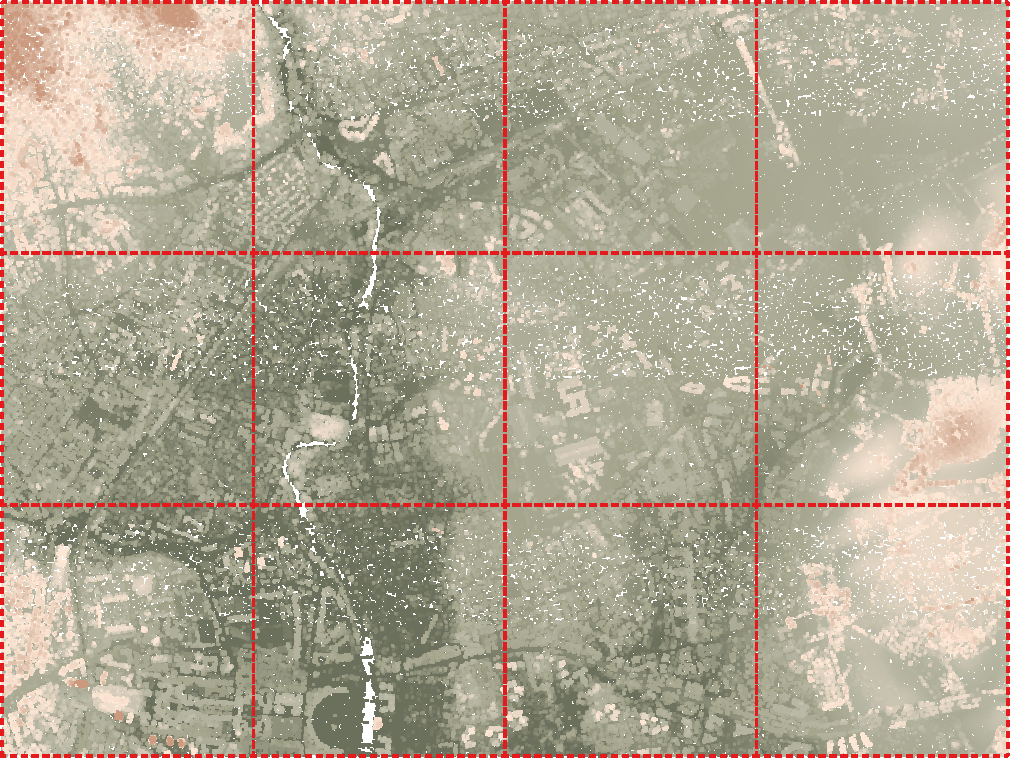
VPC algorithm output

Virtual point cloud (thinned version) generated by the VPC algorithm

Zooming in QGIS in 2D map with elevation shading - initially showing just the overview point, later replaced by the actual dense point cloud:
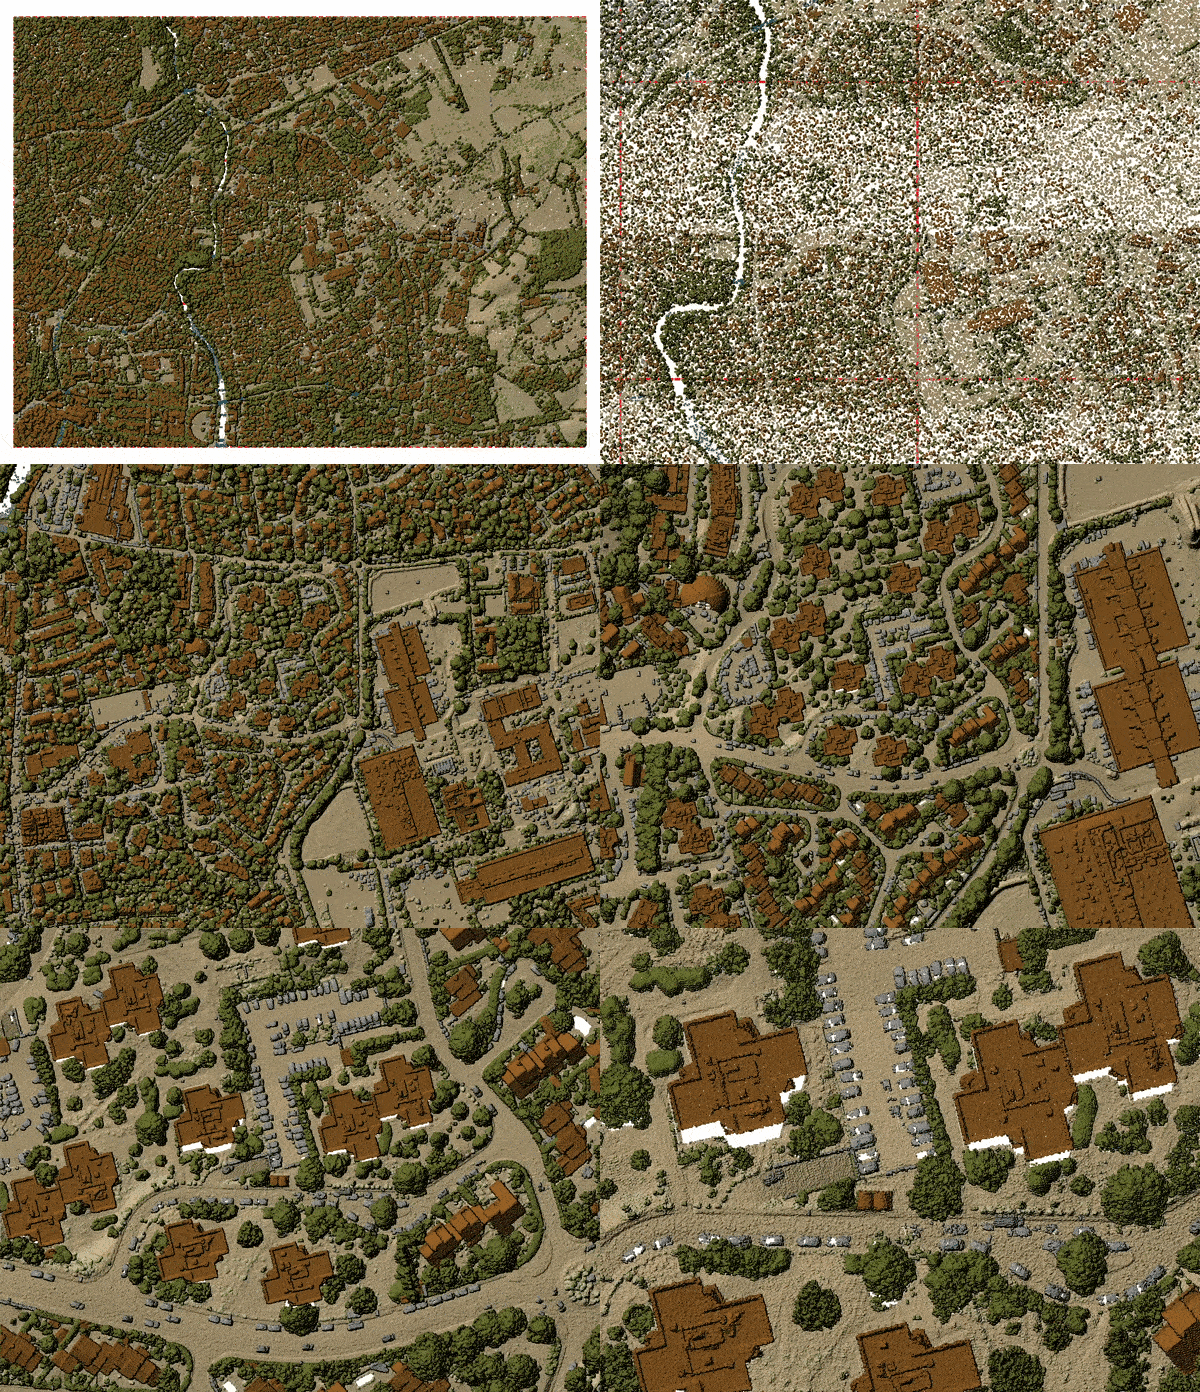
VPC algorithm output in 2D maps

VPC output on 2D: displaying details when zooming in

In addition to 2D maps, you can view the VPC in a 3D map windows too:

If the input files for VPCs are not COPC files, QGIS will currently only show their boundaries in 2D and 3D views, but processing algorithms will work fine. It is however possible to use the Create COPC algorithm to batch convert LAS/LAZ files to COPC files, and then load VPC with COPC files.

It is also worth noting that VPCs also work with input data that is not tiled - for example, in some cases the data are distributed as flightlines (with lots of overlaps between files). While this is handled fine by QGIS, for the best performance it is generally recommended to first tile such datasets (using the Tile algorithm) before doing further display and analysis.

Processing Data with Virtual Point Clouds

Now that we have the VPC generated, we can run other processing algorithms. For this example, we are going to convert the ground class of the point cloud to a digital terrain model (DTM) raster. In the QGIS Processing toolbox, search for Export to raster algorithm (in the Point cloud conversion group):
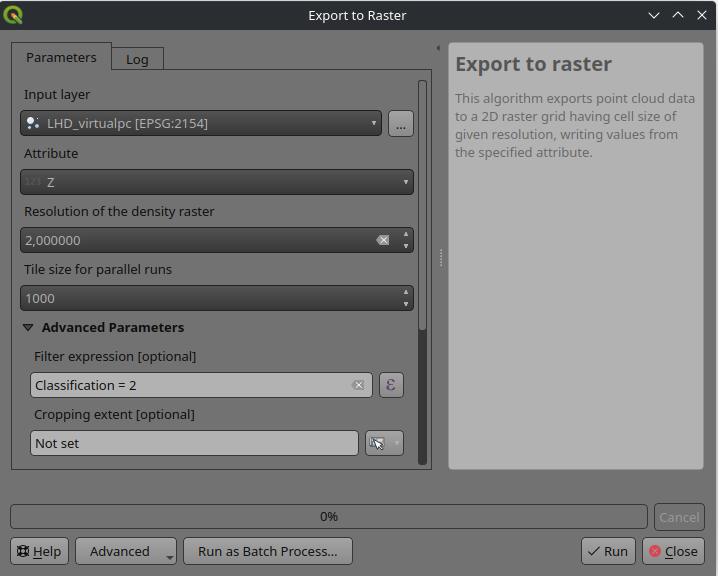
VPC as an input to processing algorithms

VPC layer can be used as an input to the point cloud processing algorithm

This will use the Z values from the VPC layer and generate a terrain raster based on a user defined resolution. The algorithm will process the tiles in parallel, taking care of edge artefacts (at the edges, it will read data also from the neighbouring tiles). The output of this algorithm will look like this:
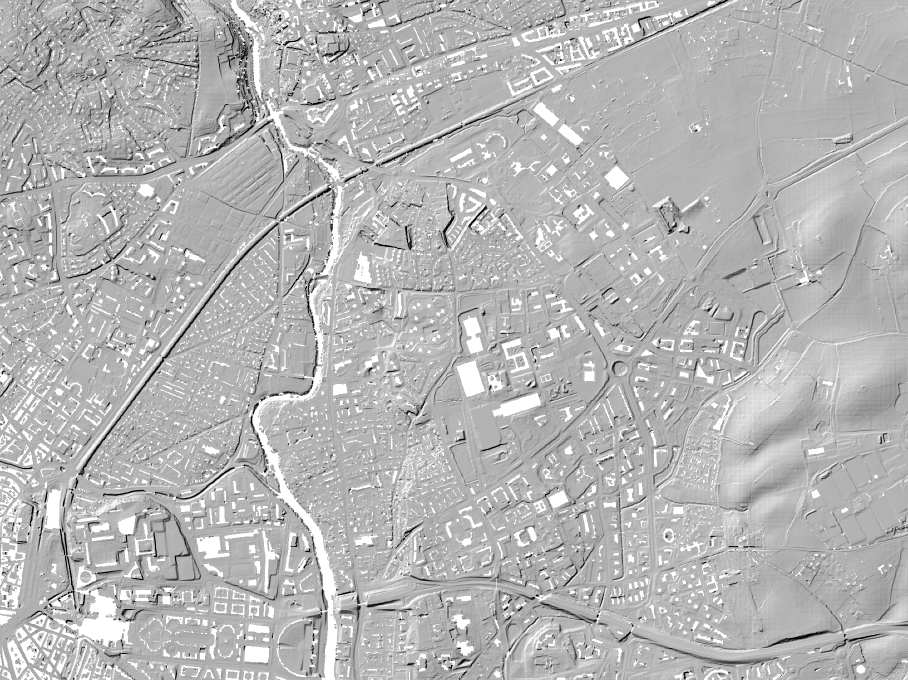
Converting a VPC layer to a raster

Converting a VPC layer to a DTM

The output raster contains holes where there were no points classified as ground. If needed for your use case, you can fill the holes using Fill nodata algorithm from GDAL in the Processing toolbox and create a smooth terrain model for your input Virtual Point Cloud layer:
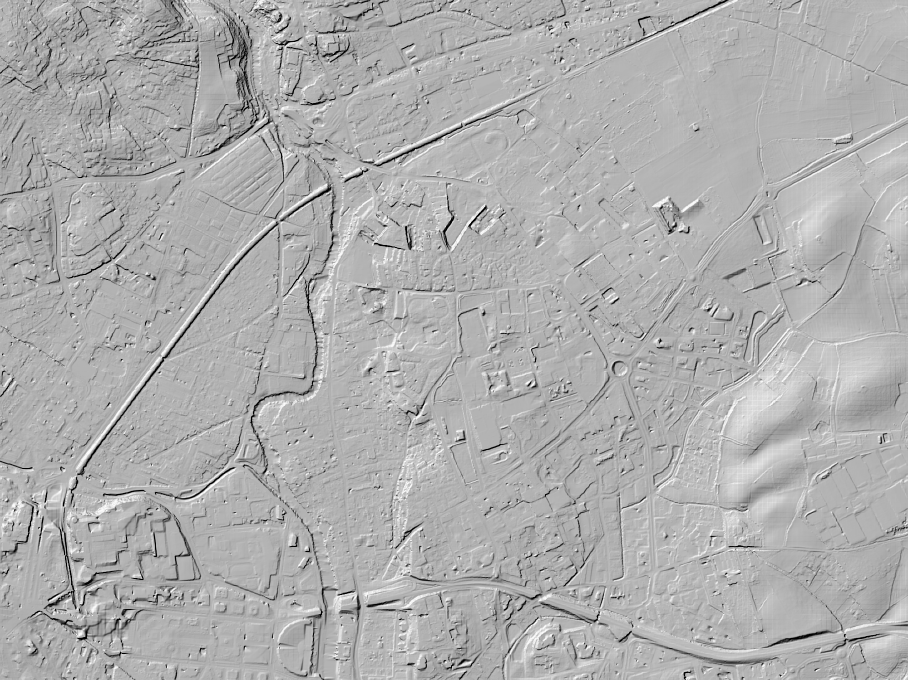
Filling the holes in the DTM

Filling the holes in the DTM

Virtual point clouds can be used also for any other algorithms in the point cloud processing toolbox. For more information about the newly introduced algorithms, please see our previous blog post.

All of the point cloud algorithms also allow setting filtering extent, so even with a very large VPC, it is possible to run algorithms directly on a small region of interest without having to create temporary point cloud files. Our recommendation is to have input data ready in COPC format, as this format provides more efficient access to data when spatial filtering is used.

Streaming Data from Remote Sources with VPCs

One of the very useful features of VPCs is that they work not only with local files, but they can also reference data hosted on remote HTTP servers. Paired with COPCs, point cloud data can be streamed to QGIS for viewing and/or processing - that means QGIS will only download small portions of data of a virtual point cloud, rather than having to download all data before they could be viewed or analysed.

Using IGN’s lidar data provided as COPC files, we have built a small virtual point cloud ign-chambery.vpc referencing 16 km2 of data (nearly 700 million points). This VPC file can be loaded in QGIS and used for 2D/3D visualisation, elevation profiles and processing, with QGIS handling data requests to the server as necessary. Processing algorithms only take a couple of seconds if the selected area of interest is small (make sure to set the “Cropping extent” parameter of algorithms).

All this greatly simplifies data access to point clouds:

  • Data producers can use very simple infrastructure - a server hosting static COPC files together with a single VPC file referencing those COPC files.

  • Users can use QGIS to view and process point cloud data as a single map layer, with no need to download large amounts of data, QGIS (and PDAL) taking care of streaming data as needed.

We are very excited about the opportunities that virtual point clouds are bringing to users, especially when combined with COPC format and access from remote servers!

Thanks again to all contributors to our crowdfunding campaign - without their generous support, this work would not have been possible.

Contact us if you would like to add more features in QGIS to handle, analyse or visualise lidar data.

Cesium Ecosystem Grant Win for QGIS 3D Tiles!

Success! Lutra and North Road have been rewarded a Cesium Ecosystem Grant to provide access to 3D tiles within QGIS. We will be creating the ability for users to visualise 3D Tiles in QGIS alongside other standard geospatial sources in both 3D and 2D map views.
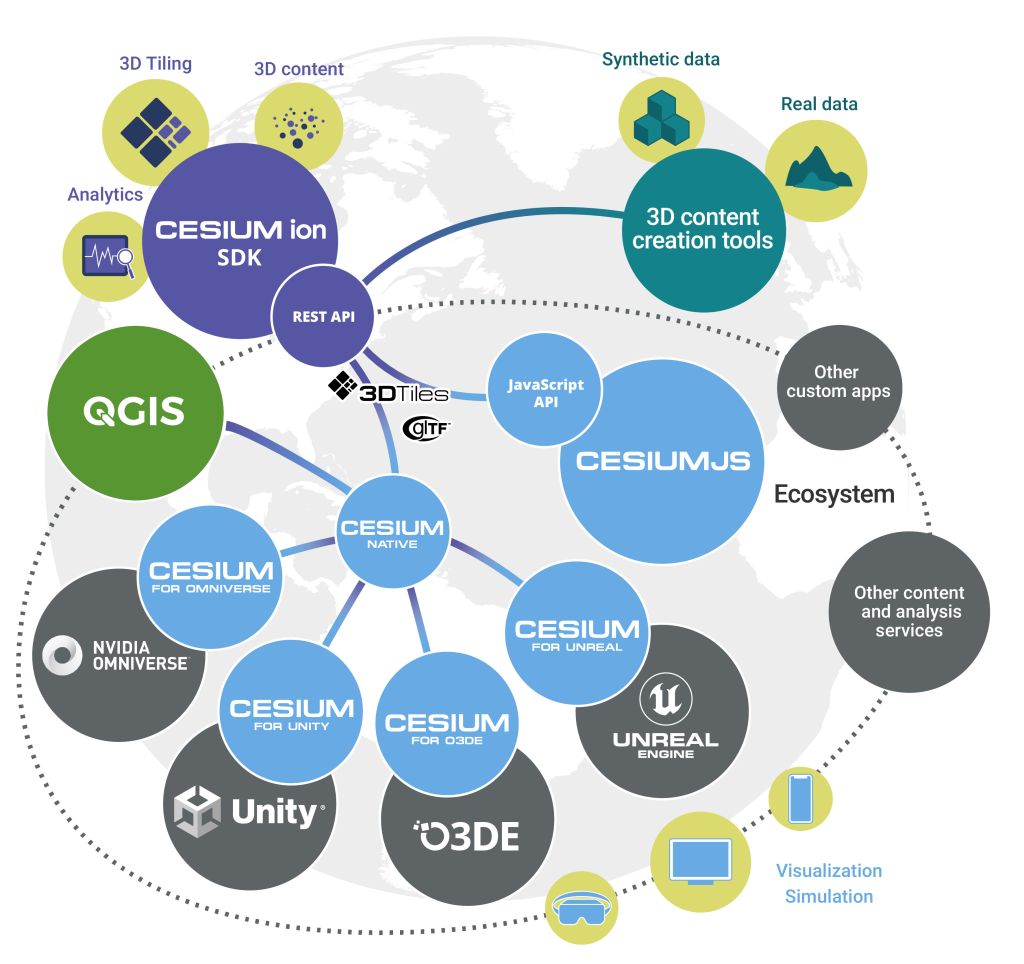
3D Tiles Cesium integration ecosystem diagram
3D Tiles Cesium integration ecosystem
We are very excited about it, but to be included in the first cohort of awardees is also an added honour! We share this distinction with 3 other recipients:
The opportunity was brought to our attention by our friends over at Nearmap, which, along with the existence of this grant, shows how the geospatial community is working together by evolving the Open Source Economy. A movement close to our hearts and our core business. Working between commercial software and open-source, Cesium’s business model recognises the legitimacy of Open Source Software for use as a geospatial standard operating procedure by promoting openness and interoperability.
Our team of Nyall Dawson and Martin Dobias will create a new layer type, QgsTiledMeshLayer, allowing for direct access to Cesium 3D tile sources alongside the other supported geospatial layer types within QGIS. This will include visualisation of the tile data in both 3D and 2D map views (feature footprints). It will fulfill a critical need for QGIS users, permitting access to 3d data provided by their respective government agencies to work alongside all their other standard geospatial layers (vector, raster, point clouds). By making 3D Tiles a first class citizen in QGIS we help strengthen the case that those agencies should be providing their data in the Cesium format (as opposed to any proprietary alternatives).
Proposed Technical Architecture Cesium QGIS
Proposed Technical Architecture for Cesium 3D Tiles in QGIS
Here’s a breakdown of what we will be doing:
  • Develop a new QGIS layer type “QgsTiledMeshLayer”
  • Develop a parser for 3D Tiles format, supporting Batched 3D Model (with a reasonable set of glTF 2.0 features)
  • Develop a 3D renderer which dynamically loads and displays features from 3D Tiles based on appropriate 3D view level of detail. (A similar approach has already been implemented in QGIS for optimised viewing of point cloud data).
  • Develop a 2D renderer for 3D Tiles, which will display the footprints of 3D tile features in 2D QGIS map views. Just like the 3D renderer, the 2D renderer will utilise map scale information to dynamically load 3D tiles and display a suitable level of detail for the footprints.
  • Users will have full control over the appearance of the 2D footprints, with support for all of QGIS’ extensive polygon symbology options.
  • By permitting users to view the 2D footprints of features, we will promote use of Cesium 3D Tiles as a suitable source of cartographic data, eg display of authoritative building footprints supplied by government agencies in the Cesium 3D Tile format.

Through past partnerships, North Road and Lutra Consulting have developed and extended the 3D mapping functionality of QGIS. To date, all the framework for mature, performant 3D scenes including vector, mesh, raster and point cloud sources are in place. We are now ready to extend the existing functionality with Cesium 3D tiles support as QGIS 3D engine already implements most of the required concepts, such as out of core rendering and hierarchical level of detail (tested with point clouds with billions of points).

So there we go! Working together collaboratively with Lutra Consulting on another great addition to QGIS 3D Functionality thanks to Cesium Ecosystem Grants. Stay tuned on our social channels to find out when it will be released in QGIS.

Cesium Ecosystem grant Badge


Native point cloud processing in QGIS

After the addition of support for visualising point clouds in the recent versions of QGIS, the next step was to add the processing tools so users can manage and analyse their data.

There are several 3rd party QGIS plugins (either proprietary or not fully open source) which allow users to interrogate and analyse lidar data. But with our latest work, we have introduced powerful point cloud algorithms to the QGIS Processing framework. All the algorithms are available out of the box in QGIS 3.32, with no need to install plugins.

In this blog post, we summarise the initial point cloud algorithms for QGIS Processing toolbox which will be available in QGIS 3.32 (to be released at the end of June 2023). This work was made possible by the generous donations to our crowdfunding.

Point Cloud algorithms in QGIS

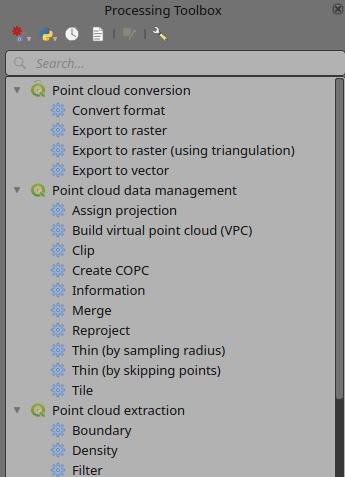
First off a quick look at the new algorithms as shown in the Processing toolbox in three groups:

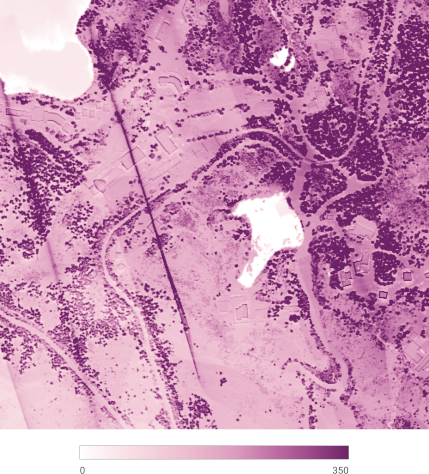
Point Cloud algorithms in QGIS processing toolbox

Point Cloud algorithms in QGIS processing toolbox
  • Convert formats: this will allow you to convert your point cloud data between LAS and LAZ formats for the time being. Other PDAL supported formats can be added later.
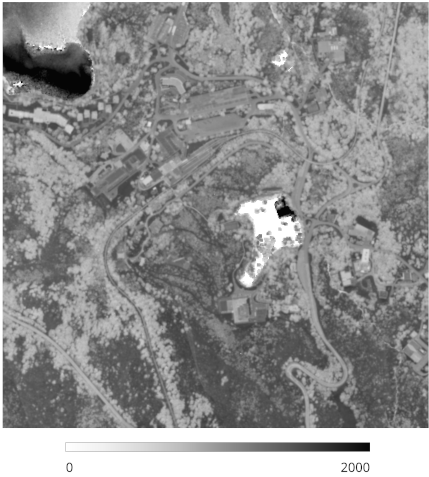
  • Export to raster: with this algorithm you can export point cloud to a regularly gridded raster data. It uses inverse distance weighting to assign raster cell values. Raster cells with no nearby points will get “no data” values (these holes may be removed by using “Fill nodata” raster algorithm).

Input point cloud layer file

Input point cloud layer file

Raster output using Intensity attribute of points

Raster output using Intensity attribute of points
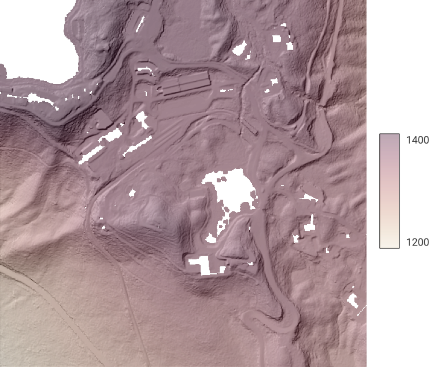
  • Export to raster (using triangulation): this allows you to export Z data to a regularly gridded raster by interpolating between the points using triangulation. Note that this can be slower if you are dealing with a large dataset. If your point cloud is dense, you can export your ground points as a raster using the Export to raster algorithm.

Terrain raster output generated by point cloud triangulation

Terrain raster output generated by point cloud triangulation
  • Export to vector: to export point cloud to other vector formats. This is useful to export some of your data for software applications which do not support point cloud data and still use formats such as CSV, Shapefile, DXF.

Exporting point cloud (ground points) to Shapefile styled based on the elevation

Exporting point cloud (ground points) to Shapefile styled based on the elevation!
  • Assign projection: assigns a projection to a point cloud layer (if it is wrong or missing)
  • Build virtual point cloud (VPC): with this algorithm you can generate a virtual file (based on STAC specification) and load them as a single file in QGIS. There will be a separate blog post detailing this new exciting feature.
  • Clip: clip a point cloud layer by a vector polygon layer.

Input point cloud layer and a polygon coverage

Input point cloud layer and a polygon coverage

Result of the clipping algorithm

Result of the clipping algorithm
  • Create COPC: when you load a non-indexed point cloud layer in QGIS, it will take a while for the application to create the COPC index for your file. With this algorithm, you can create the index for all your files in a batch mode.
  • Information: displays information from a point cloud layer:
LAS           1.4
point format  6
count         56736130
scale         0.001 0.001 0.001
offset        431749.999 5440919.999 968.898
extent        431250 5440420 424.266
              432249.999 5441419.999 1513.531
crs           ETRS89 / UTM zone 34N (N-E) (EPSG:3046)  (vertical CRS missing!)
units         horizontal=metre  vertical=unknown

Attributes:
 - X floating 8
 - Y floating 8
 - Z floating 8
 - Intensity unsigned 2
 - ReturnNumber unsigned 1
 - NumberOfReturns unsigned 1
 - ScanDirectionFlag unsigned 1
 - EdgeOfFlightLine unsigned 1
 - Classification unsigned 1
 - ScanAngleRank floating 4
 - UserData unsigned 1
 - PointSourceId unsigned 2
 - GpsTime floating 8
 - ScanChannel unsigned 1
 - ClassFlags unsigned 1

Output from point cloud information algorithm

  • Merge: join multiple point cloud layers into a single file
  • Reproject: reproject the input file to a different coordinate reference system
  • Thin (by sampling radius): reduces the number of points within a certain radius

Thining point cloud (by sampling radius)

Thining point cloud (by sampling radius)
  • Thin (by skipping points): reduces the number of points by skipping nearby points
  • Tile: this algorithm generates a set of tiles based on the input point cloud layer and tile size
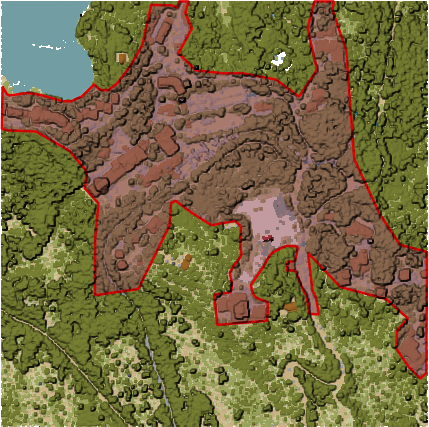
  • Boundary: generates a (multi) polygon from your point cloud data. The output file might contain holes depending on the density of your point cloud input data.
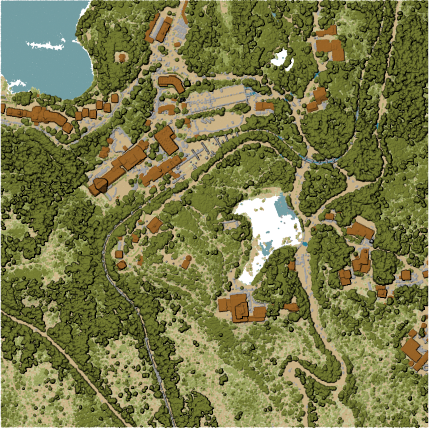
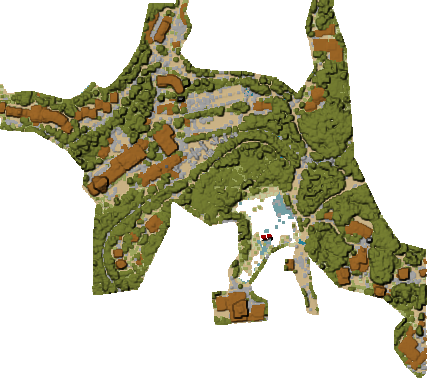
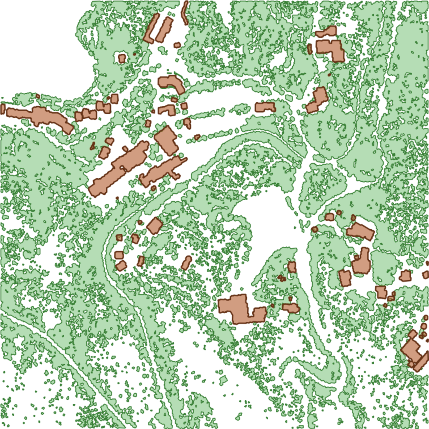
Extracting high vegetation and building polygons from an input point cloud layer

Extracting high vegetation and building polygons from an input point cloud layer
  • Density: outputs a raster file based on the number of points within each raster cell - useful for quality checking of point cloud datasets

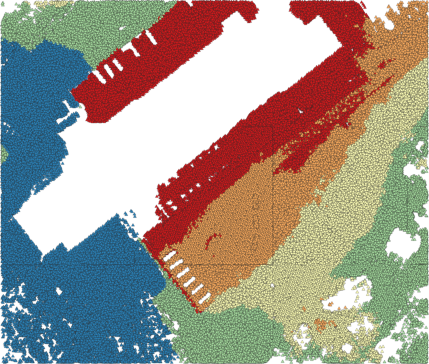
Point density (number of points per 2x2 m)  as a raster

Point density (number of points per 2x2 m) as a raster
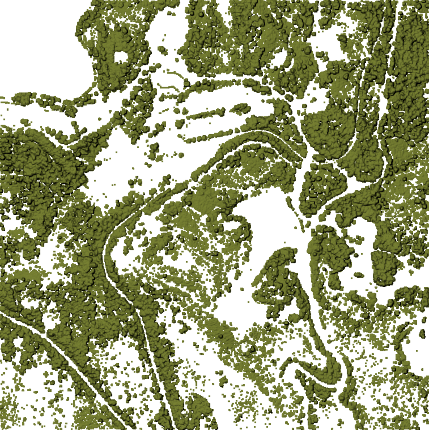
  • Filter: it creates a new file based on the filter set as an expression. Note that most of the algorithms support on-the-fly filtering under the Advanced parameters.
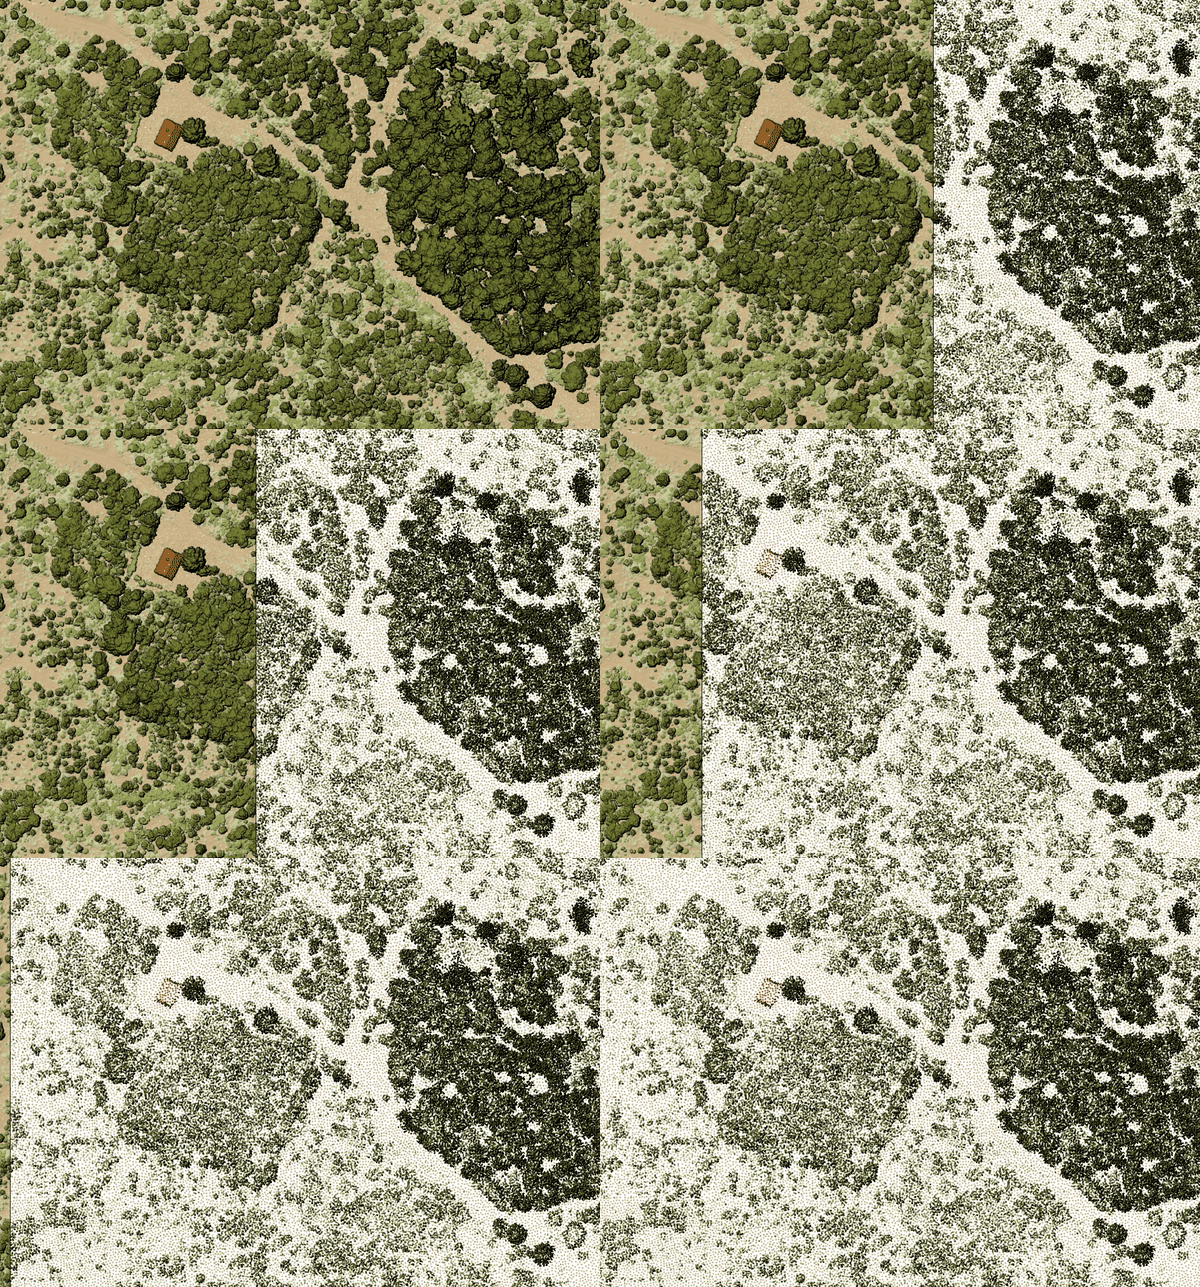
Filtering of high vegetation class from an input point cloud layer

Filtering of high vegetation class from an input point cloud layer

Behind the scenes

All the heavy lifting of the point cloud processing is done by PDAL - a state of the art open source library for processing point clouds. PDAL provides a wide range of “readers”, “filters” and “writers” to build complex pipelines to process point clouds.

We have built a new standalone command line tool pdal_wrench on top of PDAL. It addresses two major issues that non-expert users typically face when working with PDAL:

  • Ease of use: not everyone finds it easy to manually craft JSON files with pipelines, study manuals of the many stages and read details about file formats involved.
  • Parallel execution: PDAL runs pipelines in a single thread, so only one CPU gets to do the work normally and users need to implement their own parallelism if they want to speed up processing.

The command line tool provides a simple set of commands that take care of everything. For example, to export a raster layer with elevations (DEM) with 1 meter resolution:

pdal_wrench to_raster --output=raster.tif --resolution=1 --attribute=Z data.las

The pdal_wrench tool does not depend on QGIS, so it can be easily used separately.

The commands are designed to run in parallel when there are multiple input files or when the input file is in COPC format. Depending on the algorithm, the work gets split spatially into square tiles (1000x1000 map units by default) for parallel processing, or individual files are processed in parallel. With a single ordinary LAS/LAZ file on input, there is currently no parallelism going on.

For commands that are sensitive to edge artifacts (such as export to raster), we take care of processing extra points outside of the extent of each tile (referred to as collar or buffer) to make sure the results are correct as if no tiling would be happening (see Martin Isenburg’s article for more details: https://rapidlasso.com/2015/08/07/use-buffers-when-processing-lidar-in-tiles/).

Future work

The current list of point cloud algorithms already allows users to do plenty of work. But more could be added to the toolbox - algorithms that are already supported by PDAL, but not exposed in QGIS: classification, noise removal, surface reconstruction, clustering, height above ground, colorizing and many more. If you are interested in more point cloud processing algorithms in QGIS, please contact us and we will be happy to add them to future QGIS releases.

SLYR Update — June 2023

Welcome back, SLYR enthusiasts! We’re thrilled to share the latest updates and enhancements for our SLYR ESRI to QGIS Compatibility Suite that will dramatically streamline the use of ESRI documents within QGIS (and vice versa!). Our team has been hard at work, expanding the capabilities of SLYR to ensure seamless compatibility between the latest QGIS and ArcGIS releases. We’ve also got some exciting news for users of the Community Edition of SLYR! Let’s dive right in and explore the exciting new features that have been added to SLYR since our previous update

Converting Raster Layers in Geodatabases

We’re pleased to announce that SLYR now offers support for converting raster layers within Geodatabases. With this update, users can effortlessly migrate their raster data from ESRI’s Geodatabases to QGIS, enabling more efficient data management and analysis.

This enhancement is only possible thanks to work in the fantastic GDAL library which underpins QGIS’ raster data support. Please ensure that you have the latest version of QGIS (3.30.3 or 3.28.7 at a minimum) to make the most of this feature.

Annotation and Graphic Layer Improvements

Text Annotations along Curves

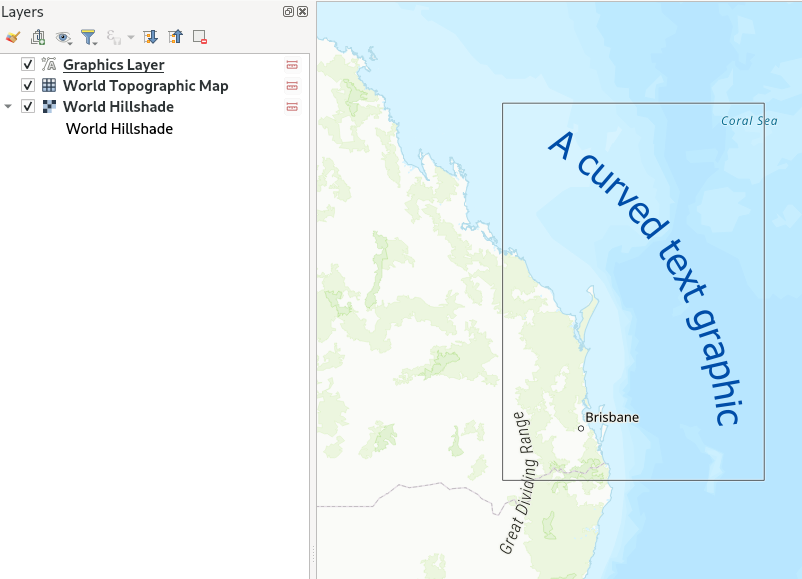
For those working with curved annotations, we’ve got you covered! SLYR now supports the conversion of text annotations along curves in QGIS. With this enhancement, you’ll get accurate conversion of any curved text and text-along-line annotations from MXD and APRX documents. This has been a long-requested feature which we can now introduce thanks to enhancements coming in QGIS 3.32.

ArcGIS Pro Graphics Layer Support

SLYR now supports the conversion of ArcGIS Pro graphics layers, converting all graphic elements to their QGIS “Annotation Layer” equivalents. If you’ve spent hours carefully designing cartographic markup on your maps, you can be sure that SLYR will allow you to re-use this work within QGIS!

Curved text graphic conversion

Enhanced Page Layout Support

We’ve further improved the results of converting ArcGIS Pro page layouts to QGIS print layouts, with dozens of refinements to the conversion results. The highlights here include:

  • Support for converting measured grids and graticules to QGIS map grids
  • Enhanced dynamic text conversions:  Now, when migrating your projects, you can expect a smoother transition for dynamic text ensuring your layouts correctly show generated metadata and text correctly
  • Support for north arrows, grouped elements, legends and table frames.

Rest assured that your carefully crafted map layouts will retain their visual appeal and functionality when transitioning to QGIS!

Improved QGIS to ArcGIS Pro Conversions

SVG Marker Exports and Symbology Size

SLYR has introduced initial support for exporting SVG markers from QGIS to ArcGIS Pro formats. SVG graphics are a component of QGIS’ cartography, and are frequently used to create custom marker symbols. Unfortunately, ArcGIS Pro doesn’t have any native support for SVG graphics for marker symbols, instead relying on a one-off conversion from SVG to multiple separate marker graphics whenever an SVG is imported into ArcGIS Pro. Accordingly, we’ve implemented a similar logic in SLYR in order to convert SVG graphics to ArcGIS Pro marker graphics transparently whenever QGIS symbology is exported to ArcGIS. This enhancement allows for a seamless transfer of symbology from QGIS, ensuring that your converted maps retain their visual integrity.

Furthermore, the update includes support for exporting QGIS symbology sizes based on “map unit” measurements to ArcGIS Pro, resulting in ArcGIS Pro symbology which more accurately matches the original QGIS versions.

Rule-Based Renderer Conversion

The “Rule Based Renderer” is QGIS’ ultimate powerhouse for advanced layer styling. It’s extremely flexible, thanks to its support for nested rules and filtering using QGIS expressions. However, this flexibility comes with a cost — there’s just no way to reproduce the same results within ArcGIS Pro’s symbology options! Newer SLYR releases will now attempt to work around this by implementing basic conversion of QGIS rule-based renderers to ArcGIS Pro layers with “display filters” attached. This allows us to convert some basic rule-based configuration to ArcGIS Pro formats.

There’s some limitations to be aware of:

  1. Only “flat” rule structures can be converted. It’s not possible to convert a nested rule structure into something representable by ArcGIS Pro.
  2. While the QGIS expression language is very rich and offers hundreds of functions for use in expressions, only basic QGIS filter expressions can be converted to ArcGIS Pro rules.

Improved Conversion of Raster and Mesh Layers

Based on user feedback, we’ve made significant improvements to the conversion of QGIS rasters and mesh layers to ArcGIS Pro formats. Expect enhanced accuracy when migrating these types of data, ensuring a closer match between your QGIS projects and their ArcGIS Pro equivalents.

New tools

The latest SLYR release introduces some brand new tools for automating your conversion workflows:

Convert LYR/LYRX Files Directly to SLD

To facilitate interoperability, SLYR has introduced algorithms that directly convert ESRI LYR or LYRX files to the “SLD” format (Styled Layer Descriptor). This feature simplifies the process of sharing and utilizing symbology between different GIS software, allowing for direct conversion of ESRI symbology for use in Geoserver or Mapserver.

Convert File Geodatabases to Geopackage

We’re thrilled to introduce a powerful new tool in SLYR that enables a comprehensive conversion of a File Geodatabase to the Geopackage format. With this feature, you can seamlessly migrate your data from ESRI’s File Geodatabase format to the versatile and widely supported GeoPackage format. As well as the raw data conversion, this tool also ensures the conversion of field domains and other advanced Geodatabase functionality to their GeoPackage equivalent, preserving valuable metadata and maintaining data integrity throughout the transition. (Please note that this tool requires QGIS version 3.28 or later.)


All these exciting additions to SLYR are available today to SLYR license holders. If you’re after one-click, accurate conversion of projects from ESRI to QGIS, contact us to discuss your licensing needs.

As described on our SLYR page, we also provide some of the conversion tools for free use via the SLYR “Community Edition”. We’re proud to announce that we’ve just hit the next milestone in the Community Edition funding, and will now be releasing all of SLYR’s support for raster LYR files to the community edition! This complements the existing support for vector LYR files and ESRI style files available in the community edition. For more details on the differences between the licensed and community editions, see our product comparison.

  • <<
  • Page 11 of 141 ( 2807 posts )
  • >>

Back to Top

Sustaining Members