Related Plugins and Tags

QGIS Planet

Versie 3.5.0 van de PDOKServicesPlugin

OK, this is a short post to let the dutchies know there is a new version 3.5.0 of the PDOKServicesPlugin to load some of our national data as WMS, WFS or WCS. For example: the GeoMorphological map of The Netherlands, or the data of the accidents that happened from 2008 till 2018. Here combined in […]

Overview of QGIS 3.14 Mesh Features

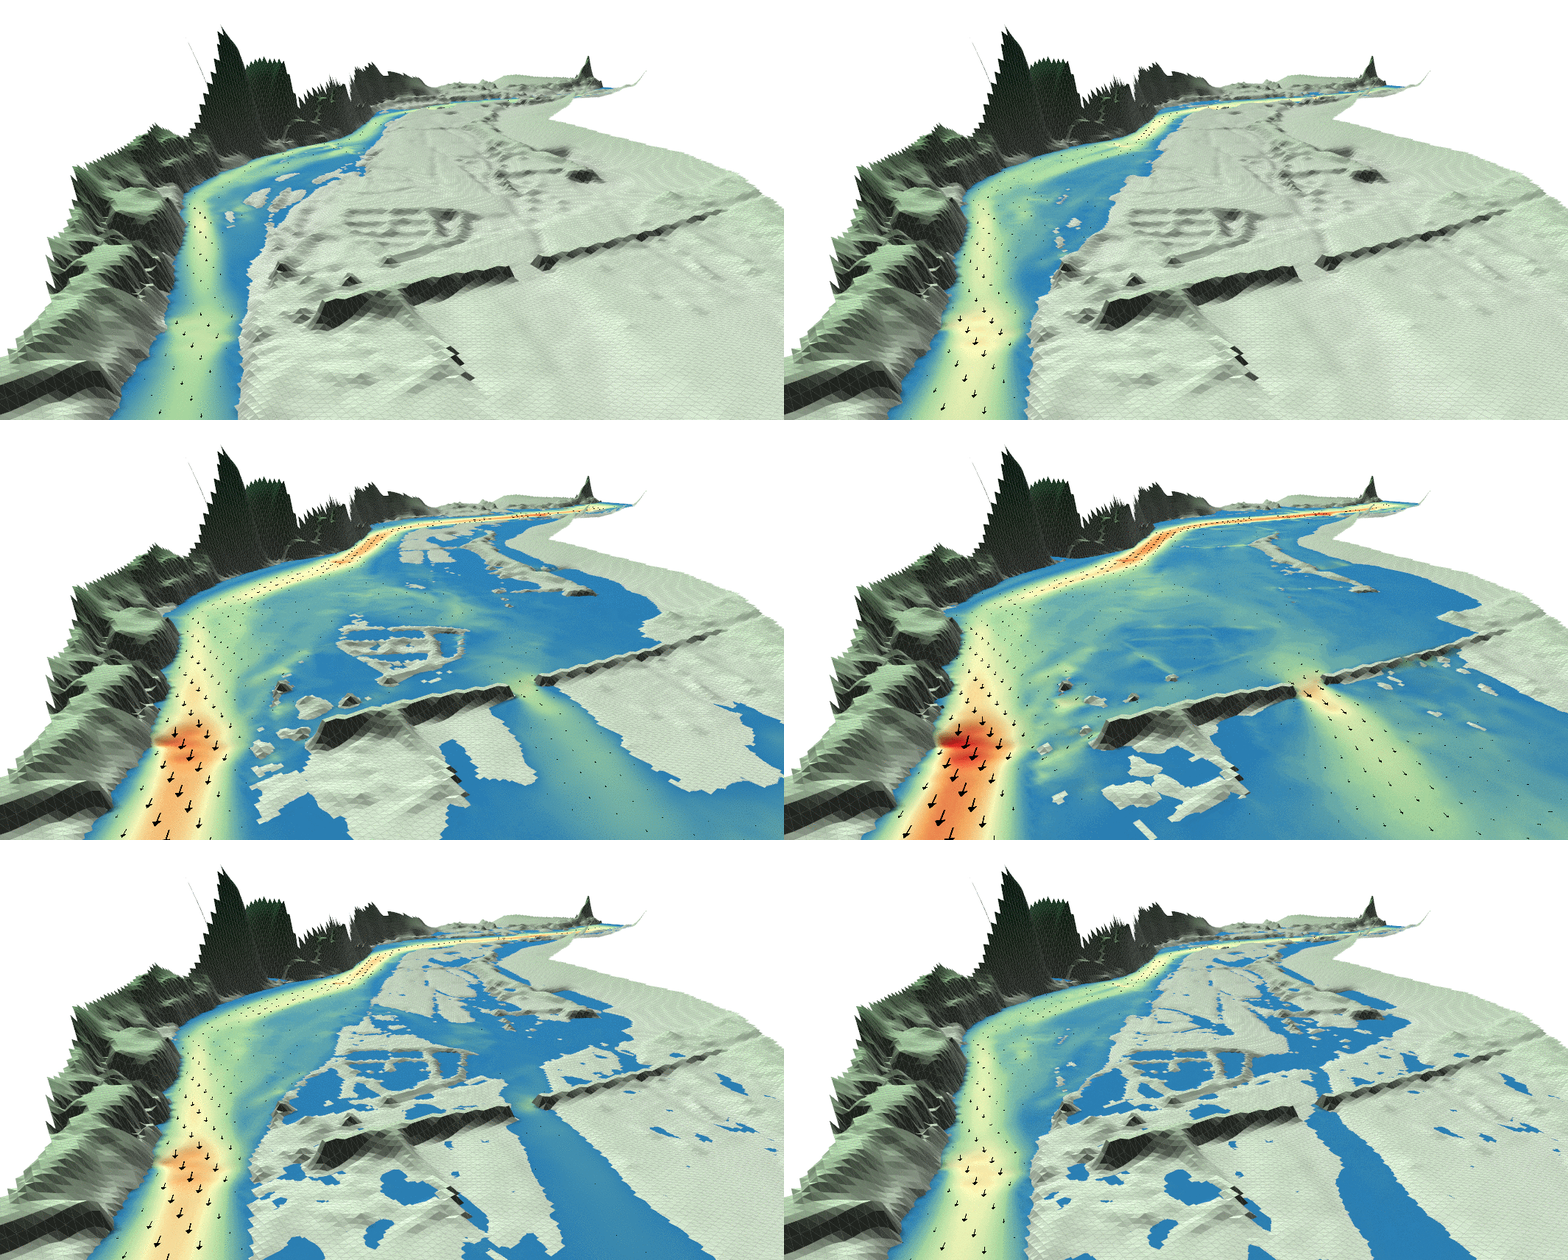
Mesh layer is now supported for the 1D, 2D and 3D data frames. It also comes with integration to the temporal controller in QGIS 3.14.

The releases of QGIS 3.14, MDAL 0.6.1 and Crayfish 3.4.4 are planned for this Friday We are delighted to have made improvements for the upcoming release:

  • full integration with the new temporal controller
  • 1D meshes support (e.g. to support urban drainage system models)
  • New rendering and styling options for mesh layers
  • improving greatly rendering speed for large datasets
  • various other enhancements and bug-fixes

If you are eager to try the latest features, you can always install QGIS nightlies/master.

Special thanks to all contributors and the sponsors of these features

Do you want to use QGIS Mesh Layers in your projects? Read more…

Native QGIS Temporal Controller

The long awaited native temporal support in QGIS is finally materialised. We managed to port all QGIS Mesh Layer code to the new infrastructure and remove the custom time slider in the Mesh Layer properties/styling dialog. The native temporal support will greatly benefit users in the long run. We can now share the code components for time handing with raster, vector and WMS-T and other temporal data types. Also user can load multiple temporal layers and change time-domain for all of them at the same time.

mesh 3d in time

Unfortunately, the new temporal framework changed the API, so if you use QgsMeshLayer in your plugins, consult the QGIS documentation for required changes.

New MDAL logo and docs

We have started writing the proper documentation for all supported formats and also reference documentation for developers. We welcome all contributions to improve the documentations. Just go to https://www.mdal.xyz and click “Edit on GitHub”!

mdal logo

Support for 1d meshes

MDAL and QGIS now supports 1D meshes, currently for UGRID and 3Di formats. Other formats should be easy to add. If you are interested in supporting a format, drop us a line.

You can read the full technical description in the following QGIS Enhancement Proposal.

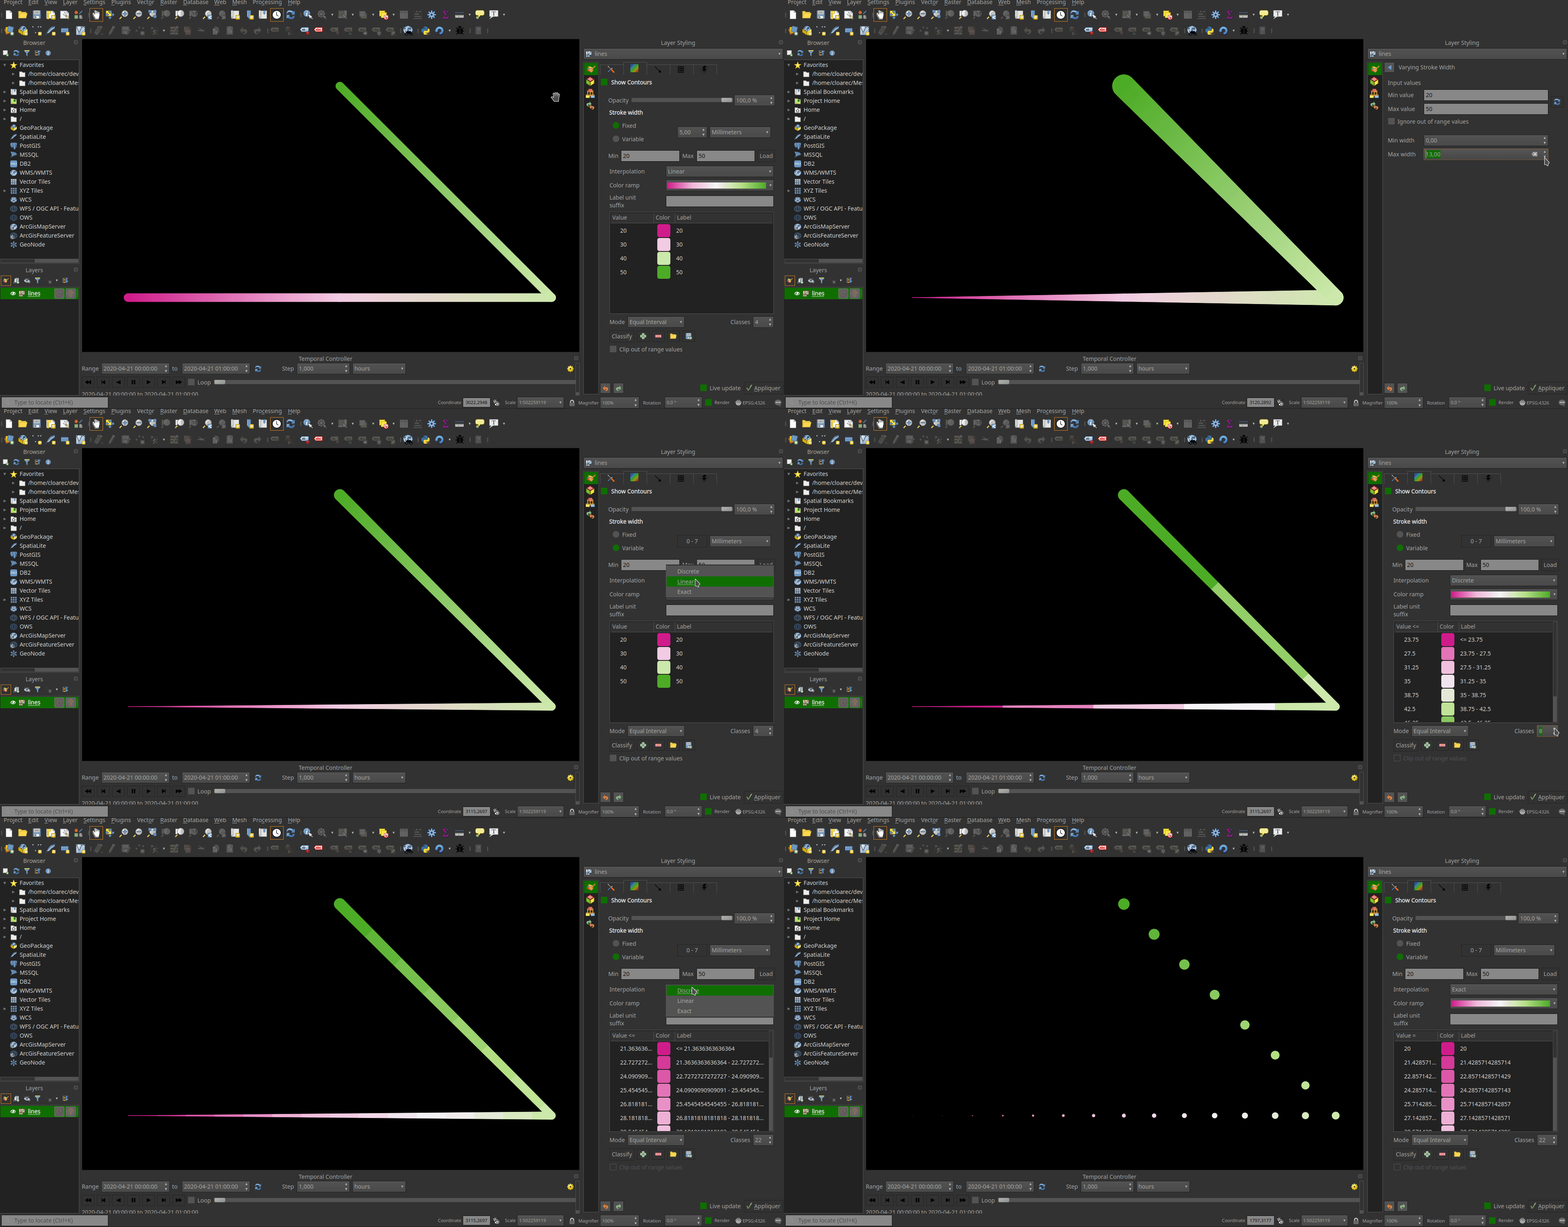
The 1D meshes can be styled with the various renderers, for example use of pressure data to calculate line width: variable with 1D mesh

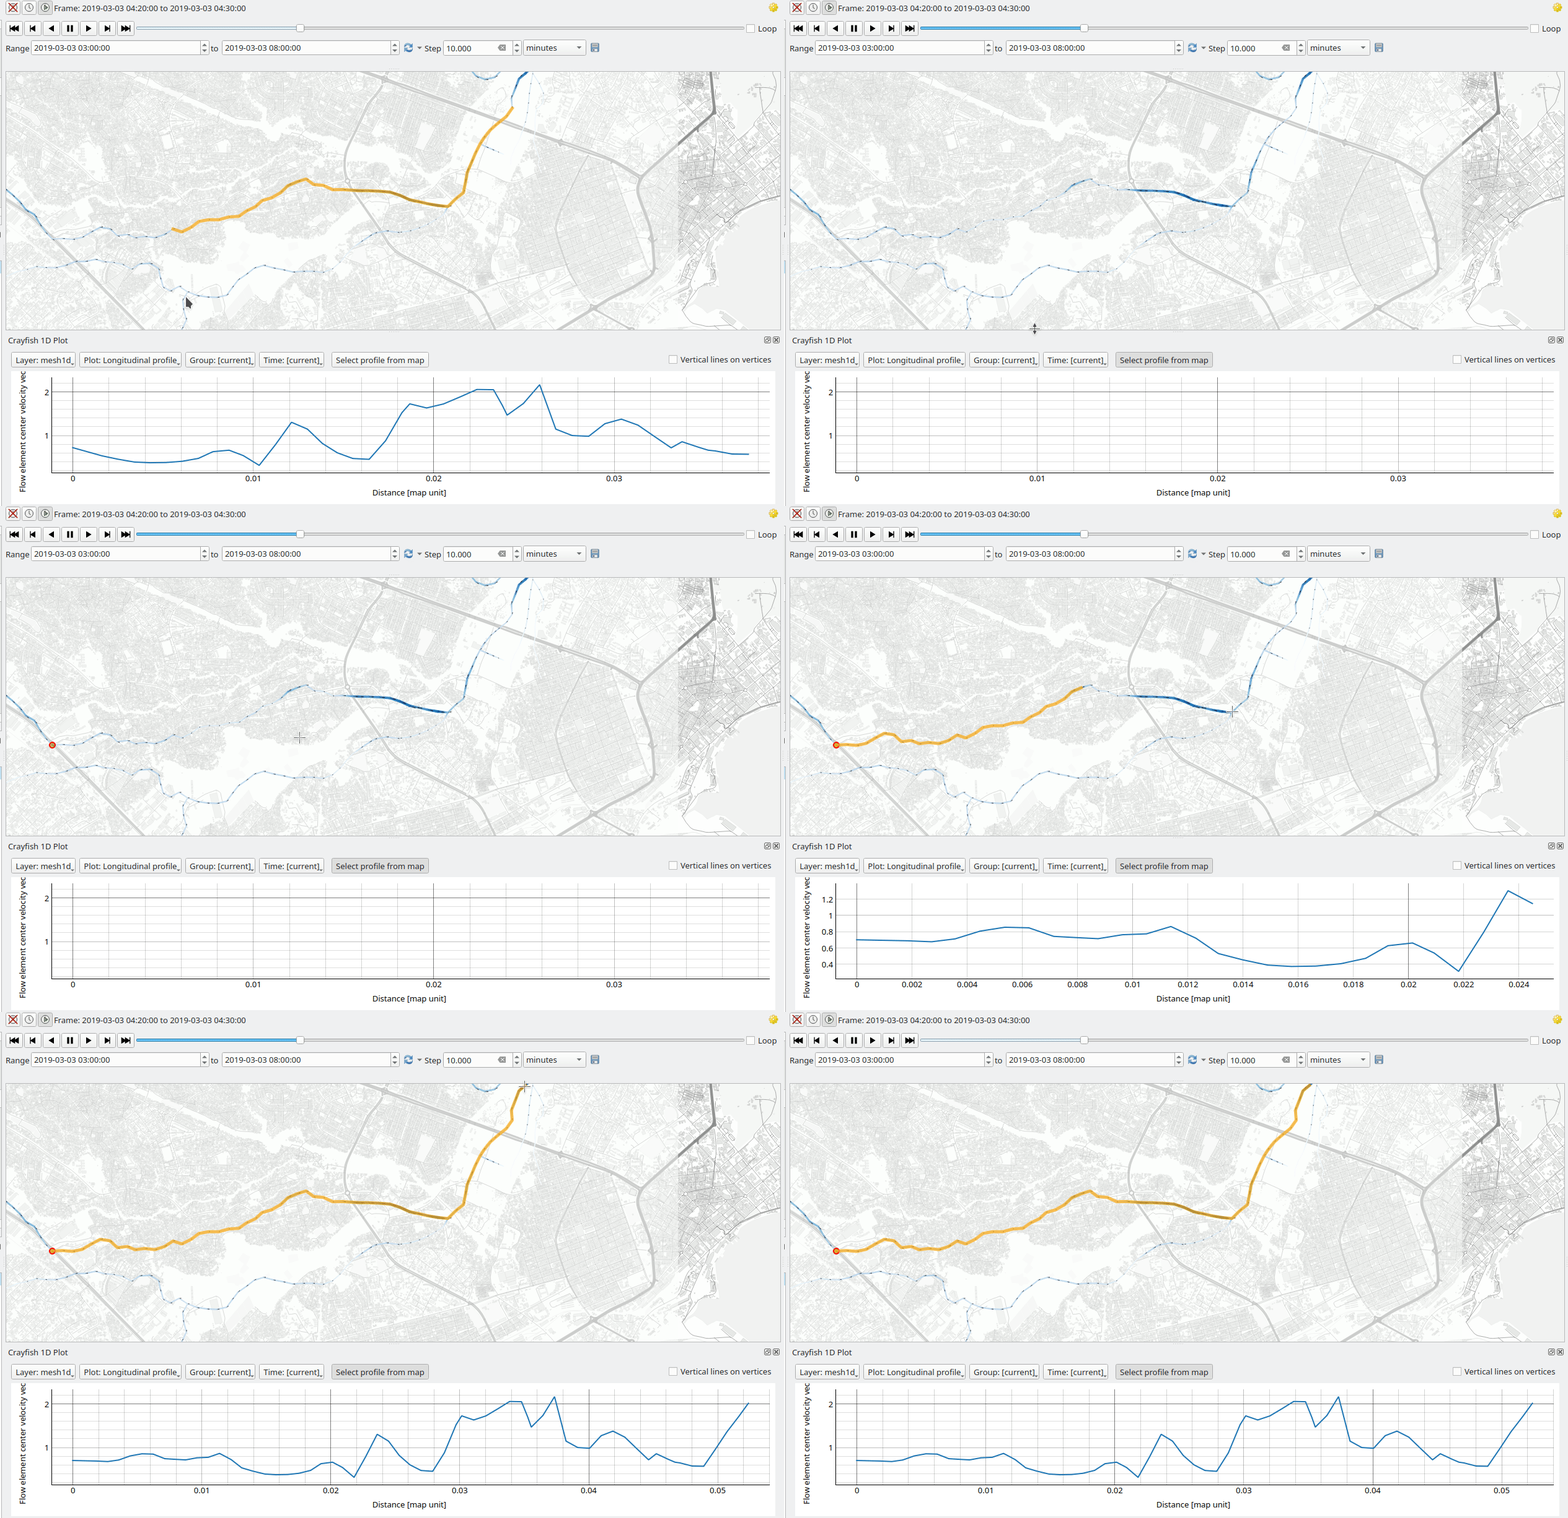
Furthermore, Crayfish plugin has been extended to support such mesh data frames. For example, 1D plots in Crayfish with the snapping and routing along the network can be used: snapping 1D mesh

2D mesh rendering improvement

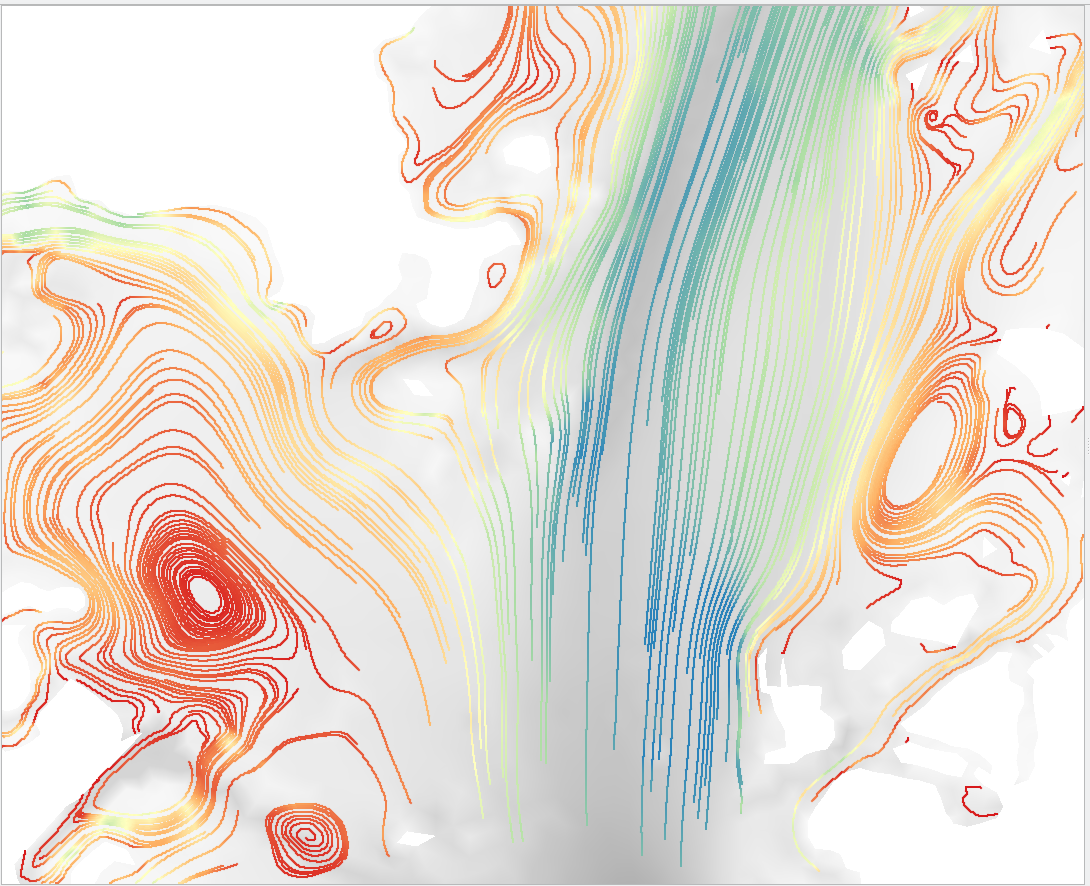
2D meshes streamlines/particles/arrows can be now styled by the colour ramp. You can better display streamlines and mesh vectoral data varaition: streamline colorram

Meshes in 3D map view

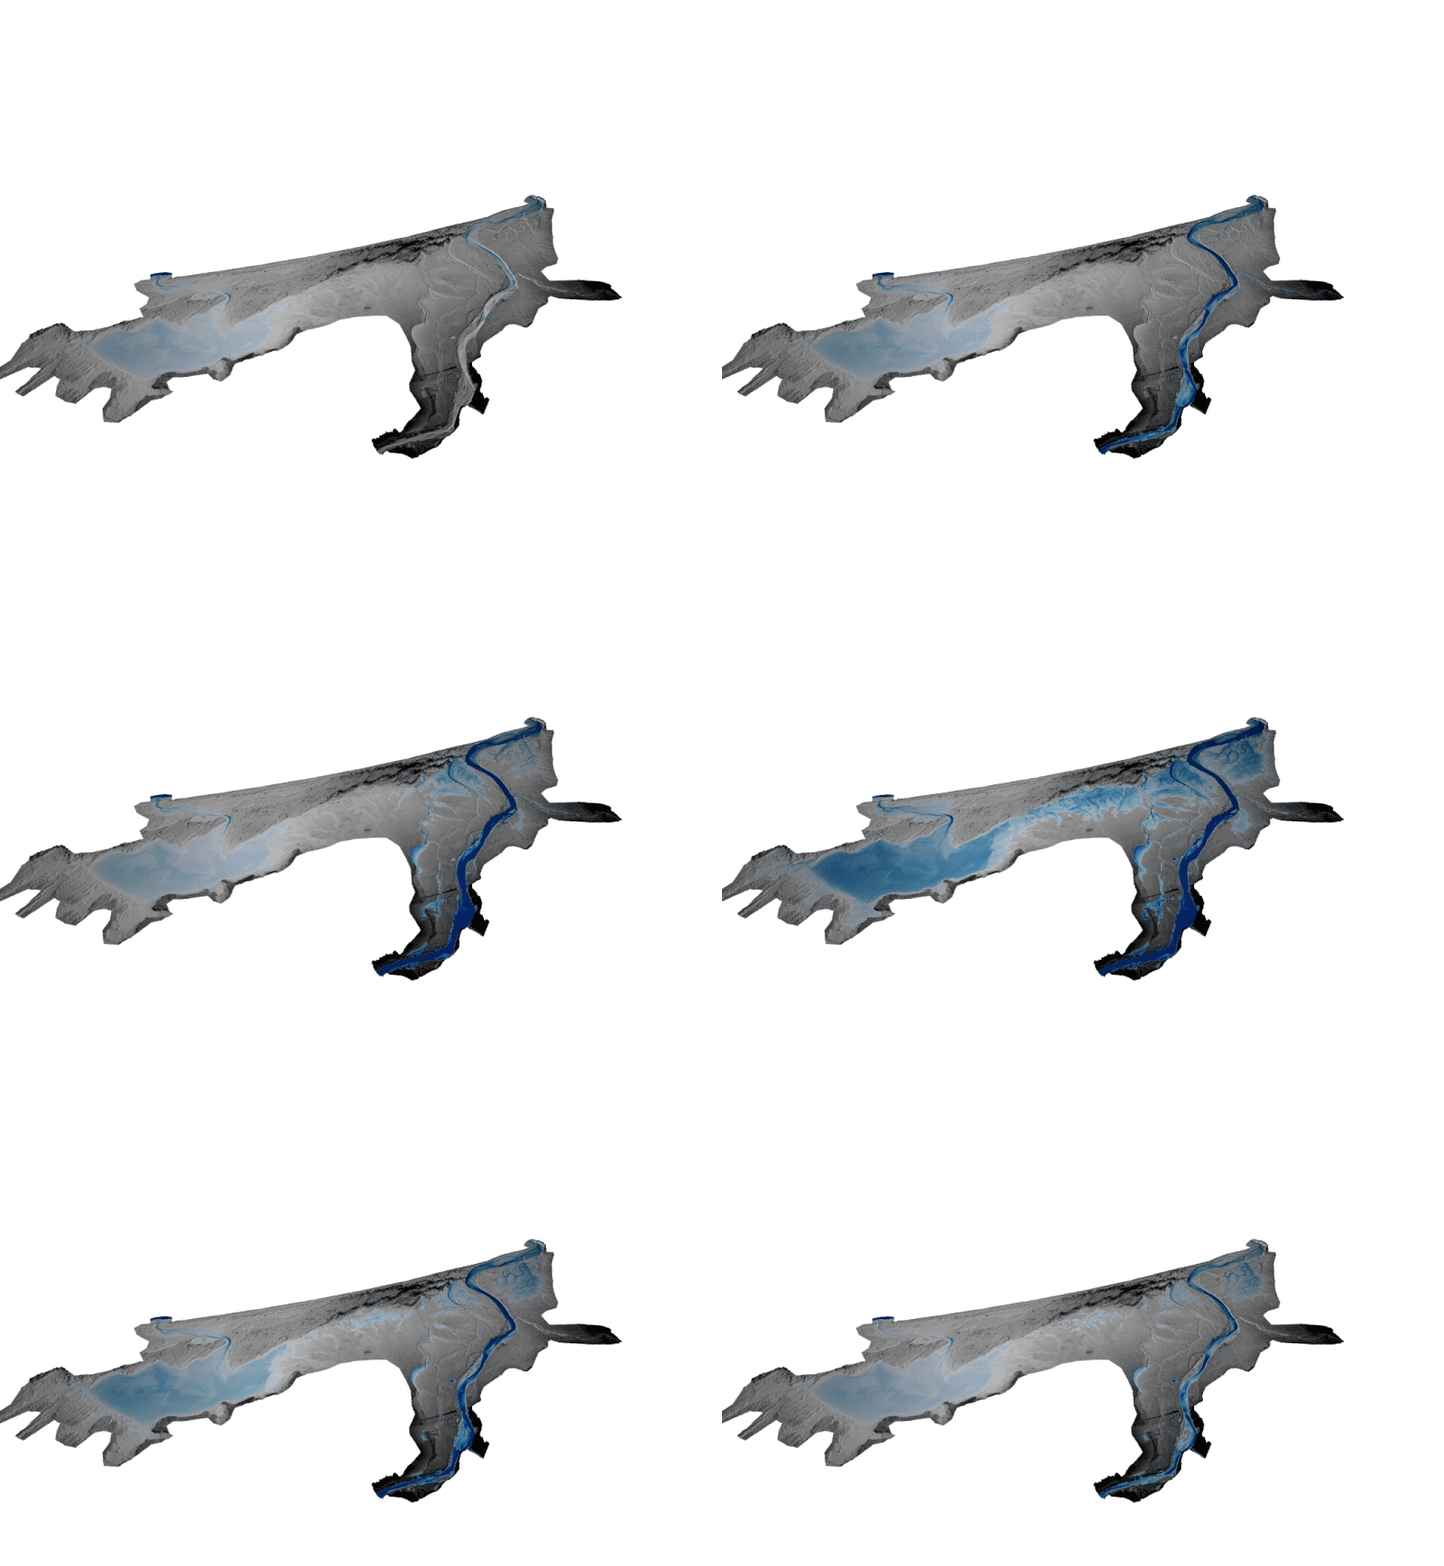
The mesh layer is now fully supported in the 3D map view. You can visualise your terrain and overlay vector arrows (e.g. velocity) and other mesh quantities (e.g. water surface) in the 3D map view.

meshes 3D

Other features and bugfixes

QGIS

  • The mesh rendering speed increased by 2-20 times depending on various mesh/zoom/map/data combinations
  • Ability to show only subset of dataset groups in the Mesh styling window
  • Support for reading multiple meshes in one file (e.g. UGRID)
  • Ability to resample vertex values to faces
  • Support for saving/loading of QML styles
  • Full usage of temporal controller, even in print templates, animation, …

MDAL

  • The GRIB and NetCDF datasets are now loaded twice as fast
  • Support for UGRID datasets with magnitude and direction
  • Support for reading of UGRID classified data and its usage in QGIS color ramps
  • Renamed the pointers and functions in the API for consistency
  • Created brand new logo and started the online-docs
  • Support XMS Tin

Crayfish

  • Ported to new temporal API
  • Added 1D plots
  • Fixed various UI bugs

You may also like...

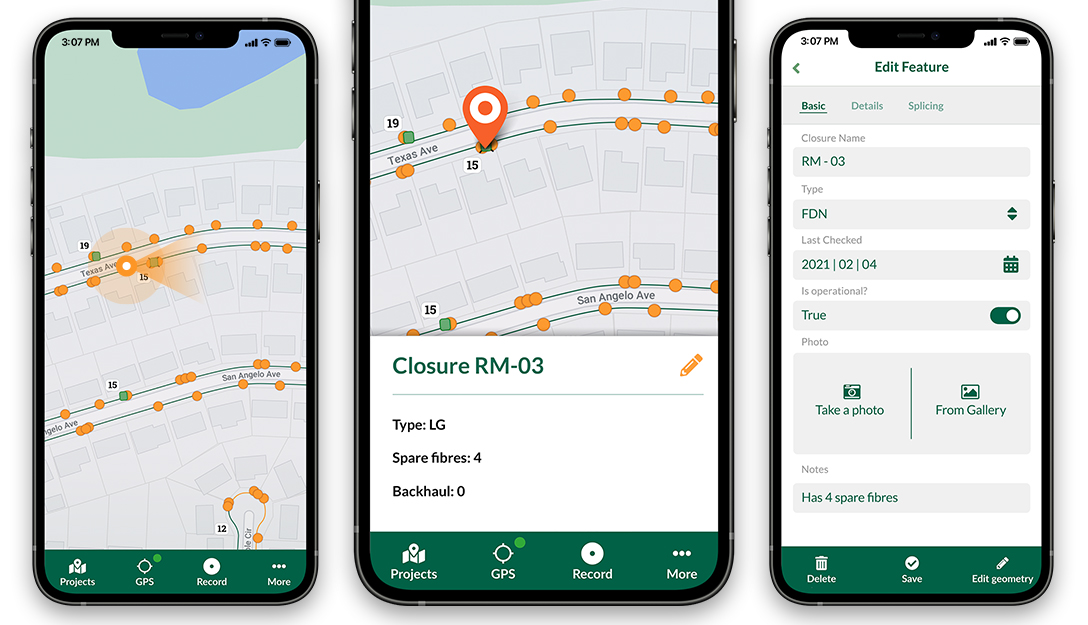
Mergin Maps, a field data collection app based on QGIS. Mergin Maps makes field work easy with its simple interface and cloud-based sync. Available on Android, iOS and Windows. Screenshots of the Mergin Maps mobile app for Field Data Collection
Get it on Google Play Get it on Apple store

QGIS Pi Mapping Contest Results

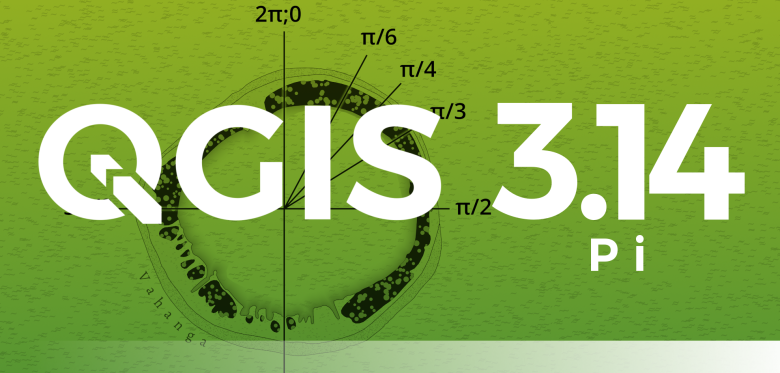
As you may have noticed, the next release version will be 3.14 and therefore, we will call it ‘Pi’.

Usually our versions are named for community meeting locations and the splash screen shows a map related to this location.

For 3.14 we were looking for creative maps that capture the essence of Pi.

Submissions

The submission phase was open for two weeks and we received numerous inspiring submissions:

Public voting

From these submissions, a short list of top 3 candidates was compiled and put up for the public vote:

Candidate #1 Ezequiel Orquera writes about his submission: “As an agronomist, Pi is used every single time that you need to develop a pivot irrigation system (those nice circles we can see on sat. images), making most use of Pi number and the radius. In this image, we can see the circles in contrast with rectangles shapes. The interest thing is that on most of the circles you can see the irrigation system arm that is coming from the center of each circle, making it the radius. Furthermore we all know that Pi x r^2 = circle area. This is useful to estimate for example, crop yields.”

Candidate #2 Francis Josef Gasgonia writes about his submission: “This map would not be complete without the use of Pi. Multicentric ring buffers represent potential danger zones in this map of Mt. Isarog in the Philippines. The calculations necessary to develop the ring buffers depend on Pi. Mt. Isarog is classified as a potentially active stratovolcano. This map best represents the use of Pi in a map because these buffers are crucial in disaster planning, especially now in a Covid-19 pandemic world; wherein ring buffers, and other types of buffers are in use for humanitarian and logistics planning.”

Candidate #3 Michel Stuyts writes about his submission: “Since Pi is very much linked to circles, I looked for the most circular place I could find. The place I made a map of is Vahanga, an atoll in the Pacific Ocean. I decorated the map with angles of a circle in radians as divisions of Pi. Because QGIS splash screens usually show a map of a location where a developer meeting was, the chance it would ever have a map of this part of the world is just as irrational as Pi, because the closest inhabited place is more than a 1000km away. My map is also linked to Corona (the reason there was no dev meeting in the first place), because the atoll is crown shaped and Corona means crown. Besides being linked to Pi and Corona, my map is also very much linked to QGIS, because it’s 100% made with QGIS. The angles in radians where made with “geometry generators” from the central point. The fills where made using “random marker fills” combined with an expression using “randf()” to set the size of the markers with a “Data defined override”. For the shallow water on the inside of the atoll I used a “Shapeburst fill”.

And the winner is …

In the public vote, Francis Josef Gasgonia’s map received the most votes (46%):

Congratulations Francis and thank you again to everyone who participated in this fun contest to ensure that QGIS 3.14 Pi will have great visuals!

(Fr) Financement mutualisé du logiciel libre: le cas QGIS

Sorry, this entry is only available in French.

Working with vector tiles - Part 1

After a successful crowdfunding campaign to support Vector Tiles in QGIS, we have been busy adding new features for the upcoming release (3.14).

In this blog post, we are exploring different methods to add your vector tiles and style them.

Loading data - local files

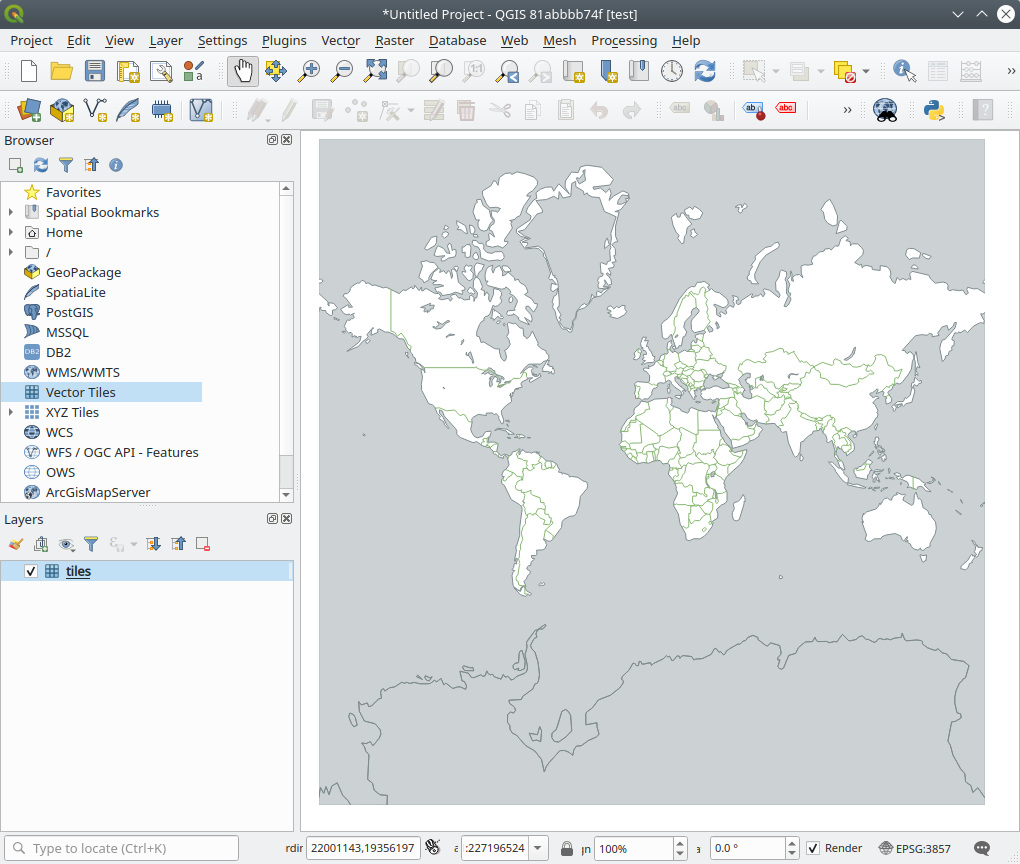
If you have an MBTiles file containing vector tiles, you can simply drag and drop the layer in QGIS. Alternatively, you can connect to a local vector tile file(s) from the Data Source Manager or the Browser Panel. As an example, you can use this QGIS project which contains Switzerland vector tiles (maximum zoom level =14).

Vector tile file

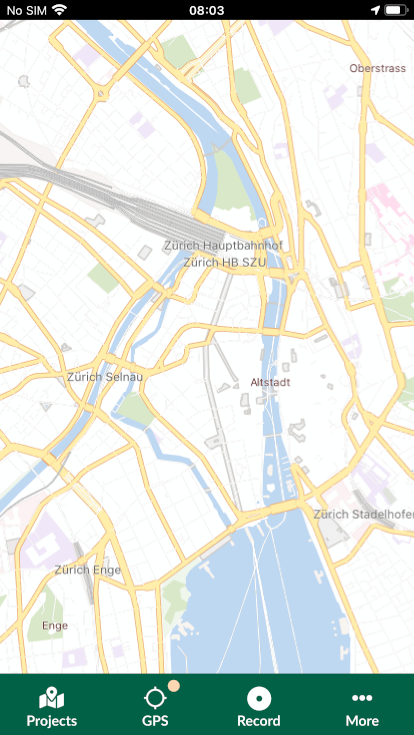
You can also test this project on your mobile device. Download Input app (for iOS you need the TestFlight version of the app), head to Projects > Explore and download saber\blogpost-vectortile.

Loading data - web resources

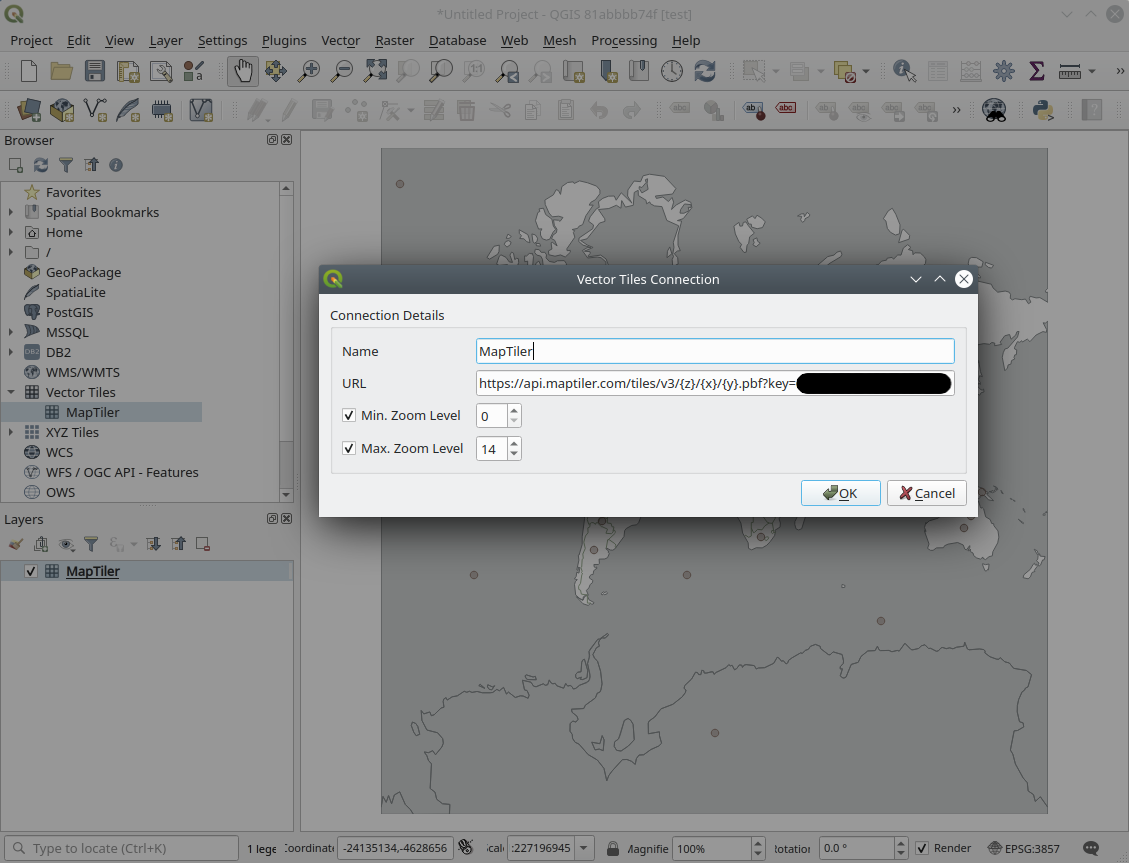
You can access vector tiles served through the web. You need to have the URL and possibly API key to add them in your QGIS. In the example below, vector tiles from MapTiler are added to QGIS:

Vector tile file

To use MapTiler data, we recommend using their dedicated QGIS plugin, which comes with vector tiles in different styles. The plugin should be available on the QGIS plugin repository.

Styling data

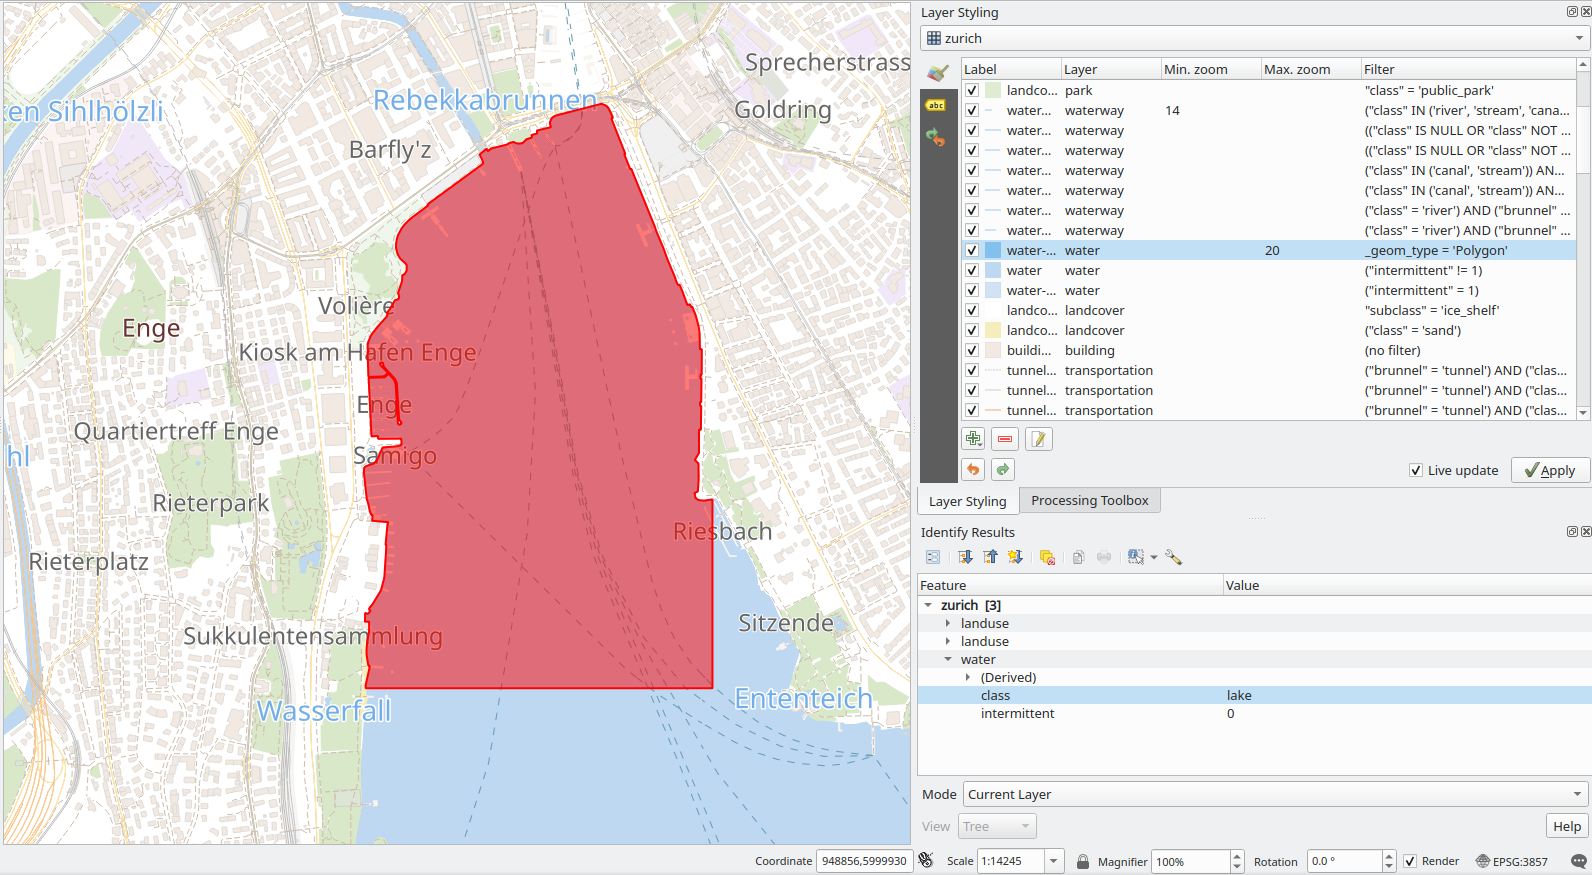
Vector tiles contain points, line and polygon geometries. You can define a set of rules for features and apply style and label. Style and labelling can be dependent on the zoom level. Similar to vectors and rasters, styles for vector tiles can be stored in QML format. To set up filters, you can use the identify tool in QGIS to inspect geometries of your vector tile:

Vector tile file

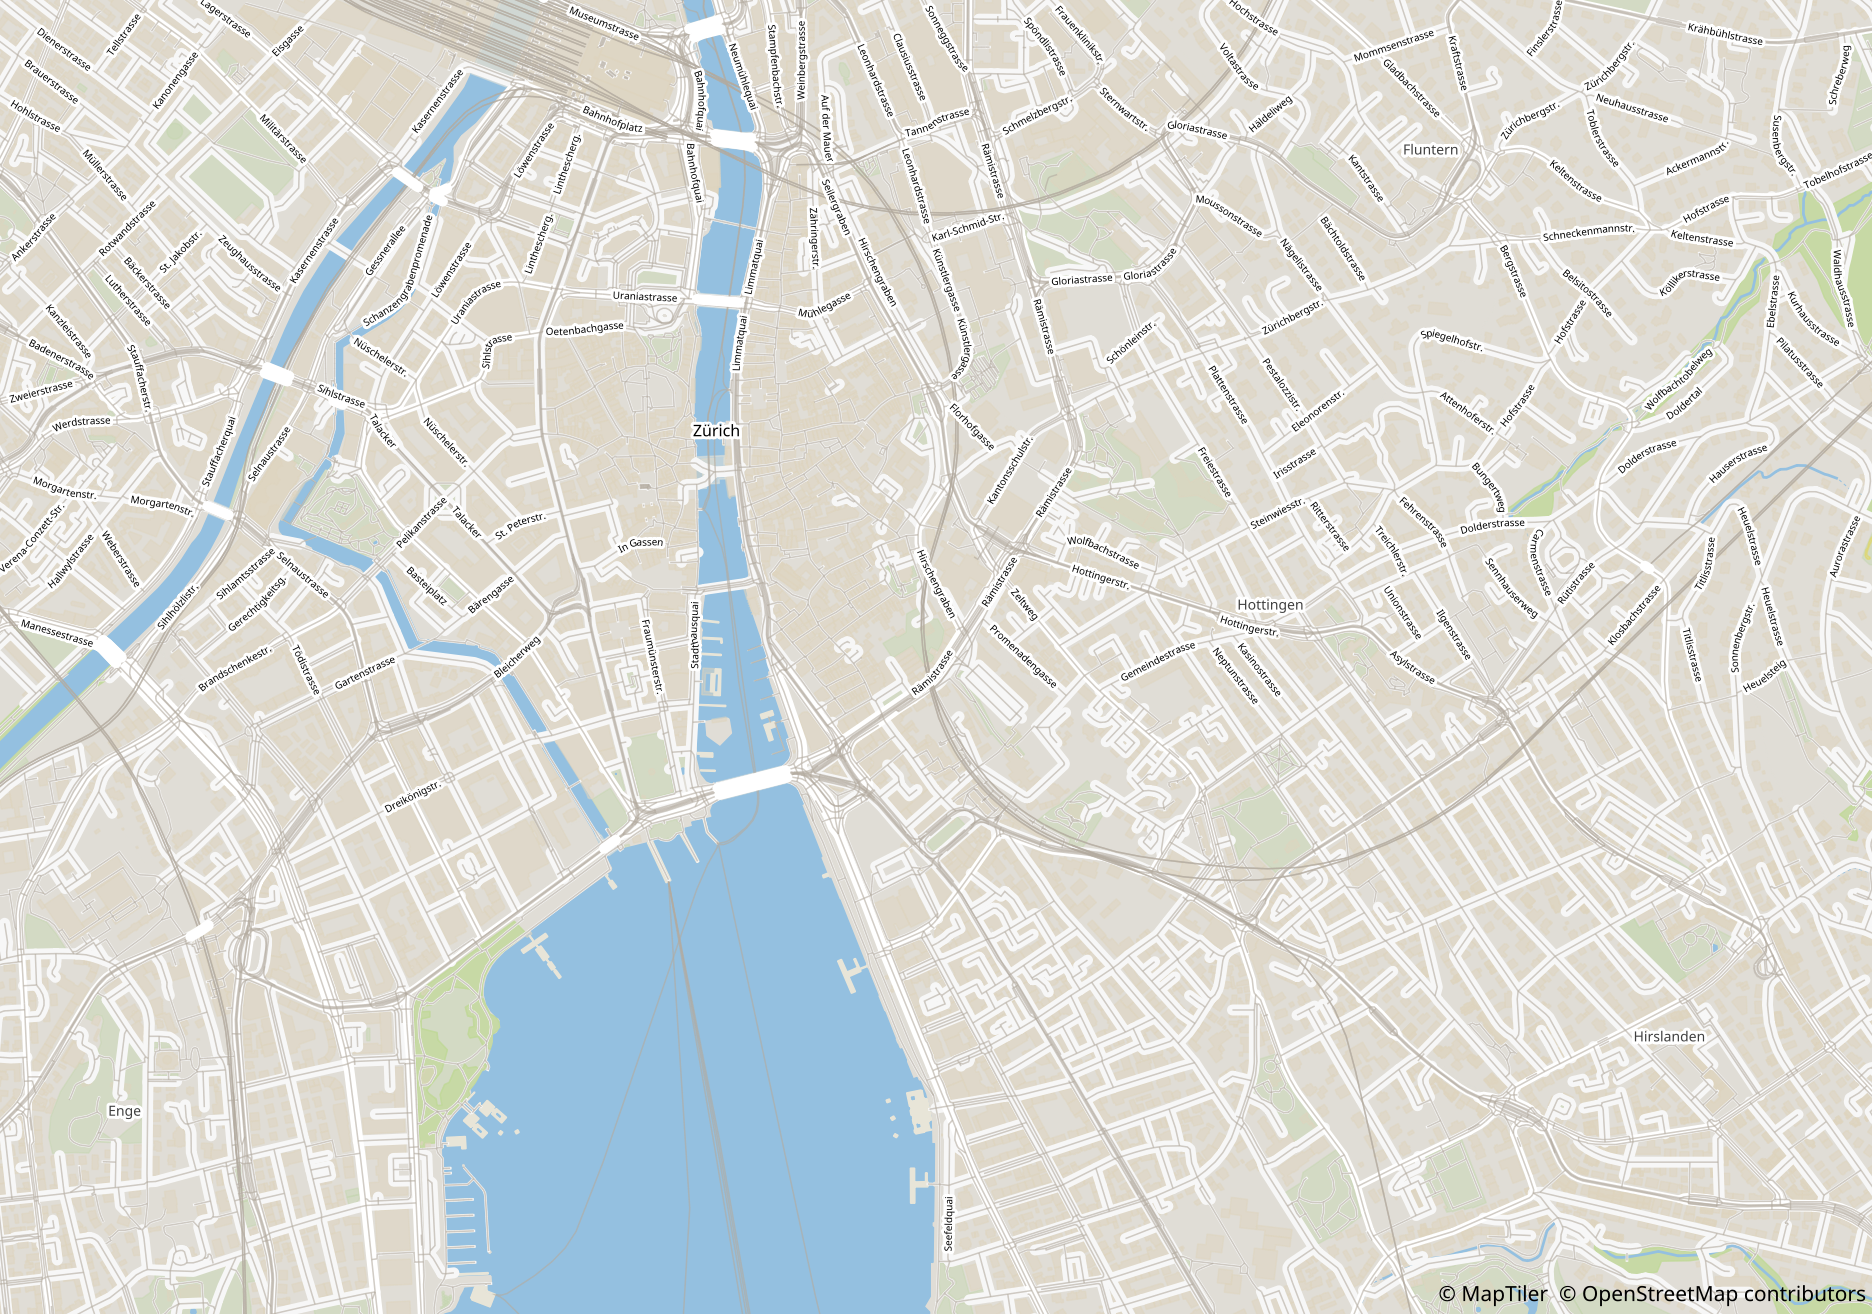
Currently, the most common format to store vector tiles styles are Mapbox GL (json). The OpenMapTiles repo contains some excellent Mapbox GL styles. We initially developed a tool to convert the json files to QGIS style. The plugin has been further extended and developed by MapTiler to better handle the OpenMapTiles data schema. This will ensure future changes to the data schema will be addressed by the plugin.

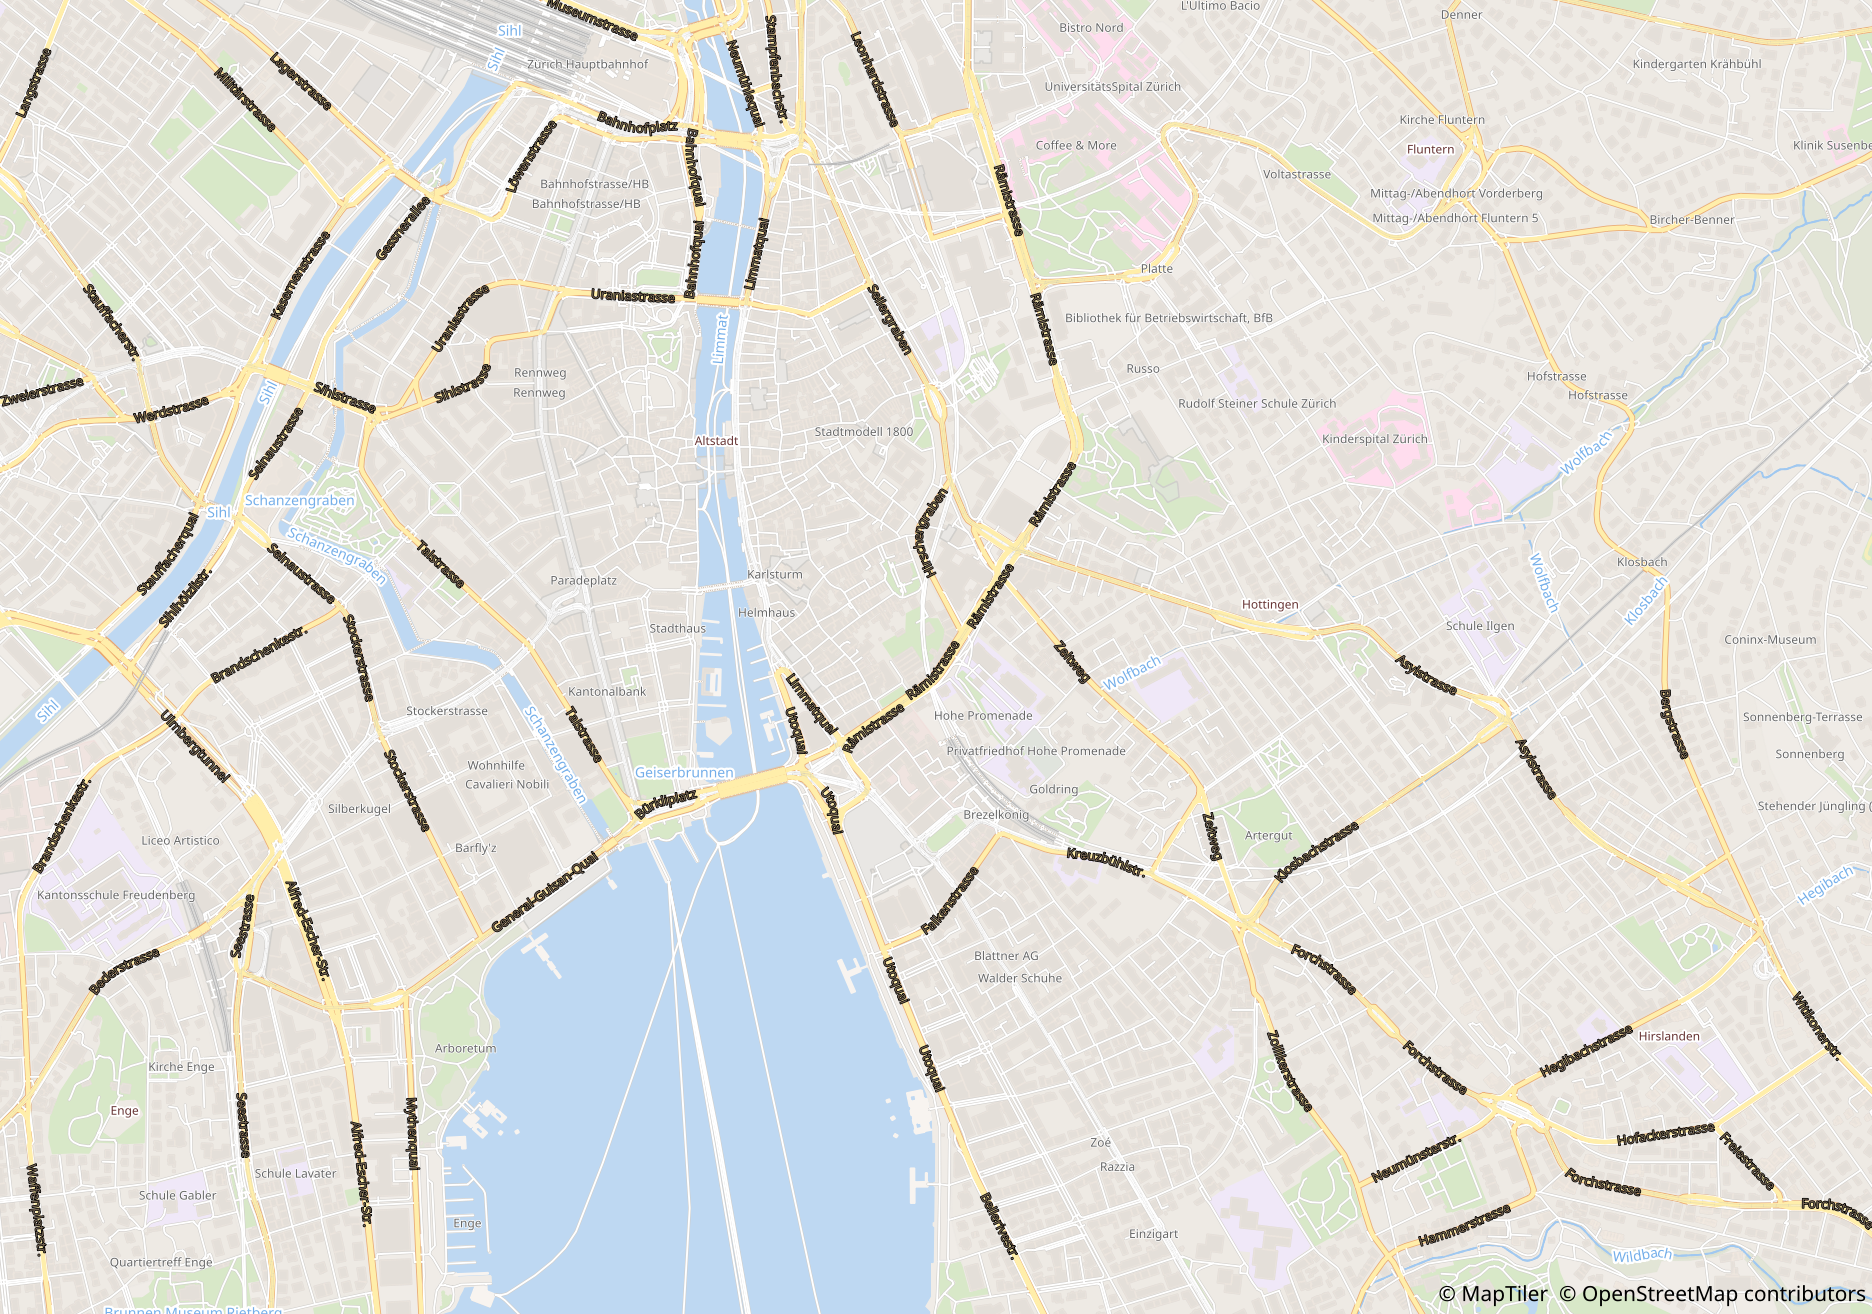
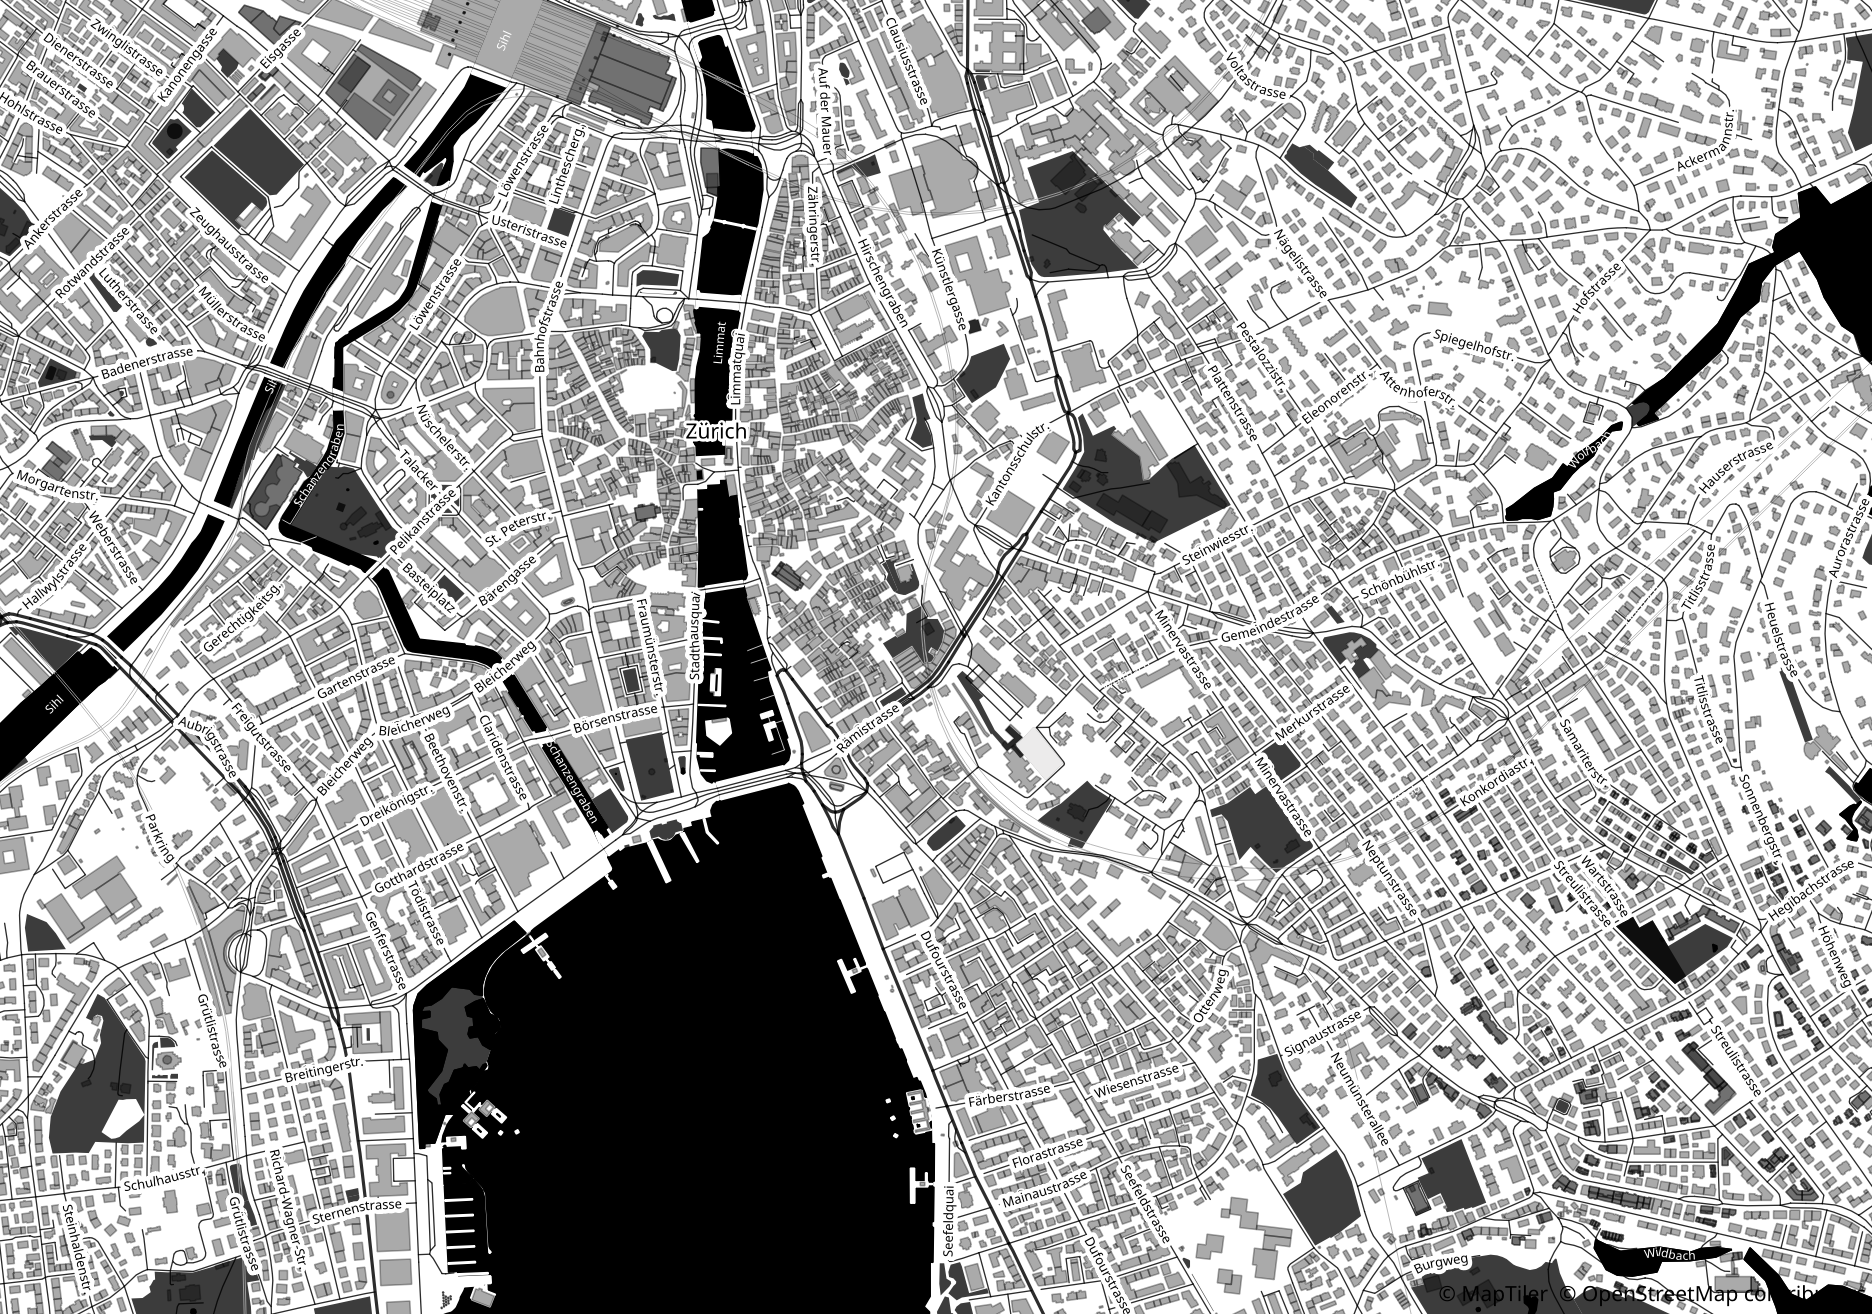
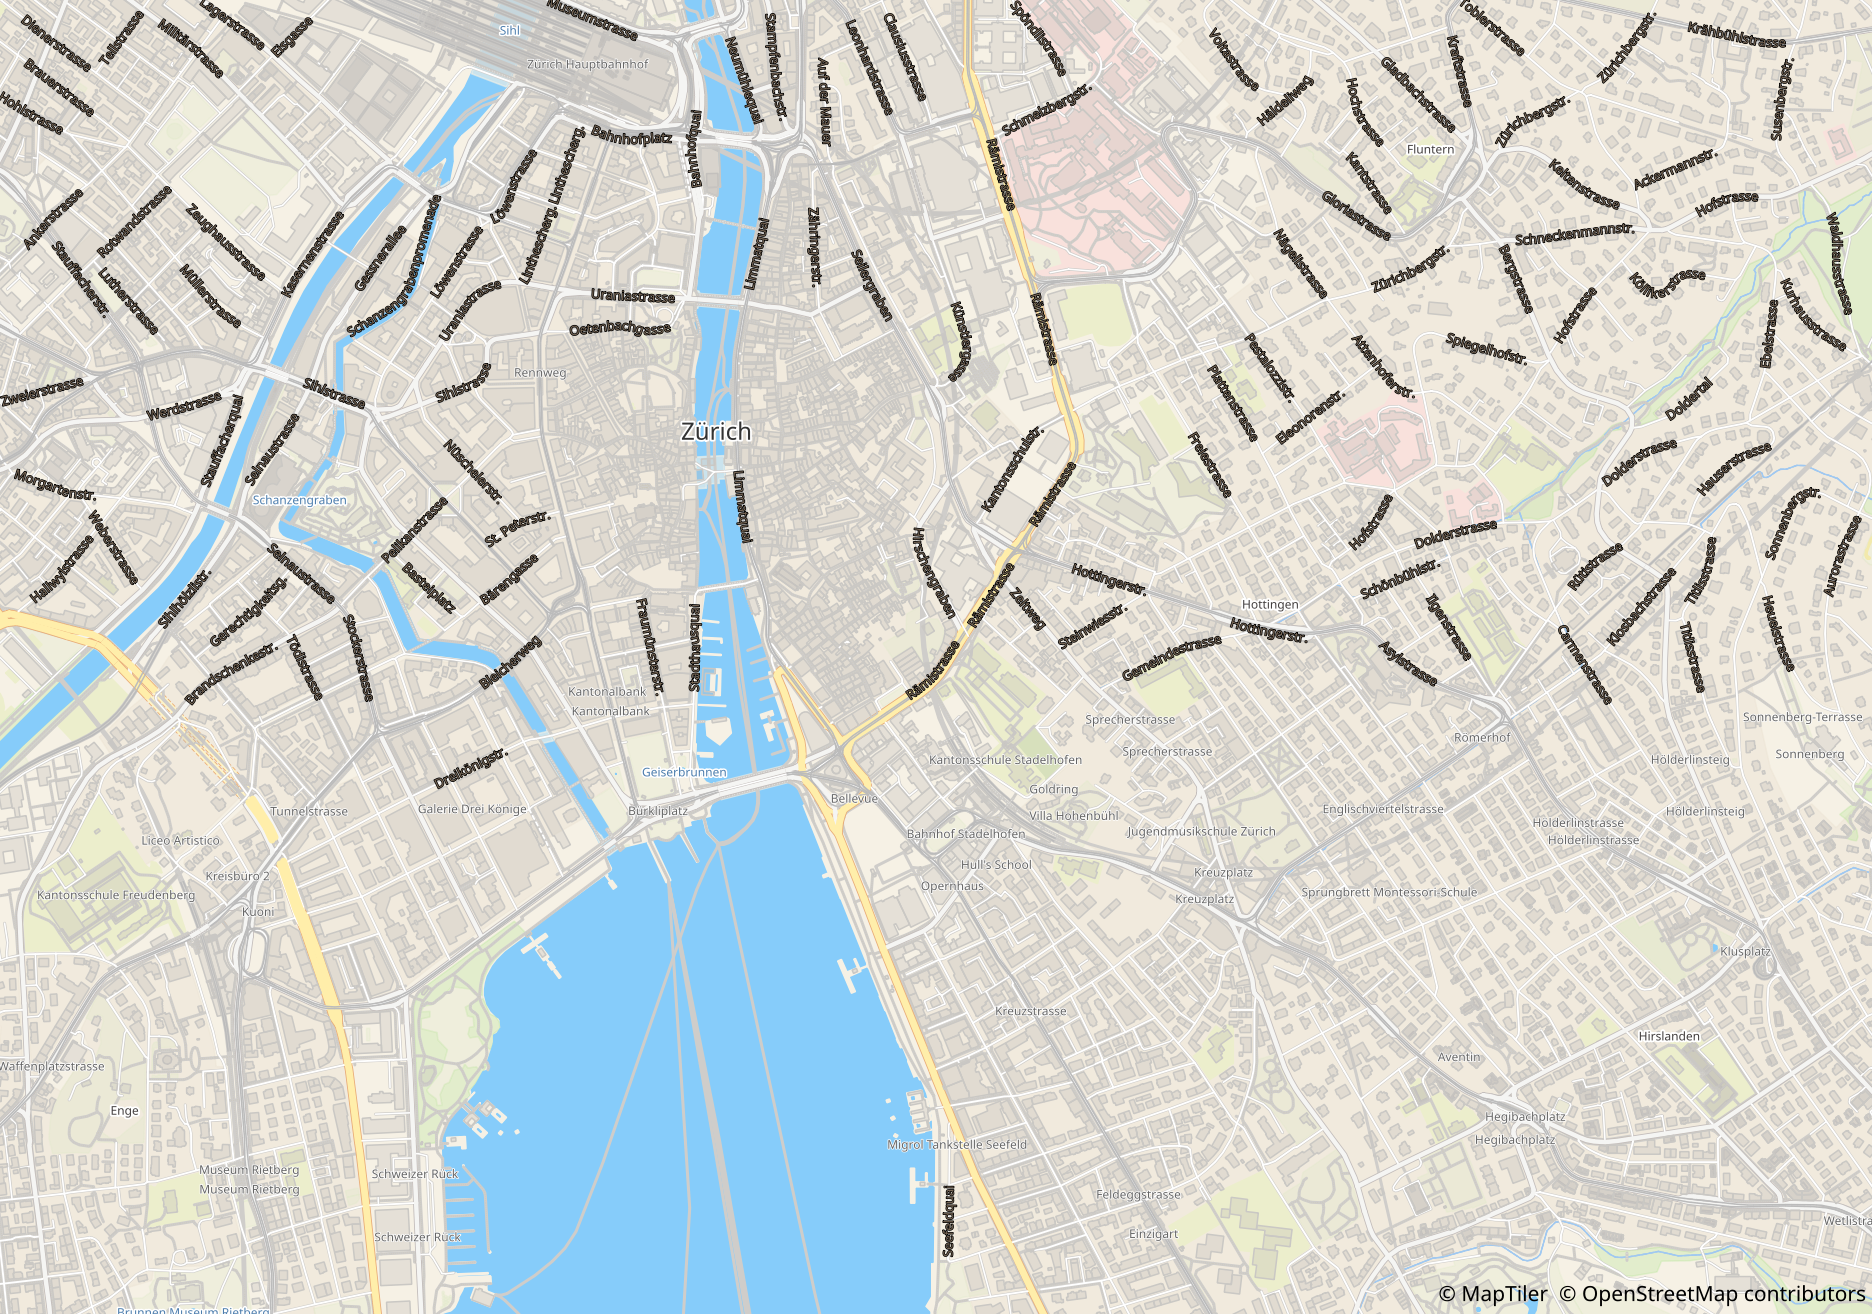
Example of styles converted from Mapbox GL to QGIS from Maptiler QGIS plugin

Vector tile file

Vector tile file

Vector tile file

Vector tile file

In the next post, we will explore different options within QGIS or other 3rd party tools to generate vector tiles.

Credits

All the data used in this blog post was from OpenStreetMap server by Geofabrik. OpenMapTiles conversion tool was used to generate the tiles from OpenStreetMap to vector tiles. See software license for more details.

The following OpenMapTiles Mapbox GL styles Bright, Positron, Basic and Fiord were converted using mapbox2qgis and QGIS MapTiler plugin.

You may also like...

Mergin Maps, a field data collection app based on QGIS. Mergin Maps makes field work easy with its simple interface and cloud-based sync. Available on Android, iOS and Windows. Screenshots of the Mergin Maps mobile app for Field Data Collection
Get it on Google Play Get it on Apple store

Responsive background maps with QGIS Cloud

Responsive background maps with QGIS Cloud Sourcepole QGIS Cloud is a great and convenient way to publish geodata as webmaps, to have a database and to manage everything from the desktop GIS. No need to run and maintain a server. Today our topic is handling of background maps in QGIS Cloud. QGIS Cloud maps are normally WMS maps delivered by QGIS Server. However most maps consist of a foreground (vector) theme and a background raster layer.

Securely accessing enterprise ArcGIS Portal sites through QGIS

An updated version of this guide is available!

We were recently contacted for advice regarding our recommendations for securely accessing content on an enterprise ArcGIS Portal deployment from within QGIS. Fortunately, this setup is fully supported and works seamlessly in QGIS, thanks to the native integration of “OAuth2” authentication in QGIS!

This post details step-by-step instructions in setting up both ArcGIS Portal and QGIS to enable this integration. First, we’ll create a new desktop application on the Portal site in order to obtain the application-specific access keys for OAuth2 authentication. We’ll then create an authentication configuration in QGIS and associate this with a connection to the Portal site. Let’s dive in by doing the Portal configuration first…

Creating an application

Logon to the Portal, and from the “Content” tab, click the “Add Item” option. Select “An application” from the drop down list of options:

Set the type of the application as “Desktop

You can fill out the rest of this dialog as you see fit. Suggested values are:

  • Purpose: Ready to Use
  • Platform: Qt
  • URL: http://qgis.org
  • Tags: QGIS, Desktop, etc

Now – here comes a trick. Portal will force you to attach a file for the application. It doesn’t matter what you attach here, so long as it’s a zip file. While you could attach a zipped copy of the QGIS installer, that’s rather wasteful of server space! We’d generally just opt for a zip file containing a text file with a download link in it.

Click Add Item when you’re all done filling out the form, and the new application should be created on the Portal.

Registering the Application

The next step is to register the application on Portal, so that you can obtain the keys required for the OAuth2 logon using it. From the newly created item’s page, click on the “Settings” tab:

Scroll right to the bottom of this page, and you should see a “Register” button. Press this. Set the “App type” to “Native“.

Add two redirect URIs to the list (don’t forget to click “Add” after entering each!):

  1. The Portal’s public address, e.g. https://mydomain.com/portal
  2. http://127.0.0.1:7070

Finally, press the “Register” button in the dialog. If all goes well then the App Registration section in the item settings should now be populated with details. From here, copy the “App ID” and “Secret” strings, we’ll need these later:

Determine Request URLs

One last configuration setting we’ll need to determine before we fire up QGIS is the Portal’s OAuth Request and Token URLs. These are usually found by appending /sharing/rest/oauth2/authorize and /sharing/rest/oauth2/token to the end of your Portal’s URL.

For instance, if your public Portal URL is http://mydomain.com/portal, then the URLs will be:

Request URL: http://mydomain.com/portal/sharing/rest/oauth2/authorize
Token URL: http://mydomain.com/portal/sharing/rest/oauth2/token

You should be able to open both URLs directly in a browser. The Request URL will likely give a “redirect URL not specified” error, and the Token URL will give a “client_id not specified” error. That’s ok — it’s enough to verify that the URLs are correct.

We’re all done on the Portal side now, so time to fire up QGIS!

Creating an QGIS OAuth2 Authentication Configuration

From your QGIS application, select Options from the Settings menu. Select the Authentication tab. We need to create a new authentication configuration, so press the green + button on the right hand side of the dialog. You’ll get a new dialog prompting you for Authentication details.

There’s a few tricks to this setup. Firstly, it’s important to ensure that you use the exact same settings on all your client machines. This includes the authentication ID field, which defaults to an auto-generated random string. (While it’s possible to automatically deploy the configuration as part of a startup or QGIS setup script, we won’t be covering that here!).

So, from the top of the dialog, we’ll fill in the “Name” field with a descriptive name of the Portal site. You then need to “unlock” the “Id” field by clicking the little padlock icon, and then you’ll be able to enter a standard ID to identify the Portal. The Id field is very strict, and will only accept a 7 letter string!

Drop down the Authentication Type combo box, and select “OAuth2 Authentication” from the list of options. There’s lots of settings we need to fill in here, but here’s what you’ll need:

  • Grant flow: set to “Authorization Code”
  • Request URL: enter the Request URL we determined in the previous step, e.g. http://mydomain.com/portal/sharing/rest/oauth2/authorize
  • Token URL: enter the Token URL from the previous step, e.g. http://mydomain.com/portal/sharing/rest/oauth2/token
  • Refresh Token URL: leave empty
  • Redirect URL: leave as the default http://127.0.0.1:7070 value
  • Client ID: enter the App ID from the Portal item’s App Registration information (see earlier steps)
  • Client Secret: enter the App Secret from the Portal item’s App Registration information (see earlier steps)
  • Scope: leave empty
  • API Key: leave empty

That’s it — leave all the rest of the settings at their default values, and click Save.

You can close down the Options dialog now.

Adding the Portal Connection Details

Lastly, we’ll need to setup the Portal connection as an “ArcGISFeatureServer” and “ArcGISMapServer” connection in QGIS. This is done through the QGIS “Data Source Manager” dialog, accessed through the Layer menu. Click the “ArcGIS Feature Server” tab to start with, and then press “New” in the Server Connections group at the top of this dialog.

Enter a descriptive name for the connection, and then enter the URL for the ArcGIS server REST endpoint associated with your Portal:

Lastly, select the new OAuth2 configuration you just created under the “Authentication” group:

Click OK, and you’re done! When you try to connect to the newly added connection, you’ll automatically be taken to the Portal’s logon screen in order to authenticate with the server. After entering your details, you’ll then be connected securely to the server and will have access to all items which are shared with your user account on the Portal!

You can then repeat this step for and create a similar connection under the “ArcGIS Map Server” tab.

We’ve regularly use this setup for our enterprise clients, and have found it to work flawlessly in recent QGIS versions! If you’ve found this useful and are interested in other “best-practice” recommendations for mixed Open-Source and ESRI workplaces, don’t hesitate to contact us to discuss your requirements… at North Road we specialise in ensuring flawless integration between ESRI based systems and the Open Source geospatial software stack.

Movement data in GIS #30: synchronized trajectory animations with QGIS temporal controller

QGIS Temporal Controller is a powerful successor of TimeManager. Temporal Controller is a new core feature of the current development version and will be shipped with the 3.14 release. This post demonstrates two key advantages of this new temporal support:

  1. Expression support for defining start and end timestamps
  2. Integration into the PyQGIS API

These features come in very handy in many use cases. For example, they make it much easier to create animations from folders full of GPS tracks since the files can now be loaded and configured automatically:

Script & Temporal Controller in action (click for full resolution)

All tracks start at the same location but at different times. (Kudos for Andrew Fletcher for recordings these tracks and sharing them with me!) To create an animation that shows all tracks start simultaneously, we need to synchronize them. This synchronization can be achieved on-the-fly by subtracting the start time from all track timestamps using an expression:

directory = "E:/Google Drive/QGIS_Course/05_TimeManager/Example_Dayrides/"

def load_and_configure(filename):
    path = os.path.join(directory, filename)
    uri = 'file:///' + path + "?type=csv&escape=&useHeader=No&detectTypes=yes"
    uri = uri + "&crs=EPSG:4326&xField=field_3&yField=field_2"
    vlayer = QgsVectorLayer(uri, filename, "delimitedtext")
    QgsProject.instance().addMapLayer(vlayer)

    mode = QgsVectorLayerTemporalProperties.ModeFeatureDateTimeStartAndEndFromExpressions
    expression = """to_datetime(field_1) -
    make_interval(seconds:=minimum(epoch(to_datetime("field_1")))/1000)
    """

    tprops = vlayer.temporalProperties()
    tprops.setStartExpression(expression)
    tprops.setEndExpression(expression) # optional
    tprops.setMode(mode)
    tprops.setIsActive(True)

for filename in os.listdir(directory):
    if filename.endswith(".csv"):
        load_and_configure(filename)

The above script loads all CSV files from the given directory (field_1 is the timestamp, field_2 is y, and field_3 is x), enables sets the start and end expression as well as the corresponding temporal control mode and finally activates temporal rendering. The resulting config can be verified in the layer properties dialog:

To adapt this script to other datasets, it’s sufficient to change the file directory and revisit the layer uri definition as well as the field names referenced in the expression.


This post is part of a series. Read more about movement data in GIS.

Spatial on air: talking Python on the MapScaping Podcast

Podcasts have become huge. I’m an avid listener of podcasts myself. I particularly enjoy formats that take the time to talk about unconventional topics in detail.

My first podcast experience was on the QGIS podcast hosted by Tim Sutton in 2014. Unfortunately, it seems like the podcast episodes are not online anymore.

Recently, I had the pleasure to join the MapScaping Podcast by Daniel O’Donohue to talk about Python for Geospatial: 

Other guests Daniel has already interviewed include:

Another geospatial podcast I really enjoy is The Mappyist Hour by Silas and Todd. Unfortunately, it’s a bit silent there now but it’s definitely worth to listen into their episode archive. One of my favorites is Episode 9 where Linda Stevens (Hecht) discusses her career at ESRI, the future of GIS, and the role of Open Source Spatial in that future:

If you listen to and want to recommend other spatial podcasts, please share them in the comments!

QGIS Server and OGC API Features

Based on text and information from Paul Blottiere and Alessandro Pasotti (both QCooperative)

QGIS Server implements a number of OGC services, such as WMS, WFS, WCS or WMTS and extends these services where useful. Thanks to the efforts of a number of QGIS Server developers and companies, QGIS 3.10 (and 3.4 before) had been certified by the OGC for the WMS 1.3.0 service, and is also a WMS reference implementation.

alt wording

Last year in 2019, a new protocol has been developed and named OGC API Features (commonly known as WFS3). With the purpose of having an up-to-date QGIS Server, both OSGeo and QGIS.ORG have dedicated funds to work on the implementation of this brand-new service: but we wanted to do it right, so the ambition was also to reach the OGC certification!

This new protocol with REST interfaces gets rid of the XML specification to use the OpenAPI standard as well as the JSON open format instead. In other words, it’s not just another protocol to support, but a whole package of changes and fresh mechanisms to work on. It was quite a challenge!

QGIS core developers of QCooperative were remotely participating in OGC sprints to closely monitor the development of the new OGC API Features protocol. Hence, we started its implementation and a fully operational version landed in QGIS Server 3.10.

Implementation and features

As a reminder, the WFS protocol allows to query, retrieve and manipulate vector features, unlike the WMS format which provides raster outputs. OGC API Features is the natural continuity and consistently provides basic mechanisms to retrieve features and corresponding information in a specific area (the famous GetFeatureInfo request in WFS 1.X).

In addition, QGIS Server also provides transactions for the OGC API Features protocol. This means basically that we can update, insert or delete features in the underlying data. And of course, everything can be easily reached and configured through QGIS Desktop.

Yet another interesting thing to note is also the full support of the date and time filtering. Nifty!

And last, but not least, QGIS Server 3.10 provides a default HTML template with an embedded map to explore the data served by the server. There’s literally nothing to configure, it’s just there as soon as you work with the OGC API Features protocol :).

alt wording

OGC Certification

Once the implementation was completed, we started to address the OGC certification goal. To avoid unwanted regressions along the way, we first added nightly tests by updating the dedicated QGIS repository for OGC tests. From that moment, HTML reports are available day-to-day to monitor development over time.

Then, some bugfixes and backports later, we’re finally there: OGC tests are green on the development version, 3.12 and 3.10 releases. Yippee!

alt wording

Conclusion

Now that everything is in order, the last step is to start the formal OGC certification process. From now on, the dedicated QGIS OGC Team takes care of further operations.

Greetings from your new QGIS project Chair

Dear community,

First of all, I would like to thank Paolo for his work during the last two years as Chair and for the years before that, and years to come in his role as PSC member. I’m looking forward to keeping up the good work with him.

Secondly, I would like to thank all the community voting members for all the great inputs during the discussion phase of the AGM and for the fantastic participation in the voting process where we had more than an 80% turnout.

It is a pleasure to see that besides approving the more formal points (annual report, financial report, budget and auditors), the AGM approved all matters arising:

  • We now have two new honourable voting members: Harrissou Sant-anna and Nyall Dawson. Honourable members are specially designated voting members, whose position does not need to be affiliated with a country user group. Congratulations, and thank you, you are both such an inspiring example to our community!
  • Many QGIS users and contributors are geoscientists or geoinformatics specialists. As such, we need to act responsibly and serve as role models. Thanks to the approval of our new environmental policy, QGIS.ORG and the QGIS community committed ourselves to act responsibly regarding our actions and activities where it has any relevant influence on the environment. This will mainly affect our server infrastructure and our physical contributor meetings. The complete policy can be found in appendix 1 of our AGM minutes or on our website.

Beyond thanking Paolo as outgoing chair, I’d especially like to thank Tim, Andreas, Anita and Jürgen for the great work they are doing in the PSC and in general the incredible drive they have in helping to make QGIS thrive. I’m sure that with the help of our new Vice-Chair Alessandro Pasotti we’ll be able to take QGIS to even greater heights. Welcome, Alessandro!

Last, but definitely not least, I’d like to thank every single member of this amazing community for all your help documenting, coding, translating, testing, designing, teaching, supporting and in general spreading the QGIS love.

I never thought, when I first started using QGIS 0.6 in 2005 that 15 years later I would be given the honour of becoming the official face of such an amazing heart.

Have a great week, rock on QGIS!

Marco Bernasocchi

Incoming Chair of the QGIS.ORG Board


For Reference, here an extract of my published vision for QGIS.org:

I want to help QGIS and it’s community thrive under the value proposition of:

Making the most amazing opensource GIS that provides users with value and that meets their needs by providing great functionality and usability, being cost-effective whilst being actively supported by a vibrant and knowledgeable community.

Sharing our work under an open-source license is part of the approach by which we achieve that value proposition as it allows broad collaboration with our developers and users community.

I see FOSS as a very socially responsible way to develop software, but even more, I see the immense technological advantage that writing open-source code brings. This is why I want our focus to be on allowing both pragmatic and ideological views to respectfully coexist and enrich each other.

One of my main motivations to be part of the PSC and to make myself available as project Chair is to help QGIS keep this incredible growth rate by being even more attractive to new community members, sponsors and large/corporate users. To achieve this, the key is maintaining the right balance between sustainable processes (that guarantee the great quality QGIS has been known for) and an interesting and motivating grassroots project to ensure that QGIS remains an attractive project for volunteers to contribute to and help QGIS and its community to grow to become even more the reference [Open Source] GIS project.

TimeManager is dead, long live the Temporal Controller!

TimeManager turns 10 this year. The code base has made the transition from QGIS 1.x to 2.x and now 3.x and it would be wrong to say that it doesn’t show ;-)

Now, it looks like the days of TimeManager are numbered. Four days ago, Nyall Dawson has added native temporal support for vector layers to QGIS. This is part of a larger effort of adding time support for rasters, meshes, and now also vectors.

The new Temporal Controller panel looks similar to TimeManager. Layers are configured through the new Temporal tab in Layer Properties. The temporal dimension can be used in expressions to create fancy time-dependent styles:

temporal1

TimeManager Geolife demo converted to Temporal Controller (click for full resolution)

Obviously, this feature is brand new and will require polishing. Known issues listed by Nyall include limitations of supported time fields (only fields with datetime type are supported right now, strings cannot be used) and worse performance than TimeManager since features are filtered in QGIS rather than in the backend.

If you want to give the new Temporal Controller a try, you need to install the current development version, e.g. qgis-dev in OSGeo4W.


Update from May 16:

Many of the limitations above have already been addressed.

Last night, Nyall has recorded a one hour tutorial on this new feature, enjoy:

QGIS Annual General Meeting – 2020

Dear QGIS Community

We recently held our 2020 QGIS Annual General Meeting. The minutes of this meeting are available for all to view.

I would like to welcome our new QGIS Board Chair: Marco Bernasocchi and our new QGIS Board Vice-Chair and QGIS PSC Member, Alessandro Pasotti. In case you are not familiar with Marco and Alessandro, you can find short introductions to them below. I will continue to serve on the PSC and am pleased also to say that the project governance is in good hands with Jürgen Fischer, Andreas Neumann and Anita Graser kindly making themselves available to serve on the PSC for another two years. It is also great to know that our project founder, Gary Sherman, as well as long-term PSC member Tim Sutton continue to serve on the PSC as honorary PSC members. They both set the standard for our great project culture and it is great to have his continued presence.

QGIS has been growing from strength to strength, backed by a really amazing community of kind and collaborative users, developers, contributors and funders. I am looking forward to seeing how it continues to grow and flourish and I am excited and confident it will do so with Marco acting as the project chair and representative. Rock on QGIS!

Marco Bernasocchi (http://berna.io @mbernasocchi)

I am an open source advocate, consultant, teacher and developer. My background is in geography with a specialization in geographic information science. I live in Switzerland in a small Romansh speaking mountain village where I love scrambling around the mountains to enjoy the feeling of freedom it gives me. I’m a very communicative person, I fluently speak Italian, German, French English and Spanish and love travelling.

I work as director of OPENGIS.ch which I founded in 2011. Since 2015 I share the company ownership with Matthias Kuhn. At OPENGIS.ch LLC we (6 superstar devs and myself) develop, train and consult our client on any aspect related to QGIS.

My first QGIS (to be correct for that time QuantumGIS) ever was “Simon (0.6)” during my BSc when the University of Zurich was teaching us proprietary products and I started looking around for Open Source alternatives. In 2008, when starting my MSc, I made the definitive switch to ubuntu and I started working more and more with QGIS Metis (0.11) and ended developing some plugins and part of Globe as my Masters thesis. Since three years the University of Zurich invites me to hold two seminars on Entrepreneurship and Open Source. In November 2011 I attended my first Hackfest in Zürich where I started porting all QGIS dependencies and developing QGIS for Android under a Google Summer of Code. A couple of years and a lot of work later QField was born. Since then I’ve always tried to attend at least to one Hackfest per year to be able to feel first hand the strong bonds within our very welcoming community. In 2013 i was lucky enough to have a release named after a suggestion I saved you all from having QGIS 2.0 – Hönggerberg and giving you instead QGIS 2.0 – Dufour. In 2018 I’ve been honored to be nominated Co-chair of the QGIS PSC, since then I’ve been taking care of GitHub, the user groups, running votes, elections, doing some small work on the website, giving more talks on opensource advocacy and foremost helping in the day to day work needed to help our amazing project keep on growing.

Beside my long story with QGIS as user and passionate advocate I have a long story as QGIS service provider where we are fully committed to its stability, feature richness and sustainable development. For that in 2019 we started our own QGIS sustainability initiative financed through our support contracts.

Alessandro Pasotti (@elpaso https://www.itopen.it, https://www.qcooperative.net)

I am an open source software developer and I live in Italy. By education I’m an agronomist with some topography and pedology background, but I turned to the dark side early in my career and I started programming any kind of device that has a chip inside as soon as their price dropped low enough. I started using Linux in 1994 and after some real work as an R&D data analyst for a big pharmaceutical company I started my own small business that was making map-based web applications for the touristic market (there was no Google Map and such at that time) and it is for this reason that I discovered GRASS, Mapserver, PostGIS and finally QGIS when I needed a GIS viewer.

Over the years I’ve made minor contributions to several open source projects and I created a bunch of QGIS Python plugins, but it is from the QGIS Lisbon Hack-Fest in 2011 that I really got involved within the community and my first big contribution was a new website for the fast growing set of QGIS Python plugins (the one that it is already in production today at https://plugins.qgis.org ).

8 years ago I re-started to write some C++ code and I’m now a QGIS core developer and a proud member of this amazing community.

Regards

Paolo Cavallini (outgoing Chair)

QGIS video tutorials: election maps, hydrology, and more

Mapping spatial decision patterns, such as election results, is always a hot topic. That’s why we decided to include a recipe for election maps in our QGIS Map Design books. What’s new is that this recipe is now available as a free video tutorial recorded by Oliver Burdekin:

This video is just one of many recently published video tutorials that have been created by QGIS community members.

For example, Hans van der Kwast and Kurt Menke have recorded a 7-part series on QGIS for Hydrological Applications:

and Klas Karlsson’s Youtube channel is also always worth a follow:

For the Pythonically inclined among you, there is also a new version of Python in QGIS on the Automating GIS-processes channel:


(Fr) Entretien avec Vincent Picavet

Sorry, this entry is only available in French.

SLYR ESRI to QGIS compatibility suite – April 2020 update

Since the last update, our “SLYR” ESRI to QGIS compatibility suite has gained a ton of new functionality, including full support for conversion of ArcMap MXD documents (with page layouts!). In this update, we’ll explore some of the new functionality available in the tool — but instead of focusing solely on SLYR, this time we’ll also explore the enhancements we’ve been making in QGIS itself that have helped improve the quality of ArcMap document conversion.

While many of these enhancements are already available to all users of QGIS 3.12, others are exciting additions to the upcoming QGIS 3.14 release. Let’s dive in!

Improved legend customisation

One shortcoming we realised early on during our work on SLYR was that QGIS map legends just didn’t offer a comparable level of customisation as ArcMap legends. We could convert the basic layout of a legend, but we just couldn’t get the legend appearance in QGIS sufficiently close to its original appearance in the MXD file.

To address this we’ve been extending QGIS’ inbuilt legend support by adding finer control over the legend layout and spacing.

As a result, one exciting addition we’ve recently made for QGIS 3.14 is adding the ability to customise legend patch shapes and sizes on an item-by-item basis! Previously, legends in QGIS were rather boring, with all polygon layers showing as a plain rectangle and line layers as a horizontal line.

Now, users have full control over setting custom shapes for their legend patches! This makes for much more user-friendly legends, as you can now show representative shapes in your legends — e.g. a river symbol can be shown as a wiggly line, instead of an unrealistic straight horizontal line.

You can also override the size of a legend patch on an item-by-item basis too, which allows for further control over the final legend appearance. Checkout the screencast below showing both these features in action (naturally, using a legend from a converted MXD document… ArcMap users will likely recognise the fonts and patch shapes used here!)

We really wanted custom legend patch shapes to be a full first-class citizen in QGIS, so we also added support for managing them in user’s style databases. This makes it easy to setup your own libraries of custom legend shapes and share them with others. As a nice bonus, the SLYR tool even offers support for converting area and line patch shapes while converting ESRI .style databases:

Marker north arrows

Another issue we ran into while converting ArcMap page layouts was converting north arrows. QGIS used a very different approach to north arrows compared with ArcMap — in QGIS, north arrows were always based on existing SVG files, while ArcMap uses a rotated marker symbol for north arrows. Both approaches have their advantages and disadvantages, but we struggled to get good results when trying to convert ArcMap’s marker based approach to QGIS’ SVG based approach.

In the end, we weren’t happy with the result, so we took the step of implementing full support for marker symbol north arrows in QGIS 3.14. Now QGIS users have a choice of both north arrow styles — you can still create north arrows direct from SVG files, but you’ve also now got the flexibility to create them from standard marker symbols instead!

Adding support for marker based north arrows in QGIS allows us to get an perfect match when converting ESRI Page Layouts with north arrows:

Hollow and stepped line scale bars

While adding support for scale bar conversion to SLYR, we identified that some scale bar styles which are widely used in ArcMap just weren’t possible to reproduce in QGIS. Accordingly, from QGIS 3.14 on, we added native support for “Stepped line” and “Hollow” scale bar styles:

Embedded images in QGIS print layouts

ArcMap offers users the ability to directly embed images inside symbol definitions or page layouts. Whilst QGIS has offered embedded image support in symbols for a number of releases, this previously wasn’t possible to do in print layouts.

This was an issue for us while converting ArcMap page layouts, because we didn’t have any way to represent embedded images in QGIS layouts. Accordingly, for QGIS 3.14 we’ve added native support for directly embedding images (either raster images or SVG pictures) inside a page layout:

One handy consequence of this improvement is that it’s now possible to create completely self contained print layout templates for QGIS — you no longer have to separately distribute any required images (such as company logos) along with your QPT templates!

Naturally, our SLYR plugin now automatically converts any embedded images it finds in an ArcMap page layout and correctly creates a converted, embedded version of the image in the QGIS print layout.

Scalebar numeric formats

Another missing customisation in QGIS’ scale bar functionality was allowing users control over the scale bar’s number format. Previously, QGIS offered no customisation for these numbers, so you got only what QGIS decided you wanted. We improved this in QGIS 3.12 by offering users the ability to control exactly how they want their scale bar numbers to appear. There’s options for manually controlling the thousand and decimal separators, rounding, and much more:
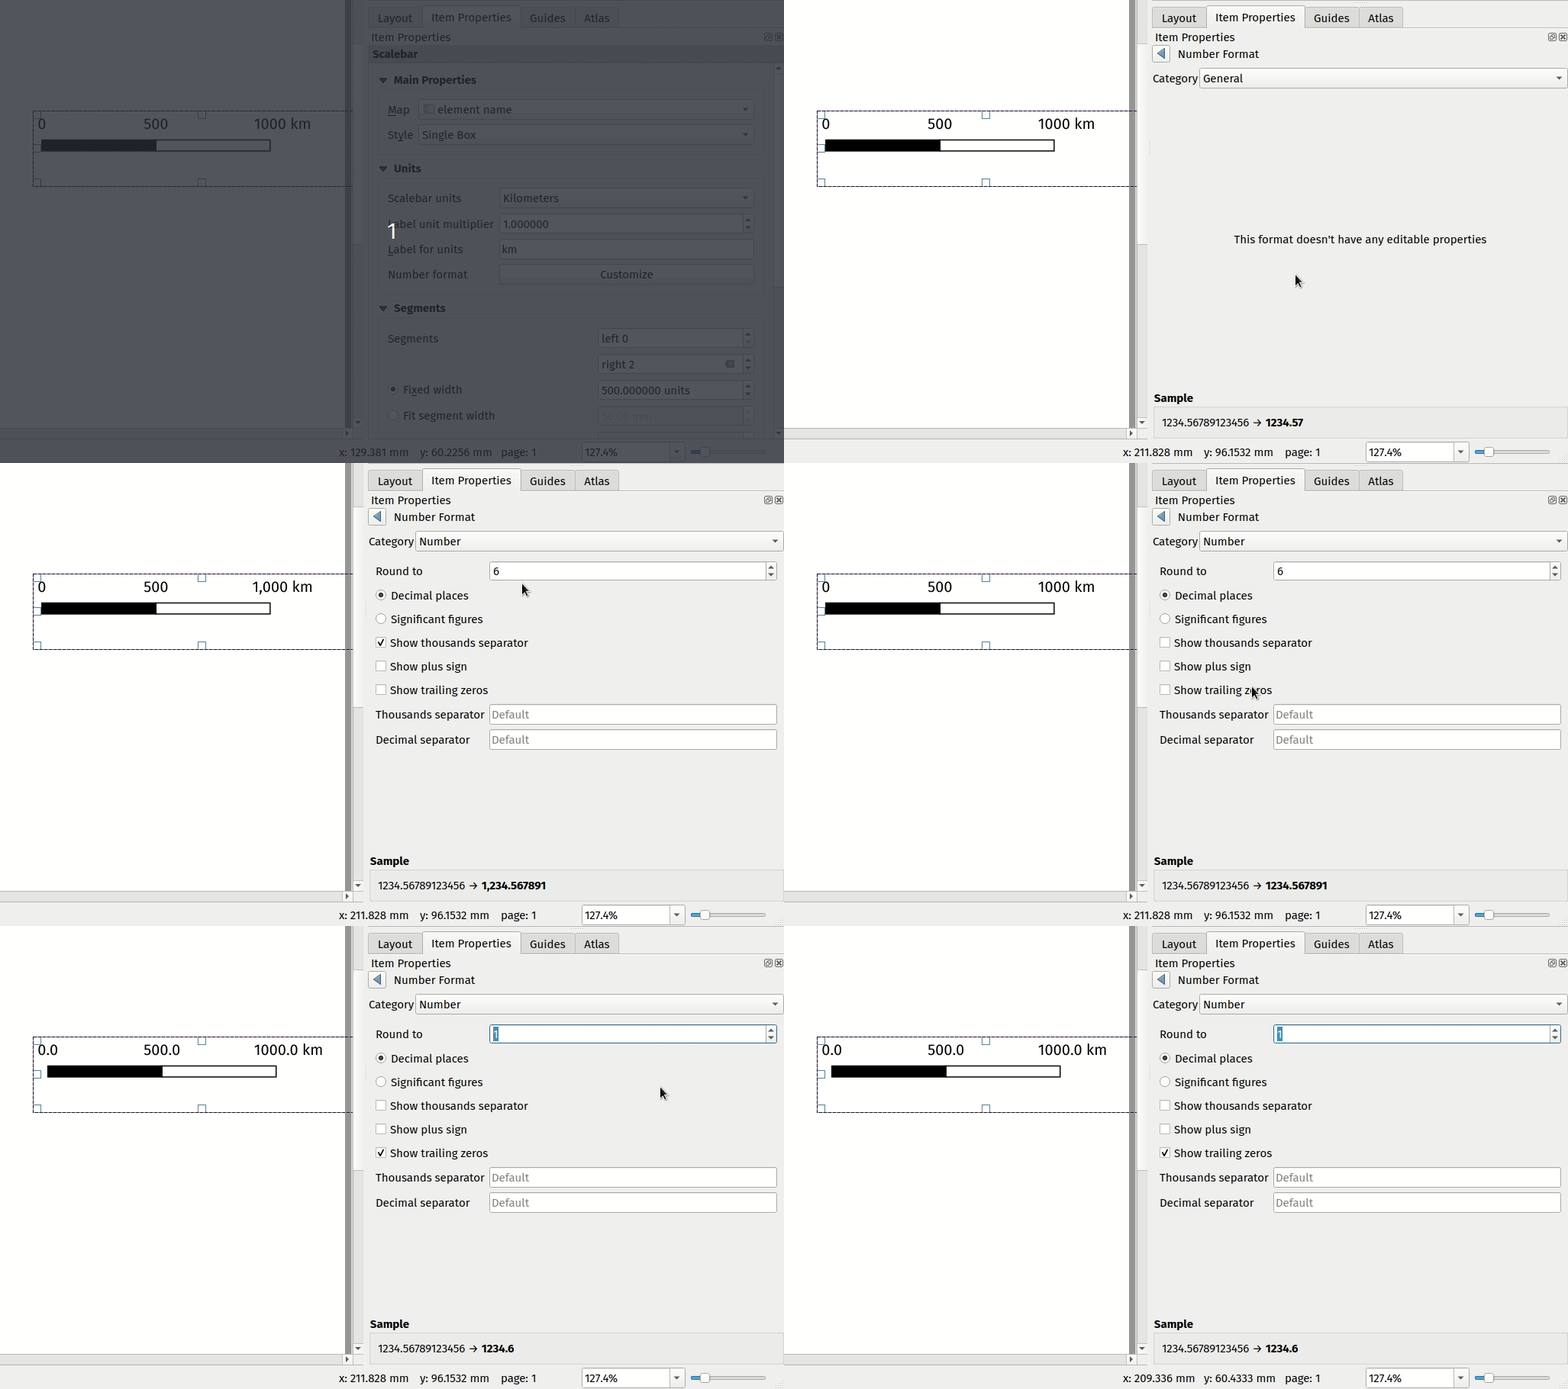
This enhancement allowed us to get an exact match when converting ArcMap scale bars — the converted results should appear identical to their original ArcMap appearance!

Random marker fill

Until recently, one of the few remaining layer symbolisation gaps between QGIS and ArcMap was that QGIS had no symbology option for randomised marker placements for fill symbols. This was a big issue for us, because without it there just wasn’t any way that SLYR could convert layers styled with ArcMap’s “dot density renderer”  or using a marker fill’s “random offset” option.

So for QGIS 3.12, we add inbuilt support for a new “Random marker fill” symbol type:

This new symbol layer type allows for randomised (or stable seed-based) placement of markers inside polygon features. You’re given the option of either an absolute number of points to show in the feature, or a density-based count which retains its dot density regardless of the map’s scale!

Aside from being a useful symbology option in it’s own right, adding this functionality allowed us to accurately convert random markers or dot density renders from ArcMap to QGIS.

Other enhancements

The highlights above are only a small subset of the work we’ve done in QGIS to improve its interoperability with ArcMap via the SLYR plugin! Some of the other work we’ve done includes:

  • Many improvements to QGIS’ bad layer handling and automatic repair functionality. For instance, QGIS now emulates ArcMap’s helpful behaviour where ALL similar broken layer paths in a document are fixed automatically after fixing the path to one broken layer. Handling broken layer paths was a pain point for our customers, so we’ve sought to make this as painless as possible.
  • Support for plugins to handle pasting content into QGIS print layouts. We use this in SLYR to offer the ability to directly copy and paste content from ArcMap page layouts into a QGIS print layout.
  • Support for plugins to hook into the standard QGIS “Open Project” dialog, offering support for opening projects of their own custom types. We use this to allow users to directly open MXD, MXT, PMF and SXD files from the QGIS Open Project menu action.
  • We’ve worked closely with the upstream proj project, to ensure that coordinate reference systems from ESRI documents are correctly matched to known EPGS/ESRI CRS definitions in certain circumstances.

Other new features in SLYR

Aside from all the goodness we’ve explored above, the latest versions of SLYR offer TONS of new functionality for conversion of ArcMap documents, including:

  • Full support for joins and relations when converting MXD documents
  • Print layouts, including support for conversion of data driven pages to QGIS print atlases and support for multi-map page layouts using multiple data frames.
  • Support for reading MXD document metadata (and converting this to QGIS document metadata)
  • Support for dragging and dropping layers direct from ArcMap or ArcCatalog to a QGIS window, respecting all the layer styling.
  • Support for AVL style conversion
  • A new tool for dumping the full structure of MXD or LYR files to a json document. This is very handy for digging right into the full internals of the documents and for diagnosing corrupted documents.
  • Full support for conversion of vector and raster layers
  • Support for converting MXD, MXT and PMF documents
  • Support for converting ArcScene SXD documents to 2-dimensional QGIS maps

Read more are the SLYR home page, or contact us today to discuss purchasing SLYR and your licensing needs!

QGIS Grants #5: Call for Grant Proposals 2020

Dear QGIS Community,

Our previous rounds of grant proposals have always been a great success (2019, 2018, 2017, 2016). We are very pleased to announce that this year’s round of grants is now available. The call is open to anybody who wants to make a funded contribution to QGIS, subject to the call conditions outlined in the application form.

The deadline for this round is 24th May 2020.

For more details, please read the introduction provided in the application form.

We look forward to seeing all your great ideas for improving QGIS!

QGIS development on macOS

We introduced a new packaging and build environment for QGIS and its dependencies for macOS. This will bring a completely new experience for QGIS macOS developers and subsequently, the users.

Overview of the changes

What is new

In 2019, we upgraded the QGIS macOS packaging to address several issues at the time. This was made possible with the help of the QGIS project and donors who supported our work.

The upgraded system had a more transparent and automated packaging approach. But it came with its own limitation. We have been using Homebrew to fetch the QGIS dependencies and to compile only QGIS for the LTR, PR and nightly releases. The main problems with this approach are:

  • Homebrew can only support one version of a package. This will limit QGIS to be built against multiple versions of, for example GDAL or Proj libraries. In one hand, we want QGIS nightlies to use more bleeding edge versions of the dependencies (e.g. for plugin or core developers) . On the other hand, using a more stable and tested versions of the dependencies for PR or LTR are not recommended (e.g. users and organisations). OSGeo4W offers the same approach for different versions of QGIS in Windows. Unfortunately, Homebrew does not offer such an option.

  • Continuous integration has been a major part of QGIS infrastructure to ensure pull requests by developers do not break workflows in certain Operating Systems. Microsoft Windows and Linux have been well supported in the CI. But with the macOS packages, it was left to user to test and report back any bugs after Pull Requests were merged to QGIS source code.

With the recent work, we have addressed both of the above issues. QGIS and almost all of its dependencies are built from sources. It will be also possible to easily integrate the code with the current CI for macOS with GitHub Workflows. This will bring more stability and control over the way we build and package QGIS for our users, whilst helping developers to identify issues with their pull requests for macOS platform, before merging them to the QGIS source code.

QGIS development on macOS

If you want to check the latest QGIS master on macOS or tweak the code to see some new exciting features, now it should be easier with the following steps, to compile QGIS from source code an a clean machine:

1. Install XCode

  • Upgrade to latest MacOS version
  • Install latest XCode from the official AppStore
  • Open XCode and accept license
  • Install command line tools from XCode, AppStore or from command line by sudo xcode-select --install

2. Install Qt and QGIS-Deps

  • Download the latest install qgis-deps script and check the version of Qt required
  • Install the required Qt version referenced from the official Qt download area. Or alternatively download qt-version.tar.gz from deps area
  • Download latest qgis-deps package too.
  • Run install_qgis_deps.bash script to install Qt in /opt/Qt/5.14.1/clang_64 and QGIS-Deps to /opt/QGIS/qgis-deps-0.3.0 folder. You may need to use root privileges or create those folders under /opt/ and assign the right permission beforehand.

3. Install other tools

  • Install Homebrew
  • Install minimal set of packages required for macOS build tools listed in this list

You may use MacPorts, Conda or other packaging system, but by the end you need cmake, git, astyle and other useful tools to be on the system PATH

4. Download and compile QGIS

  • Open the terminal (Note that the qgis-deps package is not yet signed, so you may need to add Terminal to System Preferences -> Security & Privacy -> Privacy -> Developer Tools)
  • In your work folder (e.g. ~/Projects/), clone QGIS with git clone [email protected]:qgis/QGIS.git
  • Create a build folder mkdir -p ~/Projects/build-QGIS
  • Go to the created empty directory cd ~/Projects/build-QGIS
  • Run CMake to generate the build system (use your download qgis-deps and qt package)
    QGIS_DEPS_VERSION=0.3.0;\
    QT_VERSION=5.14.1;\
    PATH=/opt/QGIS/qgis-deps-${QGIS_DEPS_VERSION}/stage/bin:$PATH;\
    cmake -DQGIS_MAC_DEPS_DIR=/opt/QGIS/qgis-deps-${QGIS_DEPS_VERSION}/stage \
        -DCMAKE_PREFIX_PATH=/opt/Qt/${QT_VERSION}/clang_64 \
        ../QGIS
    

Note that all libraries are picked from qgis-deps and not from system /usr/lib or Homebrew’s /usr/local/ or system Frameworks /Library/Frameworks/. Especially check Proj, GDAL, sqlite3 and Python paths. You should see output similar to this:

-- QGIS version: 3.13.0 Master (31300)
-- Found OpenCL: /Applications/Xcode.app/Contents/Developer/Platforms/MacOSX.platform/Developer/SDKs/MacOSX10.15.sdk/System/Library/Frameworks/OpenCL.framework (found version "1.2")
-- Found OpenCL C++ headers: /Users/peter/Projects/mesh/QGIS/external/opencl-clhpp/include
-- Found GRASS 7: /opt/QGIS/qgis-deps-0.3.0/stage/grass78 (7.8.2, off_t size = 8)
-- Looking for openpty
-- Looking for openpty - found
-- Found Proj: /opt/QGIS/qgis-deps-0.3.0/stage/lib/libproj.dylib version 6 (6.3.1)
-- Found GEOS: /opt/QGIS/qgis-deps-0.3.0/stage/lib/libgeos_c.dylib (3.8.1)
-- Found GDAL: /opt/QGIS/qgis-deps-0.3.0/stage/lib/libgdal.dylib (3.0.4)
-- Found Expat: /opt/QGIS/qgis-deps-0.3.0/stage/lib/libexpat.dylib
-- Found Spatialindex: /opt/QGIS/qgis-deps-0.3.0/stage/lib/libspatialindex.dylib
-- Found Qwt: /opt/QGIS/qgis-deps-0.3.0/stage/lib/qwt.framework (6.1.4)
-- Found LibZip: /opt/QGIS/qgis-deps-0.3.0/stage/lib/libzip.dylib
-- Found libzip: /opt/QGIS/qgis-deps-0.3.0/stage/lib/libzip.dylib
-- Found Sqlite3: /opt/QGIS/qgis-deps-0.3.0/stage/lib/libsqlite3.dylib
-- Found Protobuf: /opt/QGIS/qgis-deps-0.3.0/stage/lib/libprotobuf.dylib (found version "3.11.4")
-- Found Protobuf: /opt/QGIS/qgis-deps-0.3.0/stage/lib/libprotobuf.dylib
-- Found ZLIB: /opt/QGIS/qgis-deps-0.3.0/stage/lib/libz.dylib (found version "1.2.11")
-- Found zlib: /opt/QGIS/qgis-deps-0.3.0/stage/lib/libz.dylib
-- Found PostgreSQL: /opt/QGIS/qgis-deps-0.3.0/stage/lib/libpq.dylib
-- Found SpatiaLite: /opt/QGIS/qgis-deps-0.3.0/stage/lib/libspatialite.dylib
-- Qt WebKit support enabled
-- Found Qt version: 5.14.1
-- Found QScintilla2: /opt/QGIS/qgis-deps-0.3.0/stage/lib/libqscintilla2_qt5.dylib (2.11.4)
-- Found QtKeychain: /opt/QGIS/qgis-deps-0.3.0/stage/lib/libqt5keychain.dylib
-- Found QCA: /opt/QGIS/qgis-deps-0.3.0/stage/lib/qca-qt5.framework (2.3.0)
-- Found QCA OpenSSL plugin
-- Found Libtasn1: /opt/QGIS/qgis-deps-0.3.0/stage/include
-- Pedantic compiler settings enabled
-- Found PythonInterp: /opt/QGIS/qgis-deps-0.3.0/stage/bin/python3 (found suitable version "3.7.7", minimum required is "3")
-- Found Python executable: /opt/QGIS/qgis-deps-0.3.0/stage/bin/python3
-- Found Python version: 3.7.7
-- Found Python library: /opt/QGIS/qgis-deps-0.3.0/stage/lib/libpython3.7m.dylib
-- Found Python site-packages: /opt/QGIS/qgis-deps-0.3.0/stage/lib/python3.7/site-packages
-- Found PyQt5 version: 5.14.1
-- Found SIP version: 4.19.21
-- Found QScintilla2 PyQt module: 2.11.4
-- txt2tags not found - disabled
-- Performing Test COMPILER_HAS_HIDDEN_VISIBILITY
-- Performing Test COMPILER_HAS_HIDDEN_VISIBILITY - Success
-- Performing Test COMPILER_HAS_HIDDEN_INLINE_VISIBILITY
-- Performing Test COMPILER_HAS_HIDDEN_INLINE_VISIBILITY - Success
-- Performing Test COMPILER_HAS_DEPRECATED_ATTR
-- Performing Test COMPILER_HAS_DEPRECATED_ATTR - Success
-- Found exiv2: /opt/QGIS/qgis-deps-0.3.0/stage/lib/libexiv2.dylib
-- HDF5: Using hdf5 compiler wrapper to determine C configuration
-- Found HDF5: /opt/QGIS/qgis-deps-0.3.0/stage/lib/libhdf5.dylib;/opt/QGIS/qgis-deps-0.3.0/stage/lib/libz.dylib;/usr/lib/libdl.dylib;/usr/lib/libm.dylib (found version "1.10.0")
-- Found PkgConfig: /usr/local/bin/pkg-config (found version "0.29.2")
-- Found NetCDF: /opt/QGIS/qgis-deps-0.3.0/stage/lib/libnetcdf.dylib
-- Found LibXml2: /opt/QGIS/qgis-deps-0.3.0/stage/lib/libxml2.dylib (found version "2.9.10")
-- Looking for updwtmpx
-- Looking for updwtmpx - not found
-- Found GSL: -L/opt/QGIS/qgis-deps-0.3.0/stage/lib -lgsl -lgslcblas
-- Using PROJ 6 srs database.
-- Ctest Binary Directory set to: /Users/peter/Projects/mesh/build-QGIS/output/bin
-- Configuring done
-- Generating done
-- Build files have been written to: /Users/peter/Projects/mesh/build-QGIS
  • Compile QGIS make -j4 and wait for [100%] mark :)
  • Now you can run QGIS with command ./output/bin/QGIS.app/Contents/MacOS/QGIS or open ./output/bin/QGIS.app

Notes:

  • If you use QT Creator, you can open already generated project to modify files from it.
  • The critical CMake variable is QGIS_MAC_DEPS_DIR and you must ensure it contains valid qgis-deps installation
  • You can add more variables to CMake command to tweak the build settings, e.g. enable 3D with ‘-DWITH_3D’, etc.
  • Consult QGIS’s [INSTALL]https://github.com/qgis/QGIS/blob/master/INSTALL) for latest developement tips

Development of the QGIS-Deps package

If you want to help with development of the qgis packages on macOS, please feel free to contact [email protected]. The development is taking place on public QGIS-Mac-Packager repository.

Next steps

Currently, we are carrying out the following tasks:

  • to move all-in-one QGIS bundle for LTR/PR/nighlies to use this new package of dependencies. Check out Twitter for for any news on the packages. We are aiming to have the new packaging in place for the QGIS 3.14 release, which will bring GDAL 3 and Proj 6 to macOS users

  • to sign the qgis-deps packages, so that developers do not need to tweak Privacy settings to use it for compiling QGIS and its dependencies.

You may also like...

Mergin Maps, a field data collection app based on QGIS. Mergin Maps makes field work easy with its simple interface and cloud-based sync. Available on Android, iOS and Windows. Screenshots of the Mergin Maps mobile app for Field Data Collection
Get it on Google Play Get it on Apple store

PyQGIS Cookbook revision 2020

We are happy to announce that the PyQGIS Cookbook has received a complete overhaul and is now better than ever.

The PyQGIS Cookbook is a great source of information, not only for PyQGIS beginners or plugin developers, but also for C++ developers: it contains a lot of information about the internals of the QGIS API that you cannot really find anywhere else.

The main point addressed in this review were:

  1. All the code snippets have been reviewed and put under automated test in CI. Before this revision, there were 62 tests. Now there are over 300 tested snippets.
  2. A few snippets had to be updated because of changes in the QGIS API or because of the deprecation of methods (CRS handling in particular due to the proj6 switch).
  3. Textual descriptions have been edited to update the contents where the API has substantially changed.
  4. The material covering Python for QGIS Server has been reorganized and now includes new snippets and introductory texts about the new modules and OGC APIs architecture.

For the full summary, please refer to Alessandro Pasotti’s report on the PSC mailing list.

Thank you to Alessandro Pasotti for taking on this project and thank you to all our sponsor and donors who make this initiative possible!

Super-quick interactive data & parameter exploration

This post introduces Holoviz Panel, a library that makes it possible to create really quick dashboards in notebook environments as well as more sophisticated custom interactive web apps and dashboards.

The following example shows how to use Panel to explore a dataset (a trajectory collection in this case) and different parameter settings (relating to trajectory generalization). All the Panel code we need is a dict that defines the parameters that we want to explore. Then we can use Panel’s interact function to automatically generate a dashboard for our custom plotting function:

import panel as pn

kw = dict(traj_id=(1, len(traj_collection)), 
          tolerance=(10, 100, 10), 
          generalizer=['douglas-peucker', 'min-distance'])
pn.interact(plot_generalized, **kw)

Click to view the resulting dashboard in full resolution:

The plotting function uses the parameters to generate a Holoviews plot. First it fetches a specific trajectory from the trajectory collection. Then it generalizes the trajectory using the specified parameter settings. As you can see, we can easily combine maps and other plots to visualize different aspects of the data:

def plot_generalized(traj_id=1, tolerance=10, generalizer='douglas-peucker'):
  my_traj = traj_collection.get_trajectory(traj_id).to_crs(CRS(4088))
  if generalizer=='douglas-peucker':
    generalized = mpd.DouglasPeuckerGeneralizer(my_traj).generalize(tolerance)
  else:
    generalized = mpd.MinDistanceGeneralizer(my_traj).generalize(tolerance)
  generalized.add_speed(overwrite=True)
  return ( 
    generalized.hvplot(
      title='Trajectory {} (tolerance={})'.format(my_traj.id, tolerance), 
      c='speed', cmap='Viridis', colorbar=True, clim=(0,20), 
      line_width=10, width=500, height=500) + 
    generalized.df['speed'].hvplot.hist(
      title='Speed histogram', width=300, height=500) 
    )

Trajectory collections and generalization functions used in this example are part of the MovingPandas library. If you are interested in movement data analysis, you should check it out! You can find this example notebook in the MovingPandas tutorial section.

  • <<
  • Page 26 of 141 ( 2808 posts )
  • >>

Back to Top

Sustaining Members