Related Plugins and Tags

QGIS Planet

Successful crowdfunding for vector tile support in QGIS

We are delighted to announce that the crowdfunding to support Vector Tiles in QGIS has been successful!

Here is the list of donors who have supported us and the wider QGIS user by funding this feature.

List of donors

(in no particular order)

Also many thanks to those who spread the word and offered us moral support!

You may also like...

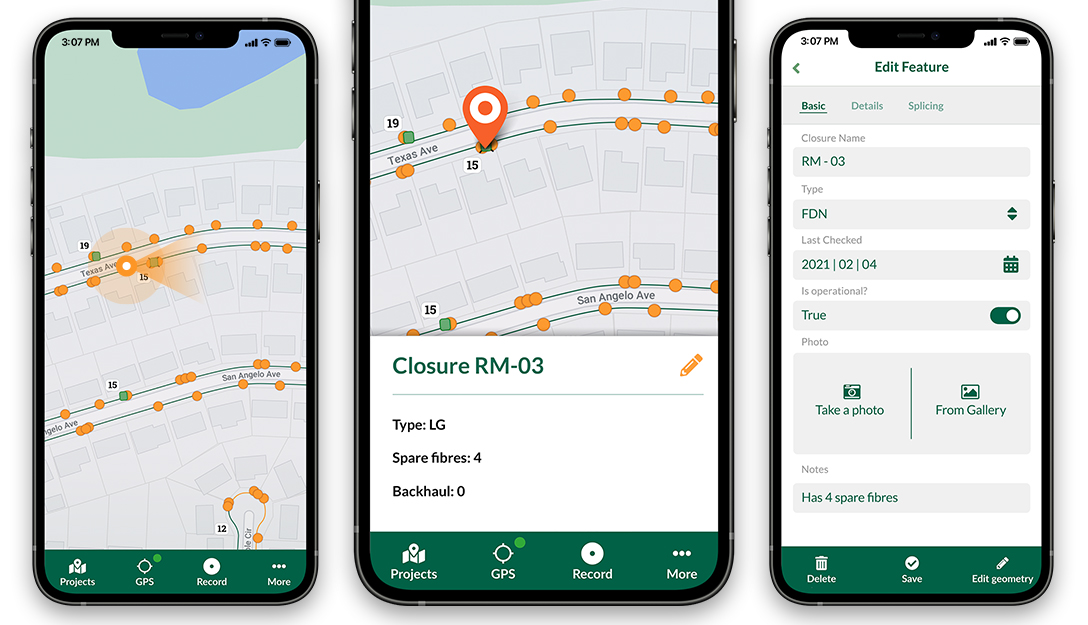
Mergin Maps, a field data collection app based on QGIS. Mergin Maps makes field work easy with its simple interface and cloud-based sync. Available on Android, iOS and Windows. Screenshots of the Mergin Maps mobile app for Field Data Collection
Get it on Google Play Get it on Apple store

LTR usage survey

Back in 2018, we asked QGIS users how often they use QGIS and how often they upgrade. Today, we want to find out more about how different user groups and organisations use QGIS and particularly the LTR. You may be aware of ongoing discussions concerning potentially extending the LTR period and other potential steps to further improve user experience.

To better understand the needs of our QGIS community, we therefore invite you to our new LTR usage survey:

https://ee.kobotoolbox.org/single/::nKmWHGWv


Update as posted on the mailing list: 

Thanks to all respondents, we’ve collected over 1,600 responses to this questionnaire!

Some interesting tidbits:

  1. The LTR concept seems to be well accepted: 50% of respondents use 3.10 LTR, 38% use 3.12, and 16% use 3.4 LTR.
  2. Most respondents install patch versions but 27% do so less often than every 6 months.
  3. Most respondents install .0 releases but 17% wait until .3 or longer
  4. 6% of respondents work in organizations with more than >100 users. It will be interesting to look at those responses separately.
  5. 7% say that they still need 32bit installers

You can find the raw survey responses here:

https://drive.google.com/open?id=1lECEhusQcpDpb50MSMYP_5BDfEl4jXeV

QGIS Events Cancellation

Dear QGIS Community:

Due to the uncertainty caused by rapidly unfolding global events related to the COVID-19 virus, we have decided to cancel all in-person QGIS events until further notice. This includes the 25th QGIS Contributor meeting and User Conference that was scheduled to be held this year in Nødebo, Denmark. In the interim, we will pursue ways to meet virtually from time to time, and of course, continue working using our normal collaboration process via email and GitHub.

Thank you for your understanding,

The QGIS Team

Recording tracks using QGIS and Input app

In this post, we will use Input app to record tracks. The first step is to set up a project in QGIS.

Quick recap

In the previous tutorial, we set up a simple QGIS project and transferred it to our devices using the Mergin service.

In this tutorial we are going to set up a new survey project with more advanced features:

  • Forms with more options
  • Different background layers (aerial imagery and street map)
  • Using different geometry type of survey layer
  • Exploring other Input app functions

Software needed

To start with, you will need to install the following software applications:

In addition, you will need to register with the Mergin service. The Mergin service allows you to transfer data between your PC/laptop and mobile/table via the cloud. Note that after signing up to the Mergin service, you have to activate the account by clicking on the link sent to your email.

Configuring QGIS project

Similar to the previous tutorial, we are going to start with a blank QGIS project. All the data and the project will be stored locally on a folder called recording tracks.

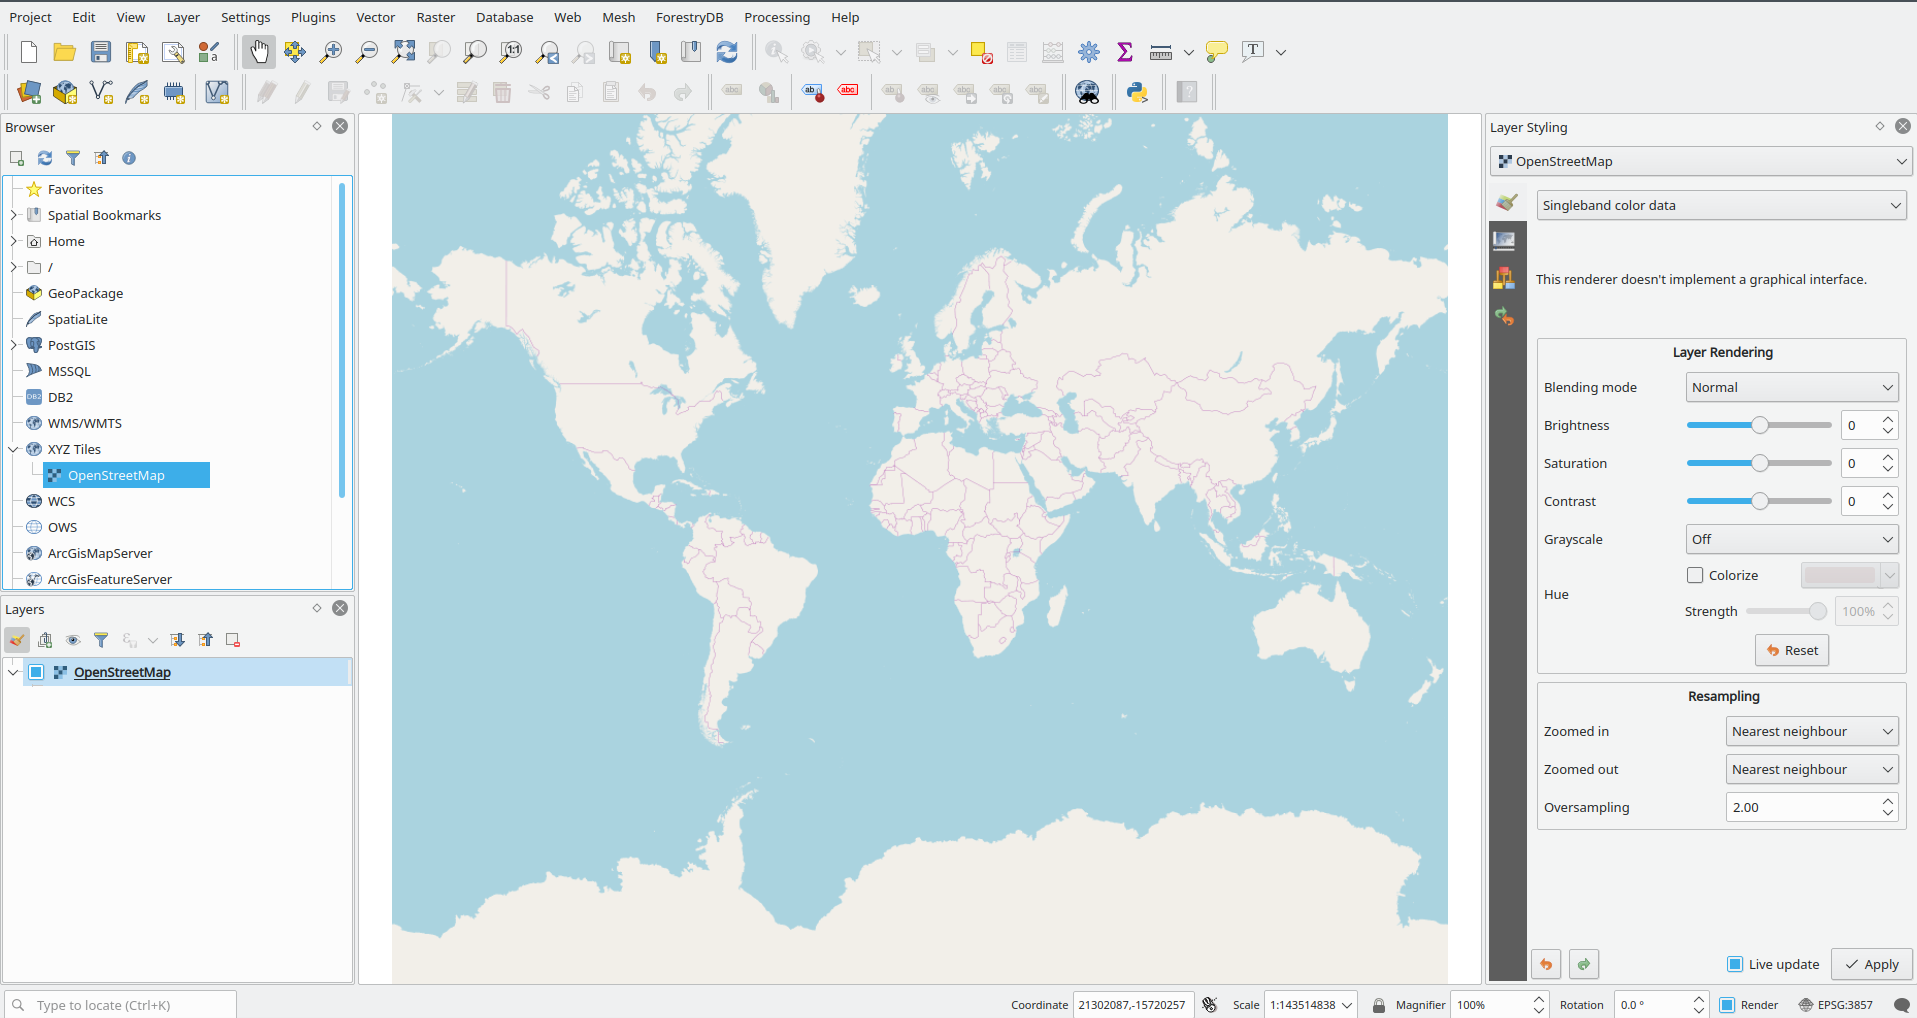
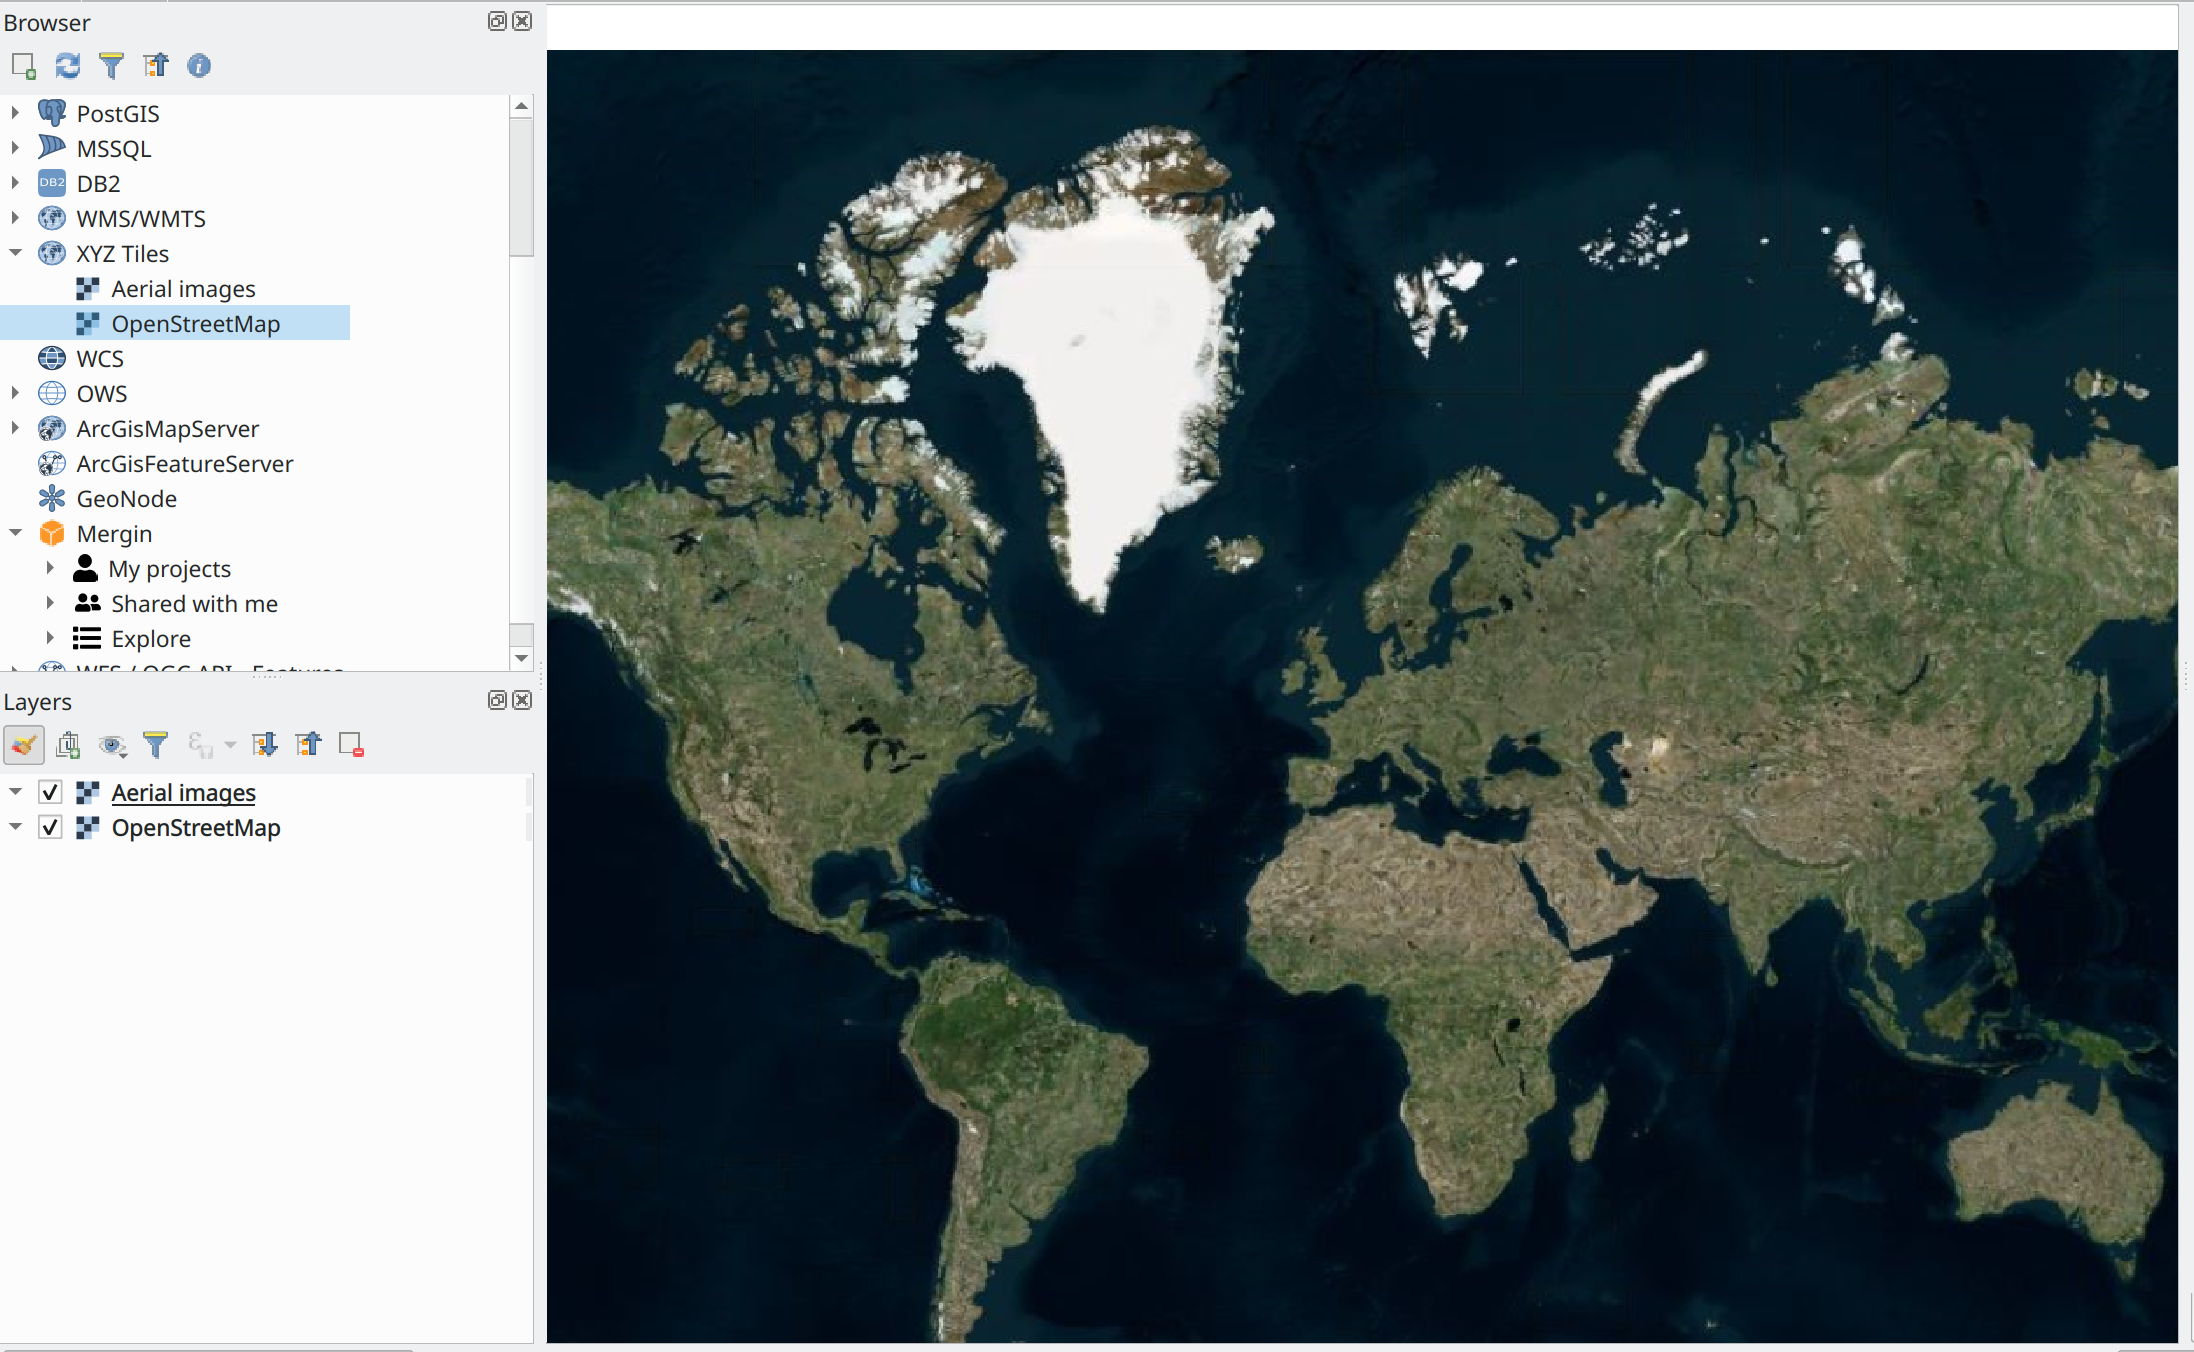
First, start a QGIS project and add the OpenStreetMap layer under XYZ Tiles. You can add also add aerial imagery as an XYZ layer to your QGIS.

Project setup

Save your project as tracks in the recording tracks folder.

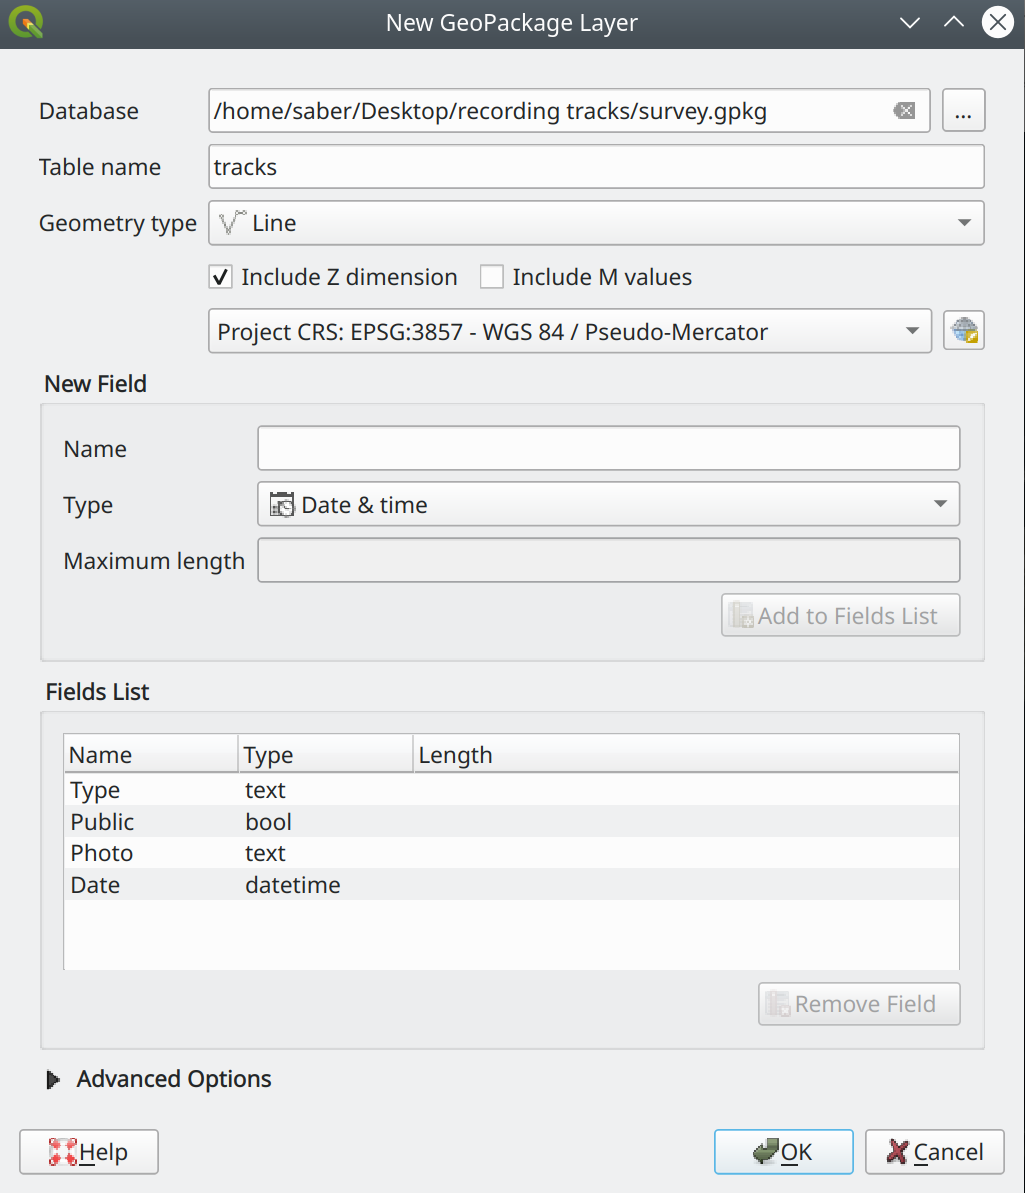
In addition, we need to create a Geopackage survey layer. Below are the attribute columns for your survey layer. Also note that need to select Line as geometry type.

To create a survey layer, in QGIS, from the main menu select Layer > Create Layer > New Geopackage Layer …. A new window will appear:

For Database click on and select the recording tracks folder then type survey.gpkg for the name of your database.

For Table name, type tracks.

For Geometry type, select Line.

You can select the option to Include Z dimension. The upcoming version of Input app supports capturing altitude from your device (or external GPS device tethered with your phone/tablet).

For Coordinate Reference System (CRS), select WGS 84 / Pseudo-Mercator EPSG:3857.

Add the following Fields. Note, different field types:

  • Type field type as text
  • Public field type as Boolean or bool
  • Photo field type as text
  • Date field type as Date & time

Geopackage survey layer

Click OK to create and add the layer to your QGIS session.

Styling layers and setting up forms

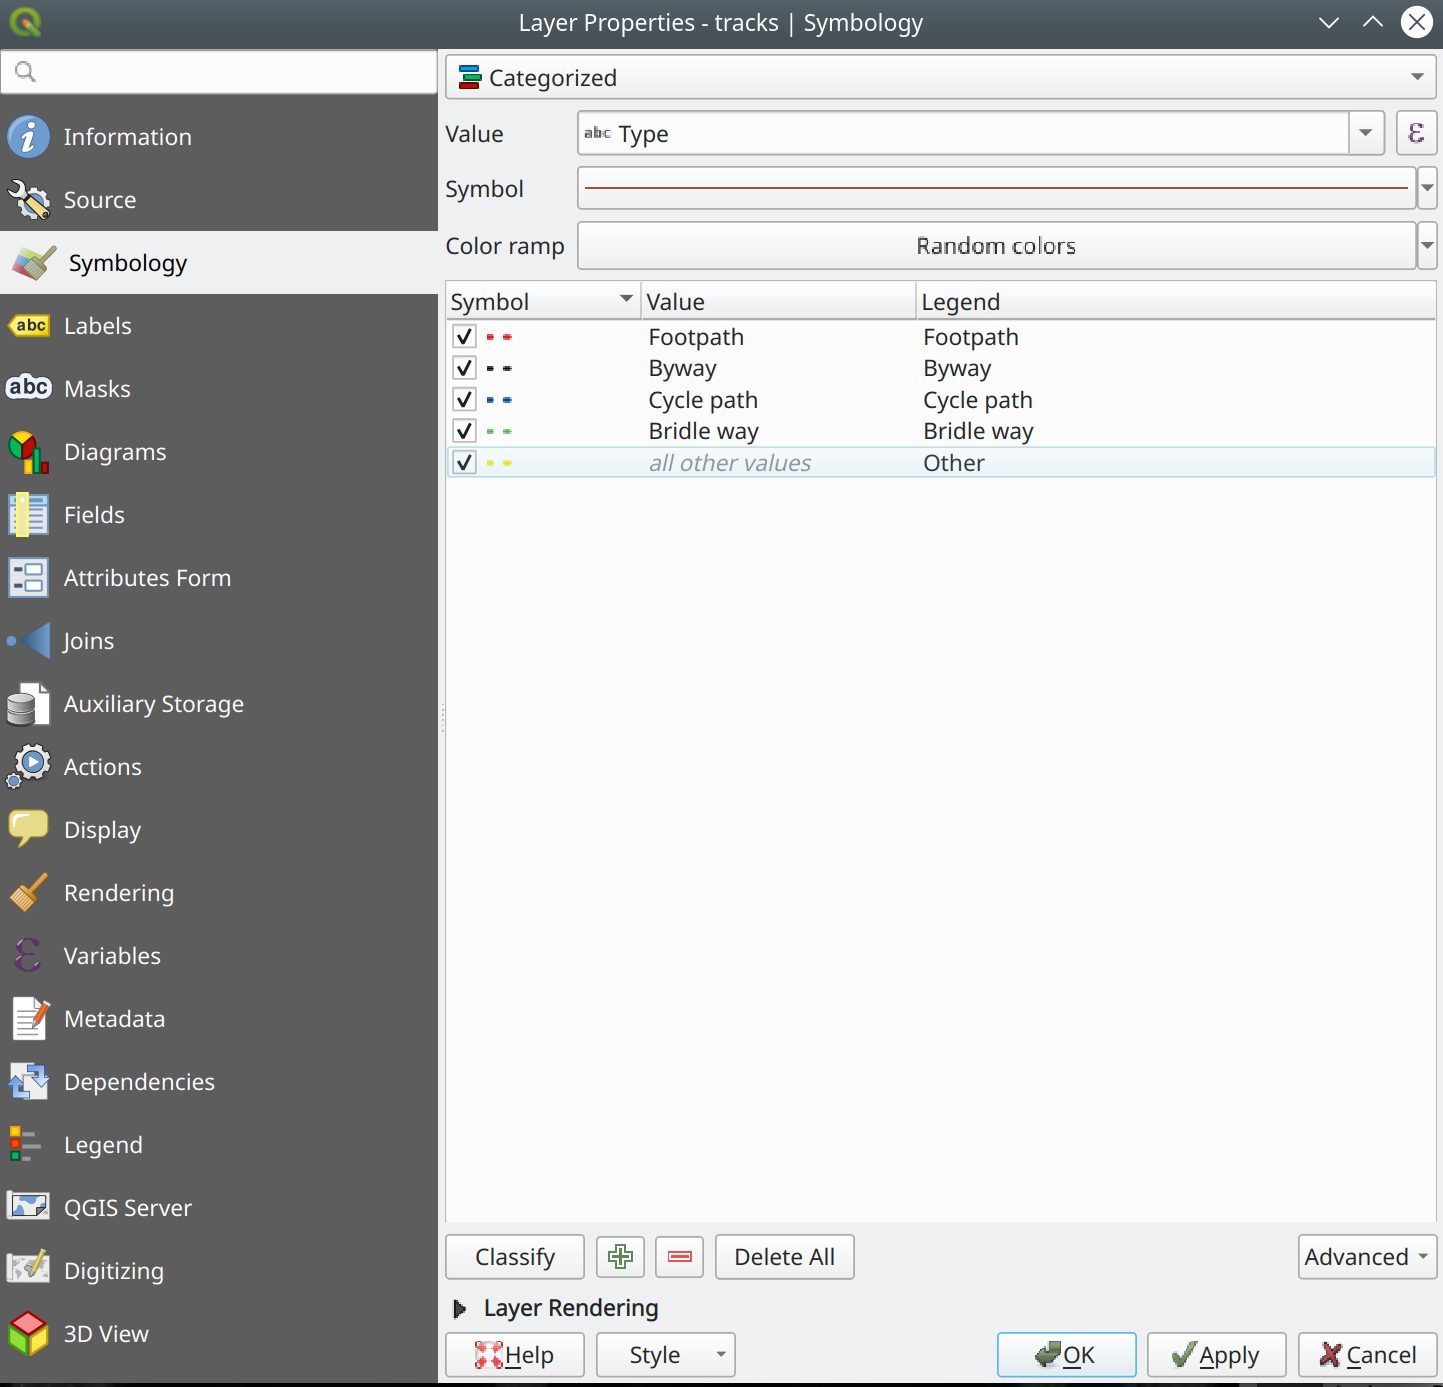
We are going to style the tracks layer based on Type field and use four categories:

  • Footpath
  • Byway
  • Cycle path
  • Bridle way

In the Layer Panels right-click on tracks layer and select Properties. A new window will appear. From the left panel, select Symbology. Change the styling from Single to Categorized on the top left section of the window. For the Value, select Type from the drop-down menu.

In the bottom-left section of the window, click on Classify. Then add 4 classes (by adding the green plus adjacent to Classify) for track types. In addition, we can add another class for Other types. Adjust the colours and line style accordingly:

Setting up style

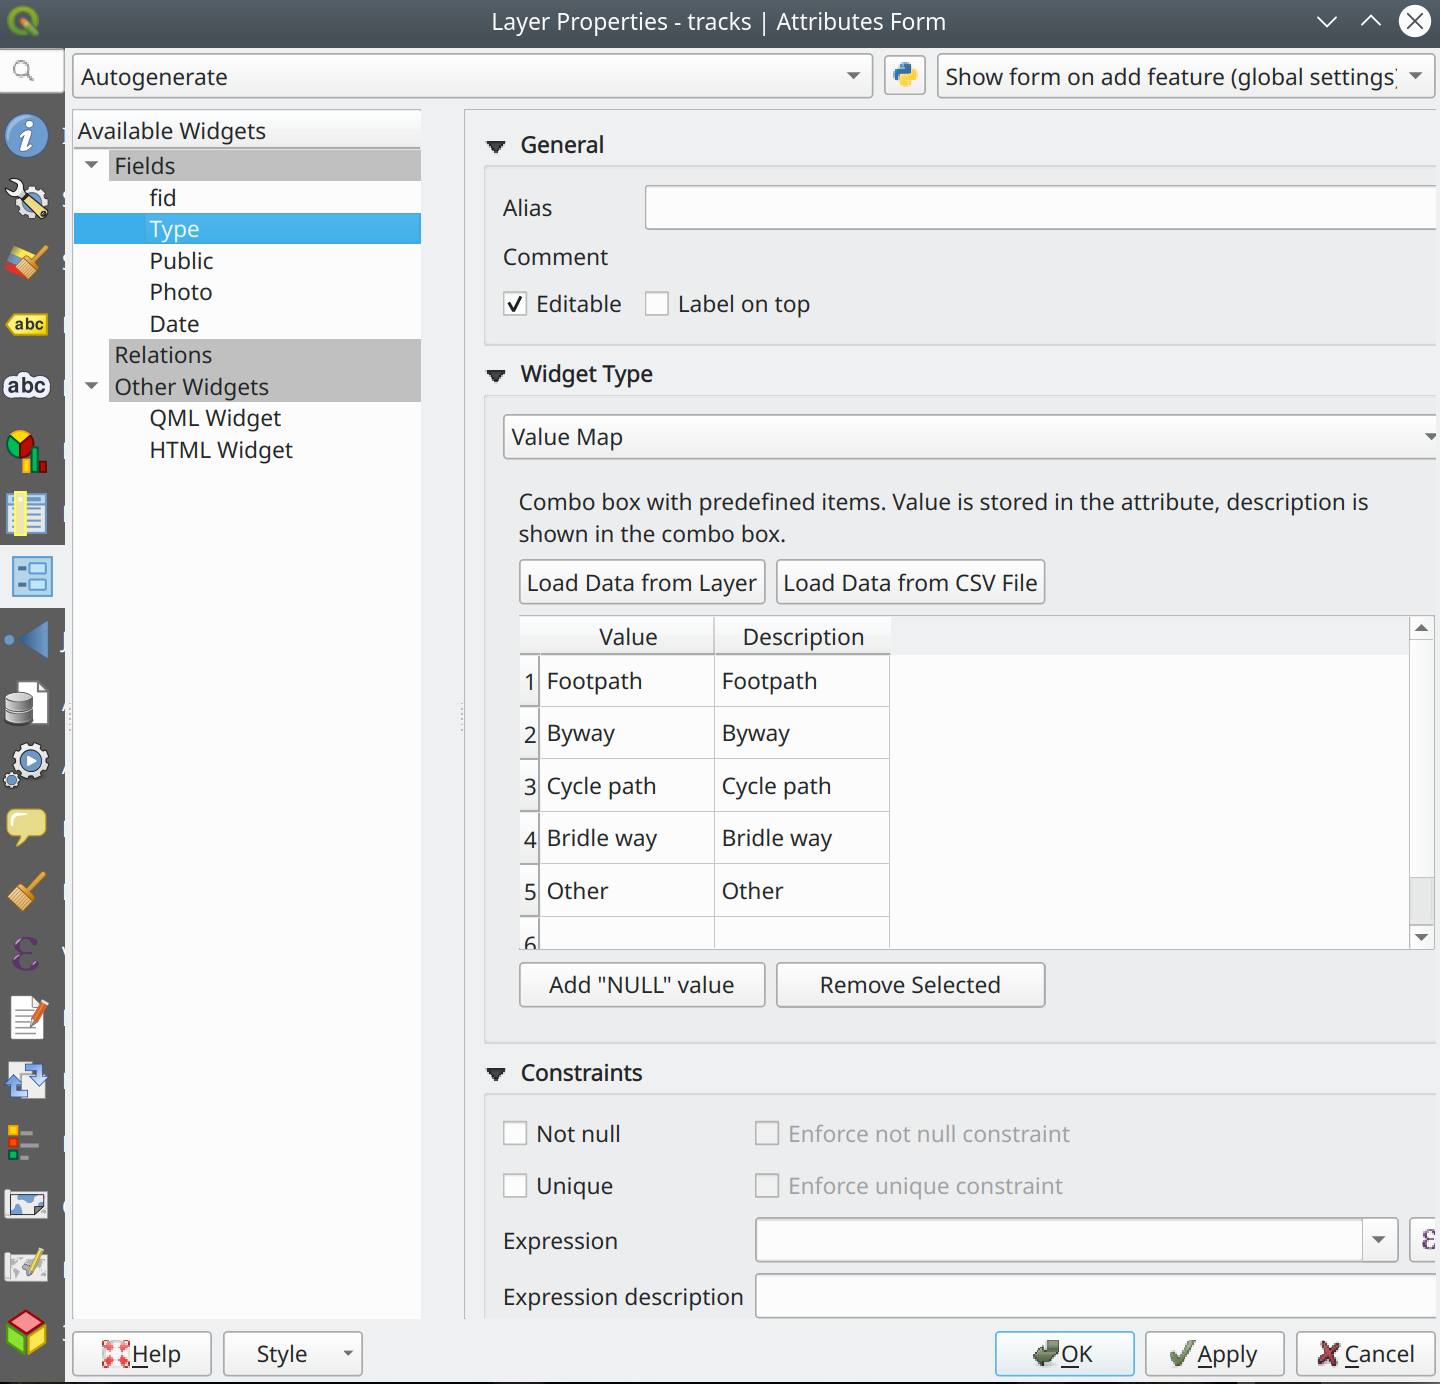
To set up the form, select Attribute forms from the left panel of the layer properties window. Adjust the Widget type as below:

  • For fid, select Hidden
  • For Type, select Value map and add the 5 categories (Footpath, Byway, Cycle path, Bridle way and Other) for Value and Description section (see image below)
  • For Public, select Checkbox
  • For Photo, select Attachment and select the option for Relative path
  • For Date, select Date/Time

Setting up forms

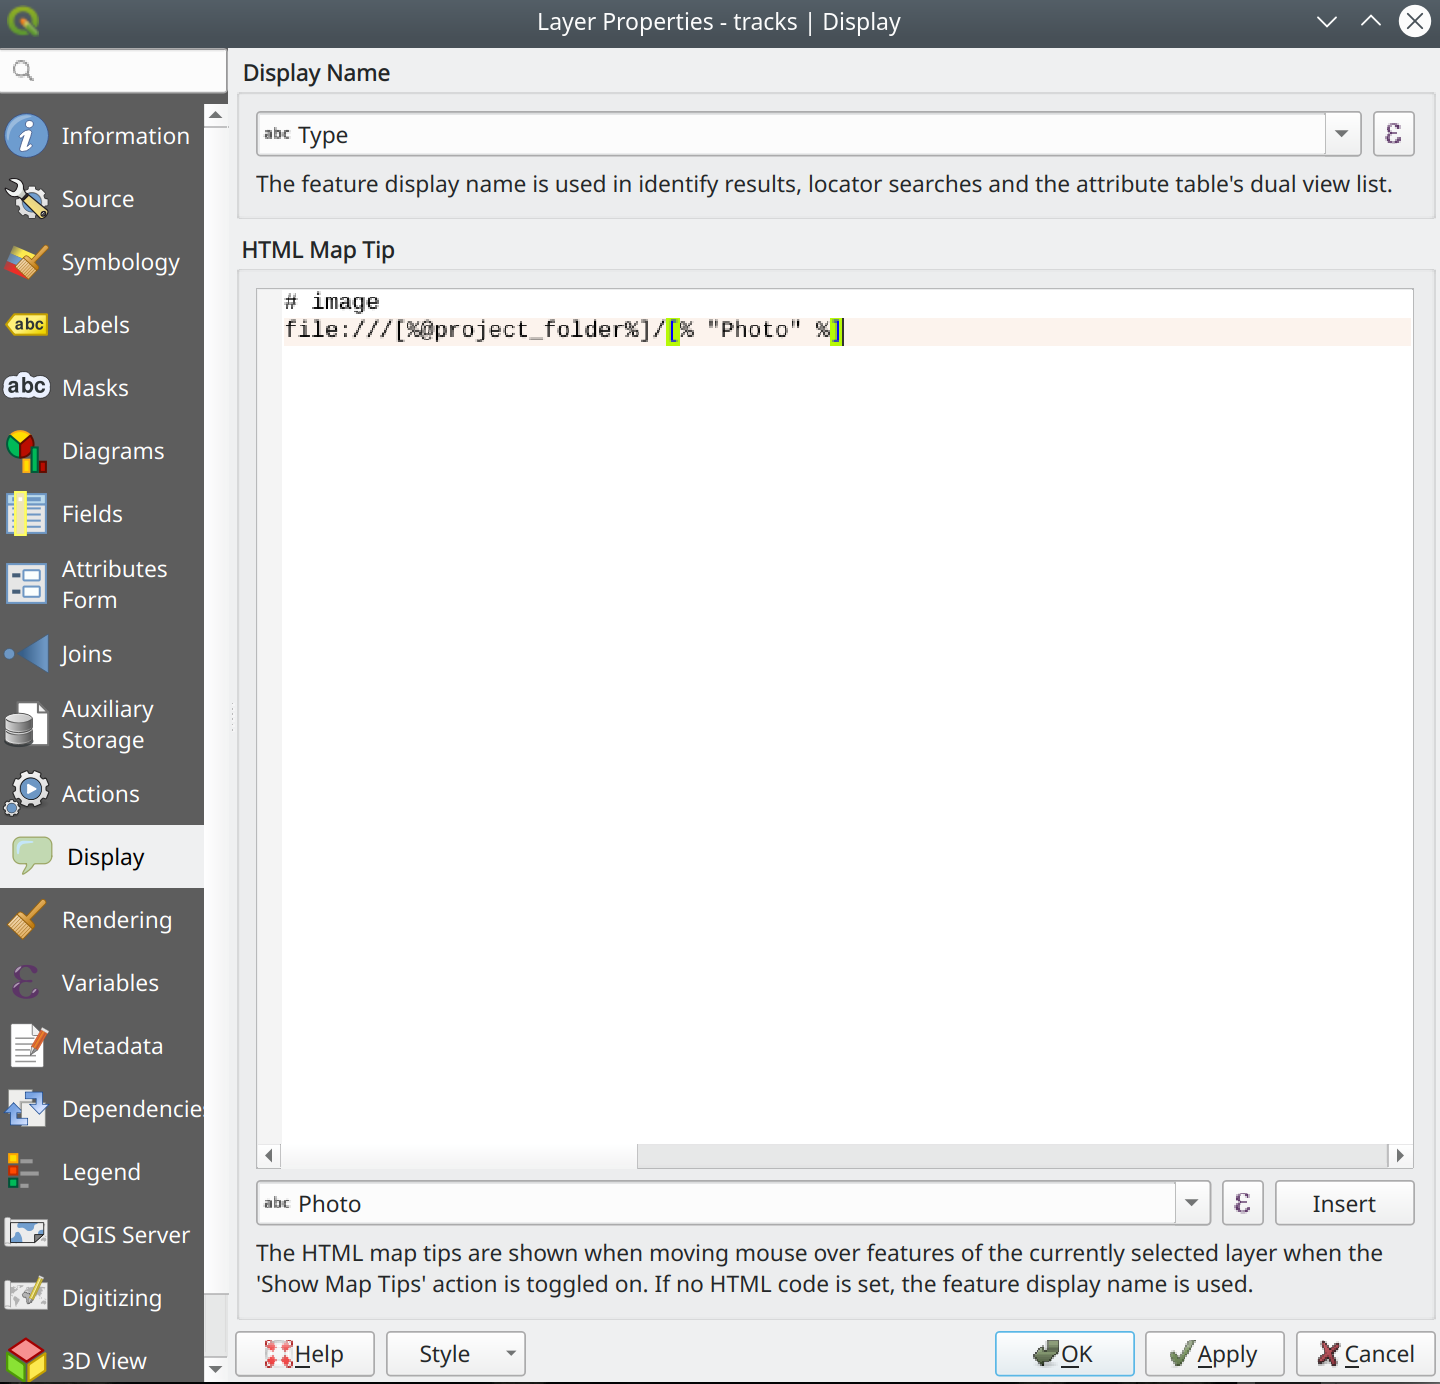
Input app allows you to have a custom pop-up drawer window when you tap on feature. To customise that, you can change the Display settings under the layer properties window. For Display name select Type and in the HTML Map Tip section type:

# image file:///[%@project_folder%]/[% "Photo" %]

Custom pop-up

Setting up map themes

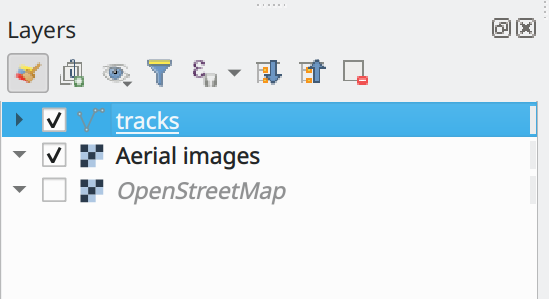
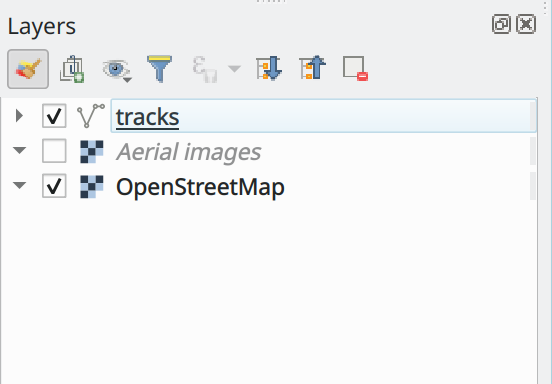
We can set up two different map themes: one with aerial imagery and one with street map. To do that, ensure you have only the following layers are set to visible in your layer panel:

  • tracks
  • Aerial images

Layer visibility

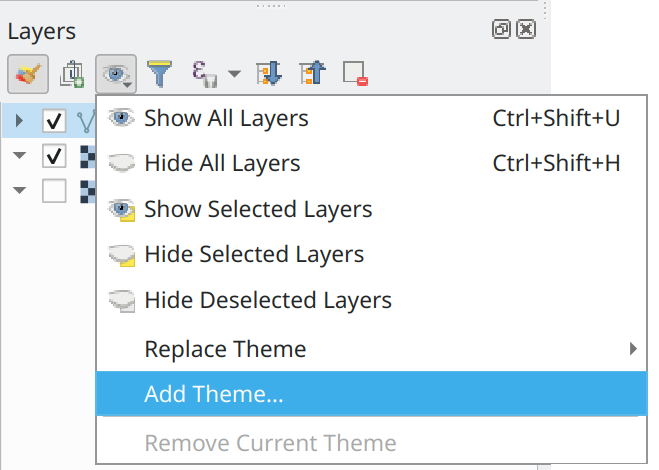
On top of the layers panel, select Manage Map Themes > Add Theme …

Creating a new theme

A new window will appear. Type Aerial photo for the name of your map theme and press OK.

Now, turn off your Aerial images layer in the layer panel and turn on the OpenStreetMap layer:

OSM theme in QGIS

You can now add a new map theme and call it Street map.

Save your project and transfer your data and project to your phone through the Mergin service as described in the previous tutorial.

If you missed a step, you can see the final version of the project here. You can also skip the above section by cloning the project in the above link.

Recording tracks using Input app

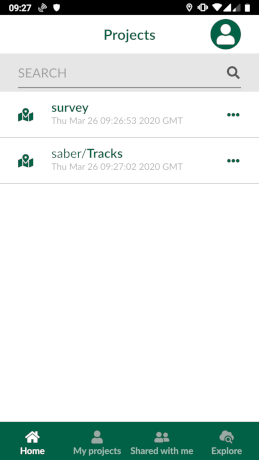
In Input app, download and open Tracks project.

Downloading a project

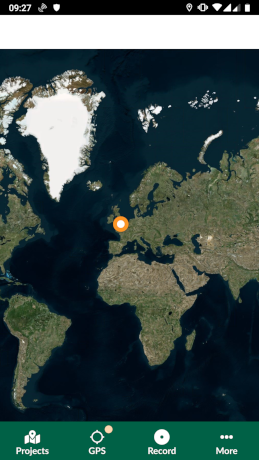
Map view in Input

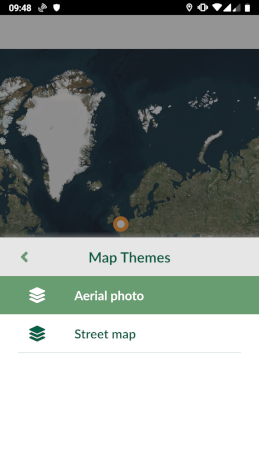
You can easily change between different map themes in Input, by going to (… More) > Map Themes:

Selecting theme in Input

OSM map theme

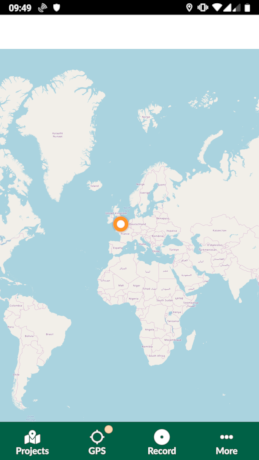
To capture tracks, press Record button in the lower panel in Input. A green cross will appear, centred on your GPS location. You can capture a line in two different methods:

  • Adding points to form the line by moving the map and pressing Add Point
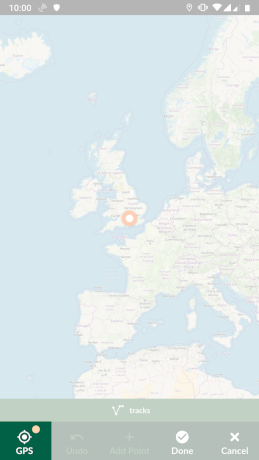
  • Streaming GPS location while moving to form a line. To do that, press and hold GPS icon on the bottom left of your screen (see image below)

Streaming GPS

You can change the frequency of adding points when streaming GPS location, under Settings in Input. Also note that the GPS streaming can be done for polygon survey layer.

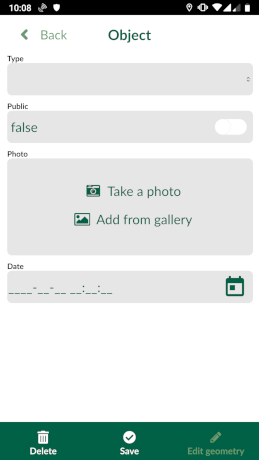
Once you finished capturing the track, press Done and you will be presented with a form:

Forms

You can easily fill the form using the drop-down menu for Type and checkbox option for Public.

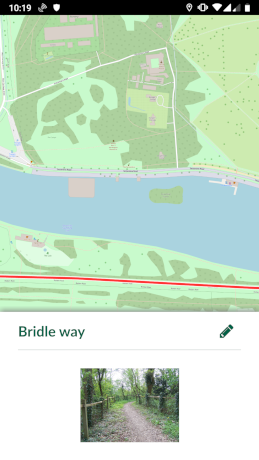
By tapping on tracks on the map, you will should be able to see a small preview window presenting Type and Photo:

Preview panel

After completion of the survey, you can synchronise your data back through the Mergin and see the results in QGIS desktop.

MovingPandas v0.3 released!

MovingPandas has come a long way since 2018 when I started to experiment with GeoPandas for trajectory data handling.

This week, MovingPandas passed peer review and was approved for pyOpenSci. This technical review process was extremely helpful in ensuring code, project, and documentation quality. I would strongly recommend it to everyone working on new data science libraries!

The lastest v0.3 release is now available from conda-forge.

All tutorials are available on MyBinder

New features include:

  • Support for GeoPandas 0.7
  • Trajectory collection aggregation functions to generate flow maps


Movement data in GIS #29: power your web apps with movement data using mobilitydb-sqlalchemy

This is a guest post by Bommakanti Krishna Chaitanya @chaitan94

Introduction

This post introduces mobilitydb-sqlalchemy, a tool I’m developing to make it easier for developers to use movement data in web applications. Many web developers use Object Relational Mappers such as SQLAlchemy to read/write Python objects from/to a database.

Mobilitydb-sqlalchemy integrates the moving objects database MobilityDB into SQLAlchemy and Flask. This is an important step towards dealing with trajectory data using appropriate spatiotemporal data structures rather than plain spatial points or polylines.

To make it even better, mobilitydb-sqlalchemy also supports MovingPandas. This makes it possible to write MovingPandas trajectory objects directly to MobilityDB.

For this post, I have made a demo application which you can find live at https://mobilitydb-sqlalchemy-demo.adonmo.com/. The code for this demo app is open source and available on GitHub. Feel free to explore both the demo app and code!

In the following sections, I will explain the most important parts of this demo app, to show how to use mobilitydb-sqlalchemy in your own webapp. If you want to reproduce this demo, you can clone the demo repository and do a “docker-compose up –build” as it automatically sets up this docker image for you along with running the backend and frontend. Just follow the instructions in README.md for more details.

Declaring your models

For the demo, we used a very simple table – with just two columns – an id and a tgeompoint column for the trip data. Using mobilitydb-sqlalchemy this is as simple as defining any regular table:

from flask_sqlalchemy import SQLAlchemy
from mobilitydb_sqlalchemy import TGeomPoint

db = SQLAlchemy()

class Trips(db.Model):
   __tablename__ = "trips"
   trip_id = db.Column(db.Integer, primary_key=True)
   trip = db.Column(TGeomPoint)

Note: The library also allows you to use the Trajectory class from MovingPandas as well. More about this is explained later in this tutorial.

Populating data

When adding data to the table, mobilitydb-sqlalchemy expects data in the tgeompoint column to be a time indexed pandas dataframe, with two columns – one for the spatial data  called “geometry” with Shapely Point objects and one for the temporal data “t” as regular python datetime objects.

from datetime import datetime
from shapely.geometry import Point

# Prepare and insert the data
# Typically it won’t be hardcoded like this, but it might be coming from 
# other data sources like a different database or maybe csv files
df = pd.DataFrame(
   [
       {"geometry": Point(0, 0), "t": datetime(2012, 1, 1, 8, 0, 0),},
       {"geometry": Point(2, 0), "t": datetime(2012, 1, 1, 8, 10, 0),},
       {"geometry": Point(2, -1.9), "t": datetime(2012, 1, 1, 8, 15, 0),},
   ]
).set_index("t")

trip = Trips(trip_id=1, trip=df)
db.session.add(trip)
db.session.commit()

Writing queries

In the demo, you see two modes. Both modes were designed specifically to explain how functions defined within MobilityDB can be leveraged by our webapp.

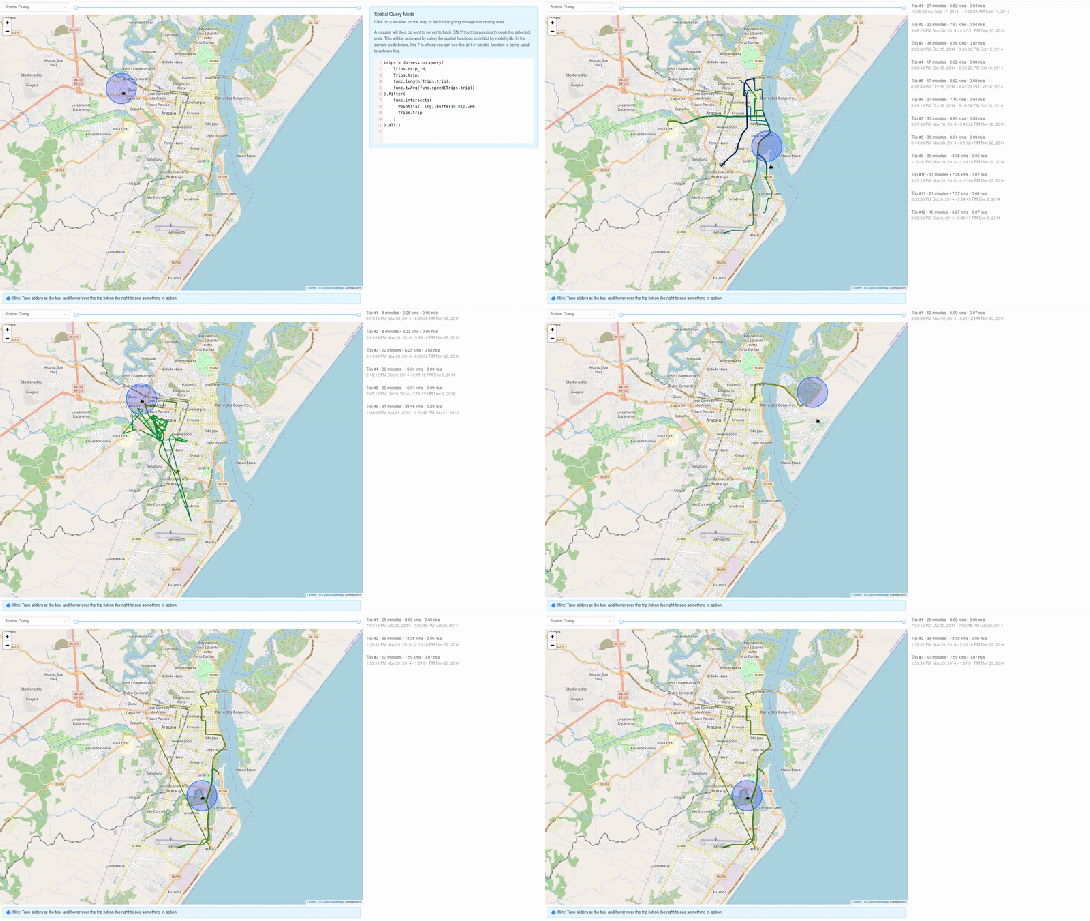
1. All trips mode – In this mode, we extract all trip data, along with distance travelled within each trip, and the average speed in that trip, both computed by MobilityDB itself using the ‘length’, ‘speed’ and ‘twAvg’ functions. This example also shows that MobilityDB functions can be chained to form more complicated queries.

mobilitydb-sqlalchemy-demo-1

trips = db.session.query(
   Trips.trip_id,
   Trips.trip,
   func.length(Trips.trip),
   func.twAvg(func.speed(Trips.trip))
).all()

2. Spatial query mode – In this mode, we extract only selective trip data, filtered by a user-selected region of interest. We then make a query to MobilityDB to extract only the trips which pass through the specified region. We use MobilityDB’s ‘intersects’ function to achieve this filtering at the database level itself.

mobilitydb-sqlalchemy-demo-2

trips = db.session.query(
   Trips.trip_id,
   Trips.trip,
   func.length(Trips.trip),
   func.twAvg(func.speed(Trips.trip))
).filter(
   func.intersects(Point(lat, lng).buffer(0.01).wkb, Trips.trip),
).all()

Using MovingPandas Trajectory objects

Mobilitydb-sqlalchemy also provides first-class support for MovingPandas Trajectory objects, which can be installed as an optional dependency of this library. Using this Trajectory class instead of plain DataFrames allows us to make use of much richer functionality over trajectory data like analysis speed, interpolation, splitting and simplification of trajectory points, calculating bounding boxes, etc. To make use of this feature, you have set the use_movingpandas flag to True while declaring your model, as shown in the below code snippet.

class TripsWithMovingPandas(db.Model):
   __tablename__ = "trips"
   trip_id = db.Column(db.Integer, primary_key=True)
   trip = db.Column(TGeomPoint(use_movingpandas=True))

Now when you query over this table, you automatically get the data parsed into Trajectory objects without having to do anything else. This also works during insertion of data – you can directly assign your movingpandas Trajectory objects to the trip column. In the below code snippet we show how inserting and querying works with movingpandas mode.

from datetime import datetime
from shapely.geometry import Point

# Prepare and insert the data
# Typically it won’t be hardcoded like this, but it might be coming from 
# other data sources like a different database or maybe csv files
df = pd.DataFrame(
   [
       {"geometry": Point(0, 0), "t": datetime(2012, 1, 1, 8, 0, 0),},
       {"geometry": Point(2, 0), "t": datetime(2012, 1, 1, 8, 10, 0),},
       {"geometry": Point(2, -1.9), "t": datetime(2012, 1, 1, 8, 15, 0),},
   ]
).set_index("t")

geo_df = GeoDataFrame(df)
traj = mpd.Trajectory(geo_df, 1)

trip = Trips(trip_id=1, trip=traj)
db.session.add(trip)
db.session.commit()

# Querying over this table would automatically map the resulting tgeompoint 
# column to movingpandas’ Trajectory class
result = db.session.query(TripsWithMovingPandas).filter(
   TripsWithMovingPandas.trip_id == 1
).first()

print(result.trip.__class__)
# <class 'movingpandas.trajectory.Trajectory'>

Bonus: trajectory data serialization

Along with mobilitydb-sqlalchemy, recently I have also released trajectory data serialization/compression libraries based on Google’s Encoded Polyline Format Algorithm, for python and javascript called trajectory and trajectory.js respectively. These libraries let you send trajectory data in a compressed format, resulting in smaller payloads if sending your data through human-readable serialization formats like JSON. In some of the internal APIs we use at Adonmo, we have seen this reduce our response sizes by more than half (>50%) sometimes upto 90%.

Want to learn more about mobilitydb-sqlalchemy? Check out the quick start & documentation.


This post is part of a series. Read more about movement data in GIS.

Web based editing in QGIS cloud

QGIS Cloud (www.qgiscloud.com) is a platform which provides a convenient geodata infrastructure including database, web services and web maps in the cloud. Recently, Sourcepole implemented the possibility to enable web-based editing in published maps. This blog post shows how to enable editing in QGIS cloud pro maps. We start with my_edit_project.qgs, a project in QGIS desktop containing a background layer and a point vector layer (trees). We upload the data to QGIS Cloud using the QGIS Cloud plugin and publish the project.

Working with QGIS 3D - Part 2

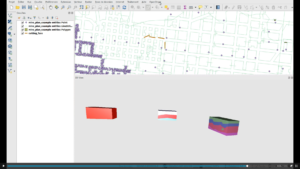
In an earlier blog post, we looked into how to visualise rasters and terrains in QGIS 3D.

In this post, we will explore 3d vectors and how to view buildings and trees.

Data Sources

For the purpose of this blog post, we will be using

You can download all the dataset and final QGIS project from our Mergin service. Note that the DTM has been resized from 1m resolution to 5m. All of the datasets have been clipped to Luxembourg commune extent.

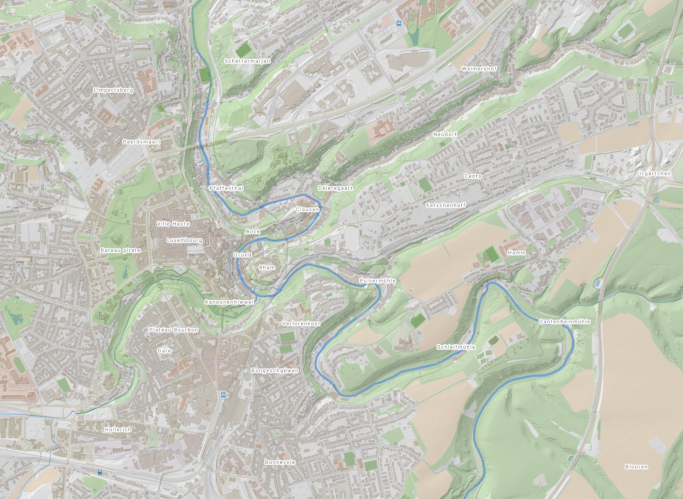
After styling the layers you should be able to see an image like the one below in your map view.

Options

3D Buildings

You can open a new 3D map window and set the DTM layer as your terrain as shown in the earlier blog post.

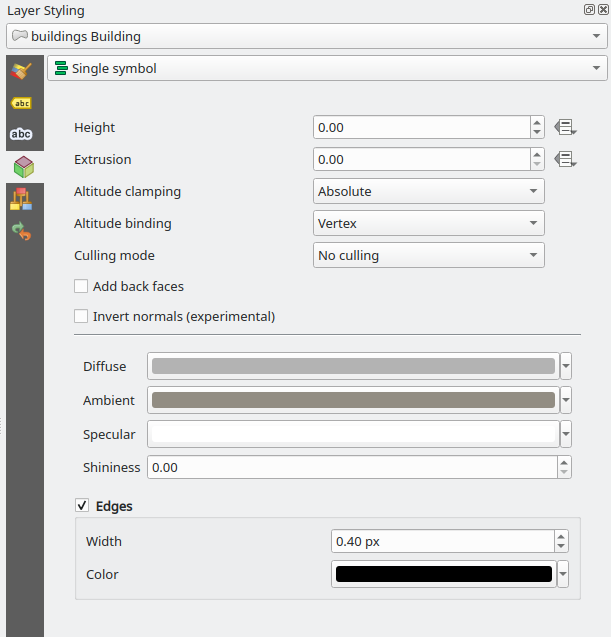
The other layer we want to view in 3D canvas is the building layer. To adjust the settings, you need to change the layer styling (by pressing F7 to open the styling panel):

Options

  • By default, the 3D rendering of vector layer is set to No symbol. Click on it and set it to Single symbol.

The buildings layer contain height information:

  • Change Altitude clamping to Absolute.
  • Change Altitude binding to Vertex.

In case, your building layer is not a 3D dataset, you can apply height and/or extrusion to be able to see them in 3D map view.

Culling mode helps rendering your scenes faster by not drawing certain features facing the camera. You can read more about culling modes here and here.

You can change Diffuse, Ambient, Specular and Shininess of the polygons using relevant widgets. These parameters are based on Phong reflection model.

Finally to better display the buildings, you can define the Edges.

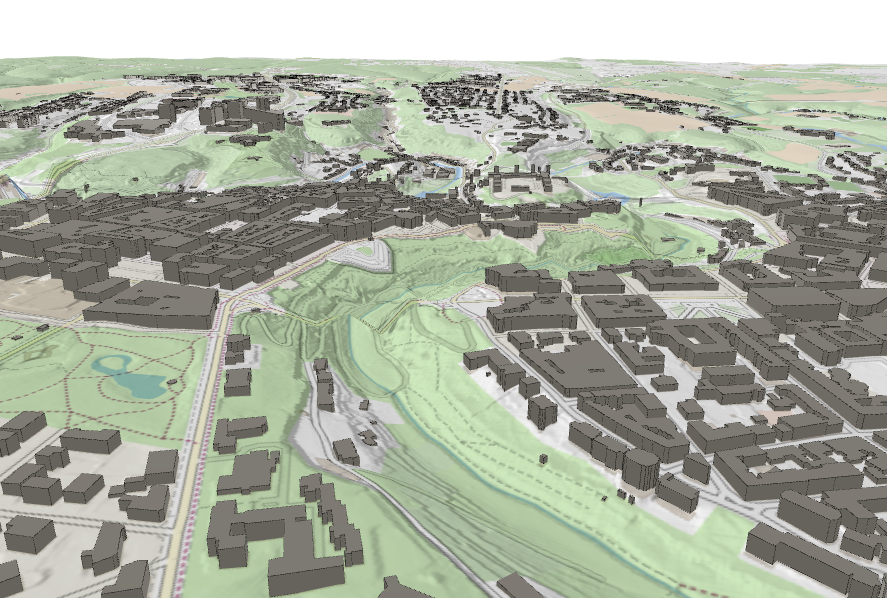
You should be able to see a 3d scene similar to the one below:

Options

3D Points

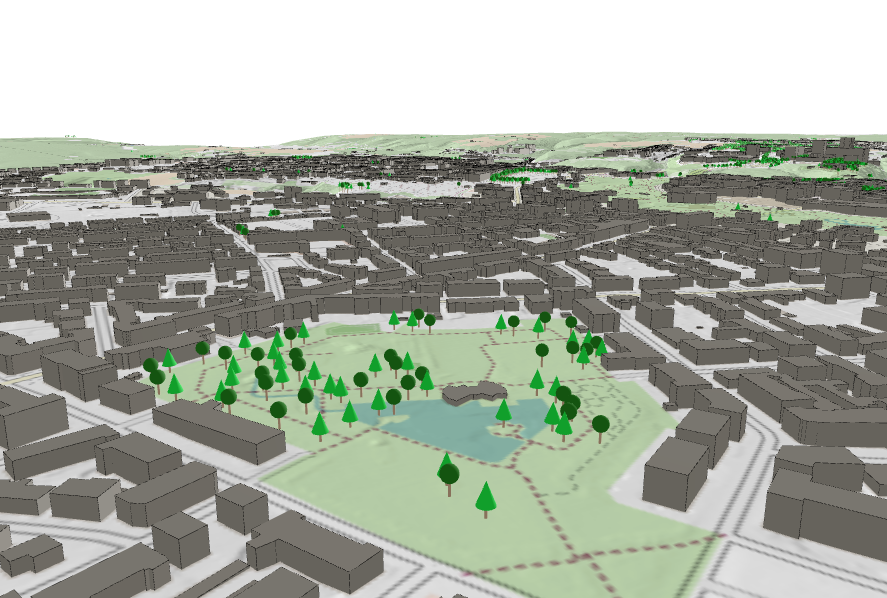
Points can be displayed in 3D map view as different type of objects. In this example, we are going to display trees as combination of predefined shapes. You can extract tree points from the OpenStreetMap data (the osm_pois layer with filter: "fclass" LIKE 'tree').

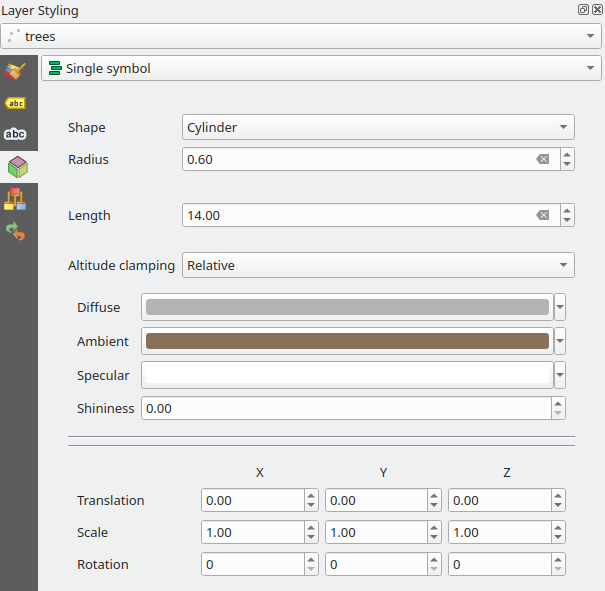
For tree trunks, we can set the 3D properties as follows:

Options

The tree trunks are represented by a Cylinder shape. As you have noted, the Altitude clamping method for this layer is Relative.

For the tree top, we can duplicate the same tree layer in the layer panel and change the styling to be a Sphere shape. You will also need to set the Transformation for Y to e.g. 10, so that the spheres sit on top of the cylinders. For the example below, we have set the styling to be a mix of spheres and cones (Rule-based instead of Single symbol).

3D point renderer allows you to import 3d models supported by Open Asset Import Library.

Options

Fly-over animations

You can create animations of 3d scenes, by defining key frames. Click on the Animation icon from the 3D map view window. A new toolbar will appear at the bottom of your window.

Click on the green plus sign to add the timing of the key frames and then move the camera to a different location. You can then play the fly-over using different interpolation methods. Alternatively, you can export them as images and generate an animation outside QGIS.

You may also like...

Mergin Maps, a field data collection app based on QGIS. Mergin Maps makes field work easy with its simple interface and cloud-based sync. Available on Android, iOS and Windows. Screenshots of the Mergin Maps mobile app for Field Data Collection
Get it on Google Play Get it on Apple store

Crowdfunding: Support for Vector Tiles in QGIS

We are happy to announce a new crowdfunding campaign to support Vector Tiles in QGIS!

This will be a great step for QGIS to support an increasingly popular technology used in web mapping to deliver maps that are faster and more flexible at the same time.

With native support for Vector Tiles in QGIS, you will be able to add more resources to your QGIS map:

  • Support for remote resources (e.g. HTTP/HTTPS map tiles)
  • Handling local vector tiles (in XYZ format)
  • Handling database vector tiles (Mapbox Vector Tiles format)

The target amount is 8,000 € and the campaign will be active until 20 March 2020.

Please have a look at the dedicated page Vector Tiles support in QGIS for further details and help us spread the word!

You may also like...

Mergin Maps, a field data collection app based on QGIS. Mergin Maps makes field work easy with its simple interface and cloud-based sync. Available on Android, iOS and Windows. Screenshots of the Mergin Maps mobile app for Field Data Collection
Get it on Google Play Get it on Apple store

Reports from the winning grant proposals 2019

With the QGIS Grant Programme 2019, we were able to support six proposals that were aimed to improve the QGIS project, including software, infrastructure, and documentation. These are the reports on the work that has been done within the individual projects:

  1. Profile and optimise the QGIS vector rendering code (Nyall Dawson)
    We conducted in-depth research into code “hot spots” and inefficiencies in the QGIS rendering code using a number of code profiling tools. This work resulted in many optimisations in the vector rendering code and other parts of QGIS (such as certain Processing algorithms). These optimisations were made available in the QGIS 3.10.0 release.
  2. “Rebalance” the labeling engine and fix poor automatic label placement choices (Nyall Dawson)
    We first designed unit tests covering a range of different label placement situations and then used these tests as a guide to re-work the label placement engine. Now, labels will never be placed over features from a layer with a higher obstacle weight, avoiding the complexities and bugs which were present in the older approach. To avoid disrupting existing projects, the new labeling logic is only used for newly created projects in QGIS 3.12 and later. (Existing projects can be upgraded via the project’s label settings dialog.)
  3. Reuse core functionality to provide DB manager features (Alessandro Pasotti & Nyall Dawson)
    We have developed a new QGIS core API, fully exposed to Python, that makes it possible to manage stored connections to various data provider source in a unified and consistent way. This is part of a larger effort building a new connections API.
  4. Snapping cache improvements (Hugo Mercier)
    Snapping is crucial for editing geospatial features. Snapping correctly supposes QGIS have in memory an indexed cache of the geometries to snap to. And maintainting this cache when data is modified, sometimes by another user or database logic, can be a real challenge. This it exactly what this work adresses. This feature has been merged into QGIS 3.12.
  5. Fix problems in larger 3D scenes (Martin Dobias)
    We worked on two issues within 3D map views. The first one was that map tiles were only being prepared using a single CPU core – this is now fixed and we may use multiple CPUs to load tiles of 3D scenes faster. The other (and greater) problem was that data from vector layers (when they have 3D renderer assigned) were all being prepared at once for the whole layer in the main thread. That resulted in possibly long freeze of the whole user interface while data were being loaded. This is now resolved as well and data from vector layers are being loaded in smaller tiles in background threads (and using multiple CPU cores). As a result, the overall user experience is now much smoother.
  6. Open documentation issues for pull requests (Matthias Kuhn and Denis Rouzaud)
    A documentation bot is now alive and automatically create an issue in the documentation repo for merged PR.

Thank you to everyone who participated and made this round of grants a great success and thank you to all our sponsor and donors who make this initiative possible!

Movement data in GIS #28: open geospatial tools for movement data exploration

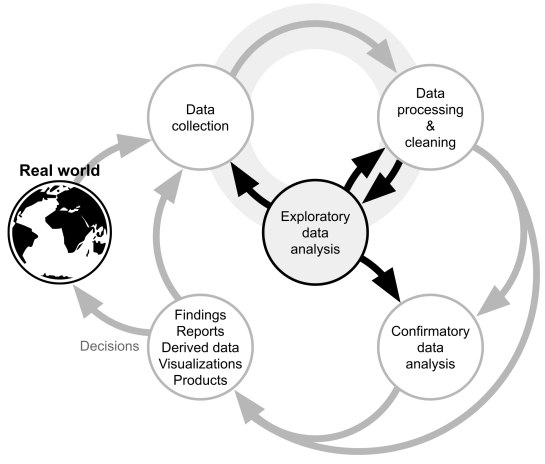
We recently published a new paper on “Open Geospatial Tools for Movement Data Exploration” (open access). If you liked Movement data in GIS #26: towards a template for exploring movement data, you will find even more information about the context, challenges, and recent developments in this paper.

It also presents three open source stacks for movement data exploration:

  1. QGIS + PostGIS: a combination that will be familiar to most open source GIS users
  2. Jupyter + MovingPandas: less common so far, but Jupyter notebooks are quickly gaining popularity (even in the proprietary GIS world)
  3. GeoMesa + Spark: for when datasets become too big to handle using other means

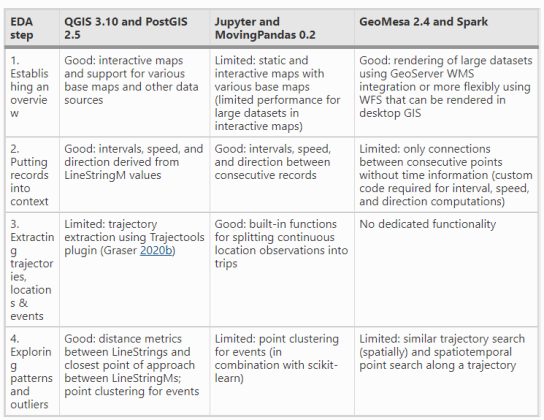
and discusses their capabilities and limitations:


This post is part of a series. Read more about movement data in GIS.

Web based editing in QGIS cloud

QGIS Cloud (www.qgiscloud.com) is a platform which provides a convenient geodata infrastructure including database, web services and web maps in the cloud. Recently, Sourcepole implemented the possibility to enable web-based editing in published maps. This blog post shows how to enable editing in QGIS cloud pro maps. We start with my_edit_project.qgs, a project in QGIS desktop containing a background layer and a point vector layer (trees). We upload the data to QGIS Cloud using the QGIS Cloud plugin and publish the project.

Collecting data using QGIS and Input app

In this post, we will walk you through basic steps to set up a survey project in QGIS desktop and using it in Input app to collect data in field using your Android or iPhone/iPad device.

Software needed

To start with, you will need to install the following software applications:

In addition, you will need to register with the Mergin service. The Mergin service allows you to transfer data between your PC/laptop and mobile/table via the cloud. Note that after signing up to the Mergin service, you have to activate the account by clicking on the link sent to your email.

Configuring QGIS project

To be able to survey data, we need to set up a project in QGIS. Usually, you will need some data for your background layer (so that you can locate yourself!). In addition, you need to set up a table (or layer), to store your survey information.

For background data, we are going to use Open Street Map. For survey table, we need to decide on a form structure and the type of feature you want to survey (e.g. point of interest, tracks or parcel of land). In this case, we want to survey potholes. Also, it would be good to attach some notes for each pothole, take a photo of it and add a date for survey. The GIS format best suited to store spatial information, is Geopackage.

Let’s start by opening QGIS and add the above layers to our project. To simplify things, we can create a folder on Desktop (referred to in this tutorial as data collection folder) and store everything there.

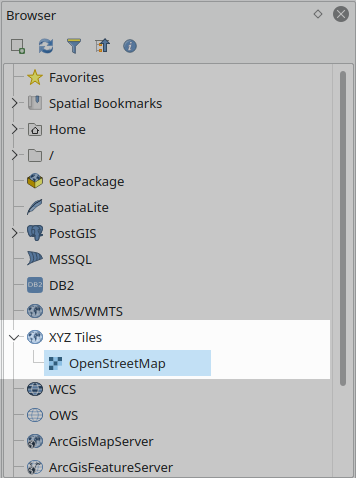
Open QGIS from your PC/laptop. From the Browser panel (usually located on the top left side), expand XYZ Tiles and double-click on OpenStreetMap to add it to QGIS: QGIS
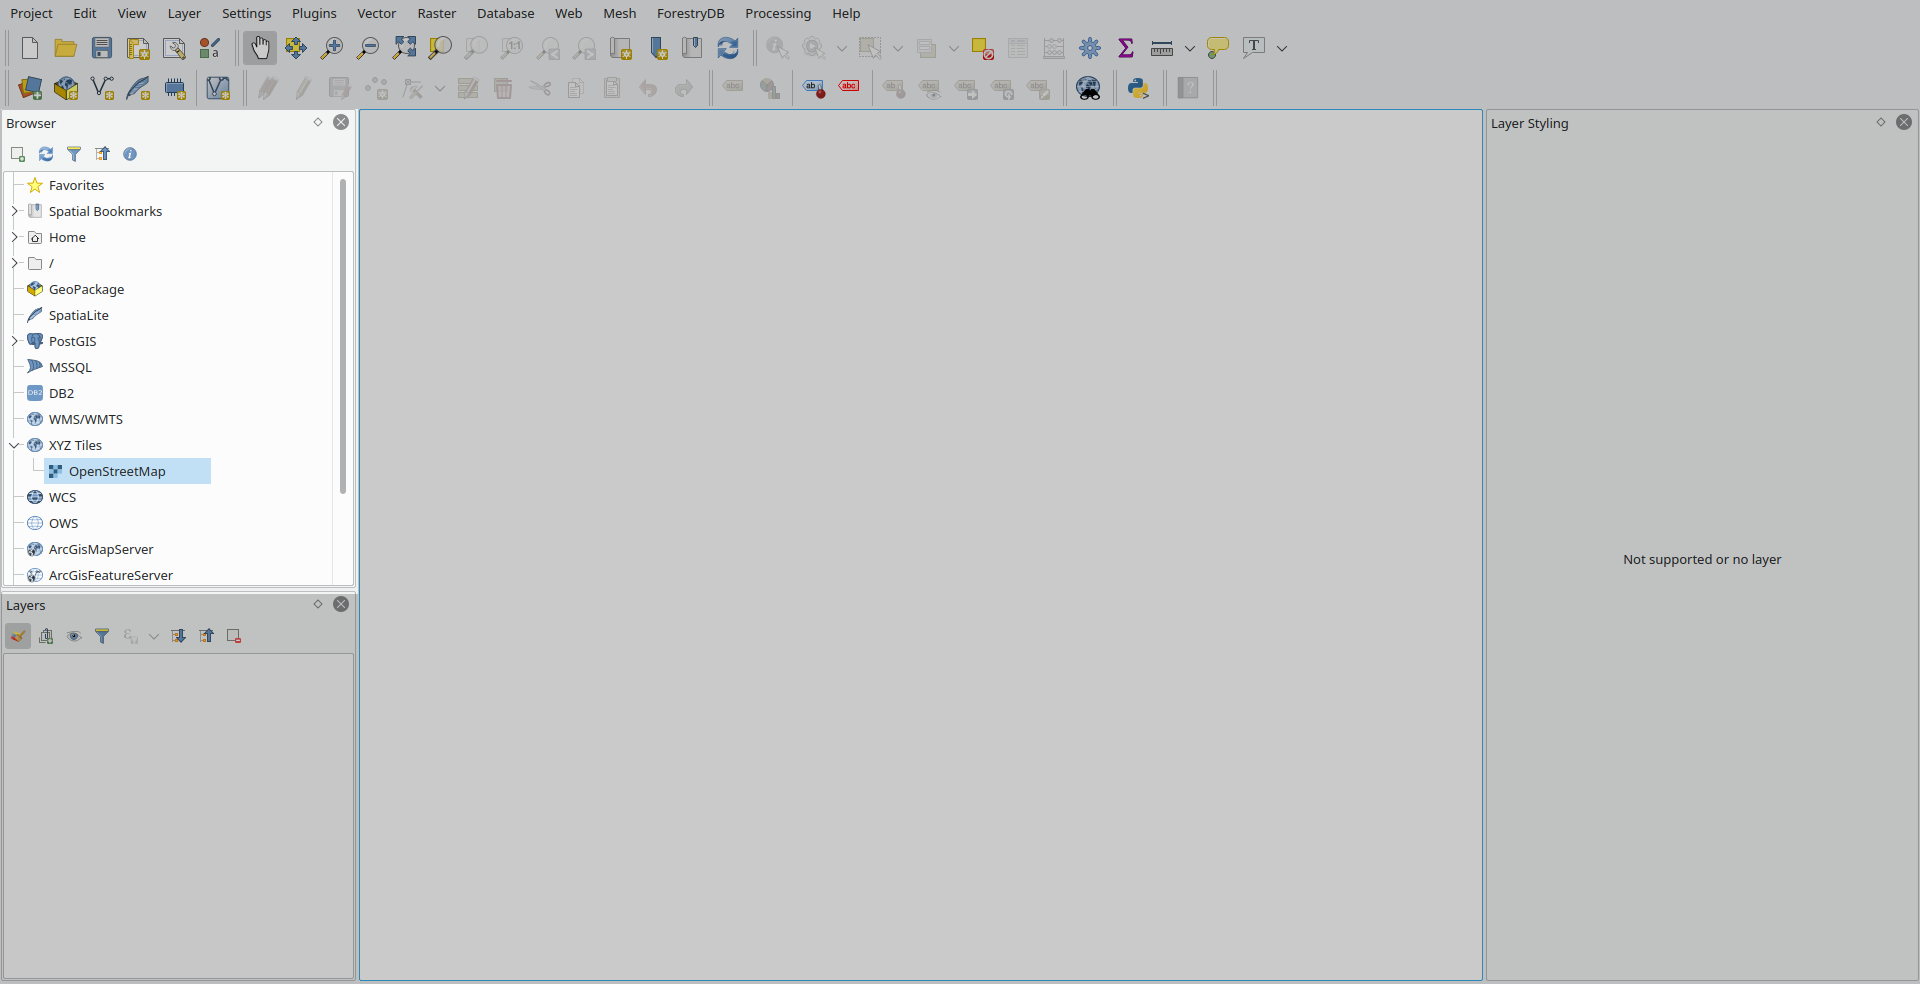
Browser panel in QGIS

You should see the OSM layer:

Adding OSM XYZ layer

Save your project as pothole survey in the data collection folder.

To create a survey layer, in QGIS, from the main menu select Layer > Create Layer > New Geopackage Layer …. Note that Geopackage is a file based database where you can store multiple tables (spatial or non-spatial). A new window will appear:
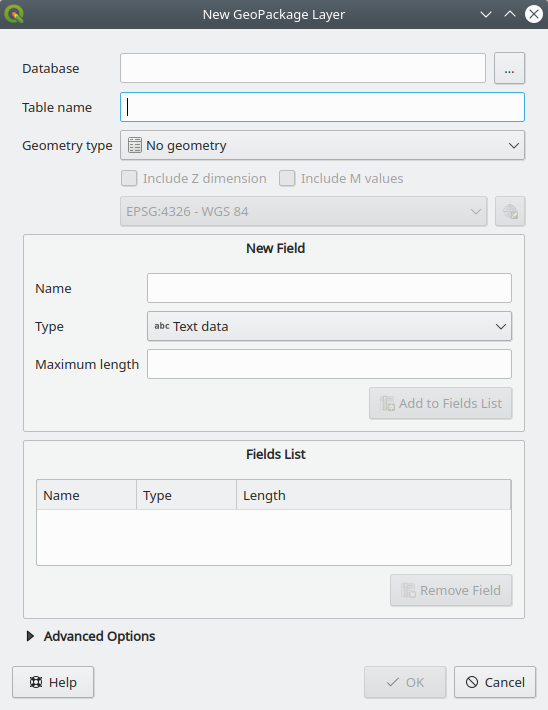
Creating a geodatabase

For Database click on and select the data collection folder on your Desktop and then type survey-db.gpkg for the name of your database.

For Table name, type Potholes.

For Geometry type, select Point.

For Coordinate Reference System (CRS), click on the icon to the right of EPSG:4326 - WGS84. A new window will appear. Under Filter section on the top of the window, type: 3857 and under Predefined Coordinate Reference Systems, select WGS 84 / Pseudo-Mercator EPSG:3857. Then click OK.
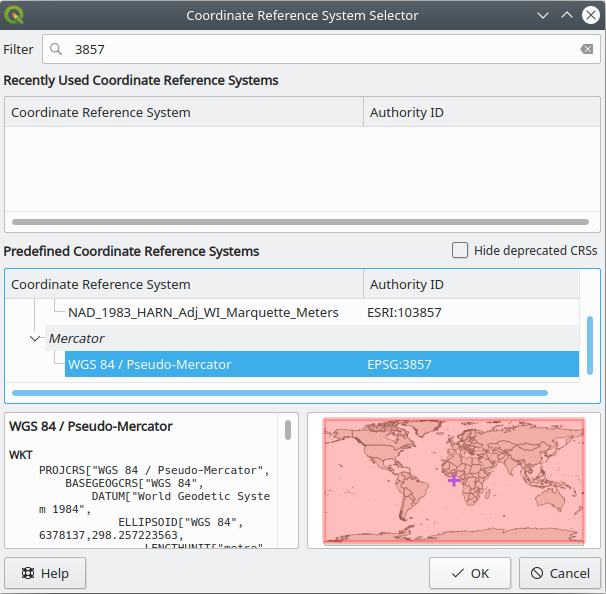
Assigning CRS

We can now create the column headers for our table under New Field section. For this form, we want to create the following columns to store data: Date, Notes, Photo

For Name, type Date

For Type, select Date

Click on Add to Field lists to add your column.

Repeat the same process for Notes and Photos columns, but make sure to change the Type for those columns to Text. At this stage, you should see an image similar to the one below:
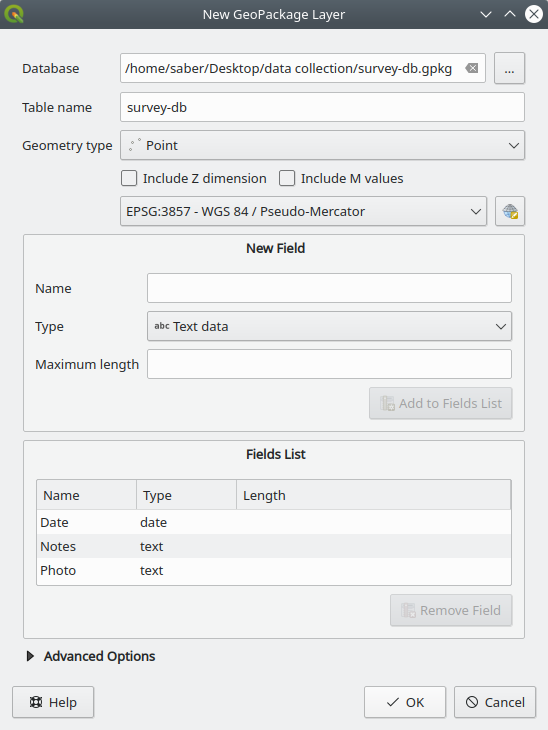
Sharing projects through Mergin

Go ahead and click OK to create the layer and add it to QGIS.

Styling layers and setting up forms

The default style applied to Potholes layer is not very visible probably. To change it:

In the Layer Panels right-click on Potholes layer and select Properties. A new window will appear. From the left panel, select Symbology. Try to change the style to something shown in the image below:
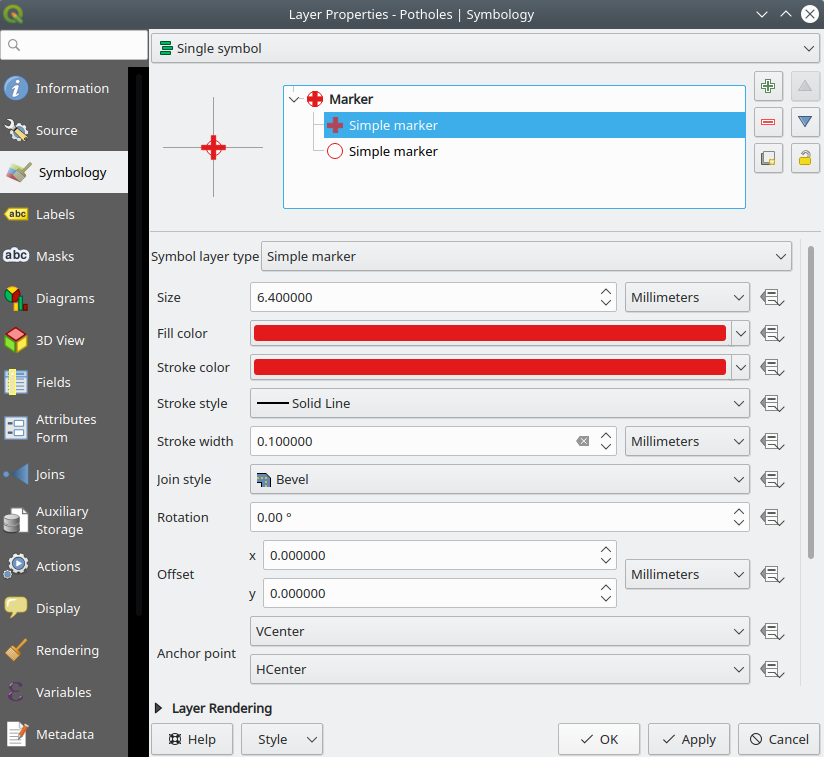
Sharing projects through Mergin

Click on Apply.

We can also change the way user fills in the form. By default, you have to type in the values. But by using different widgets, we can simplify filling the form in the field.

In the Properties window, from the left panel, select Attribute forms.
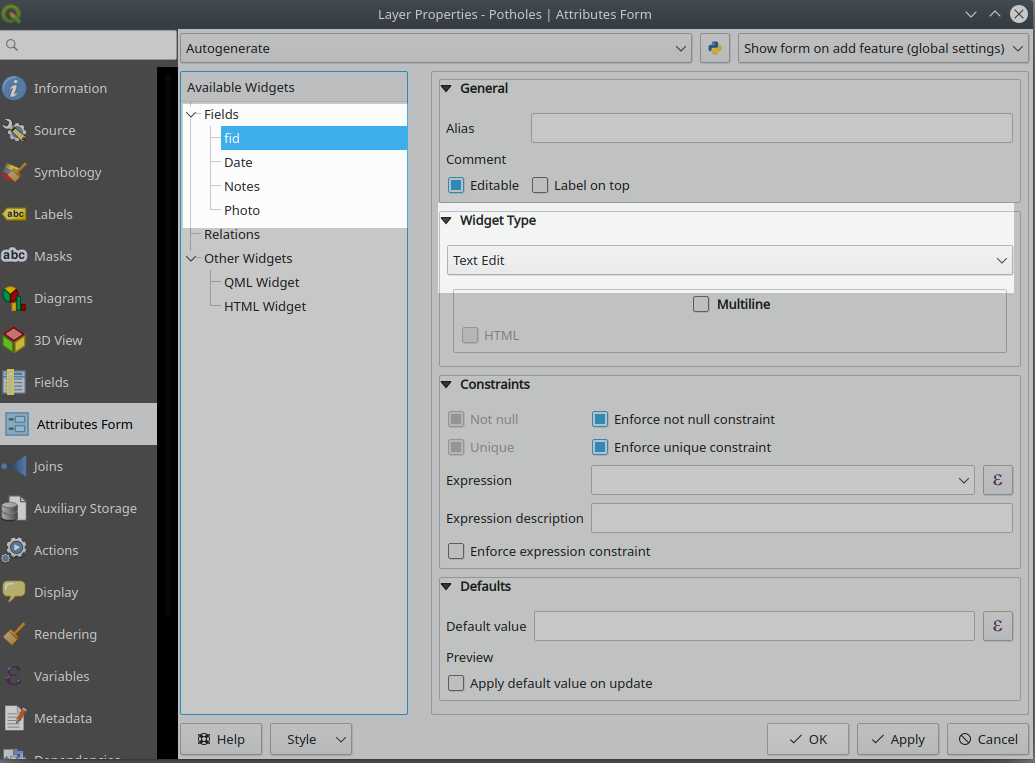
Sharing projects through Mergin

We are going to change the Widget Type for each of the Fields.

fid is an auto-increment field and we can keep it hidden from users. So, highlight the fid field under Field section and then from the Widget Type select Hidden

For Data, it should have automatically selected the correct widget type:
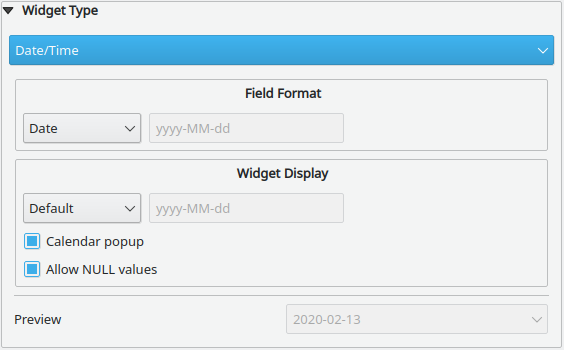
Sharing projects through Mergin

For Notes, you can also leave the Widget Type as Text Edit.

For Photos, we need to change the Widget Type to Attachment. Also make sure to select the option for Relative paths. This will allow us to attach photos using mobile camera or gallery folder to the pothole point.

Tip: You can scroll further down and under Integrated Document Viewer and select Type as Image. This will show the image in QGIS forms too.
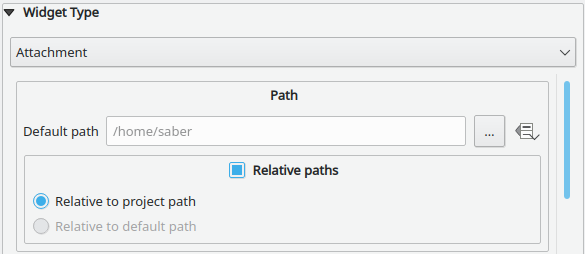
Sharing projects through Mergin

Project set up is completed and we can save the project.

Transferring data to mobile devices

You have 2 options to transfer your data to the mobile through the Mergin service: through website or through Mergin plugin in QGIS. In this tutorial we are going to use the plugin from within QGIS.

In QGIS, from the main menu, select Plugins > Manage and Install Plugins …. A new window will appear. From the left panel, select All and then in the search section (on the top) search for Mergin. Select the plugin from the list and click on Install plugin. After installation, you need to restart your QGIS.

After the restart, you should be able to see the Mergin icon in your Browser Panel:
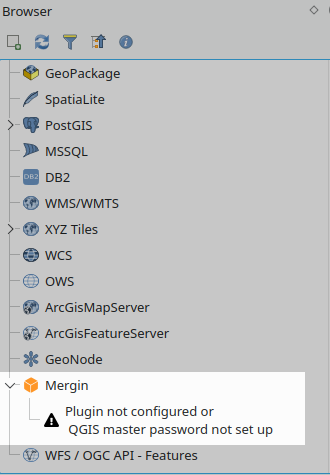
Sharing projects through Mergin

In the Browser Panel, right click on the Mergin and select Configure. Type in your username (or email address) and password that you have registered with the Mergin service.
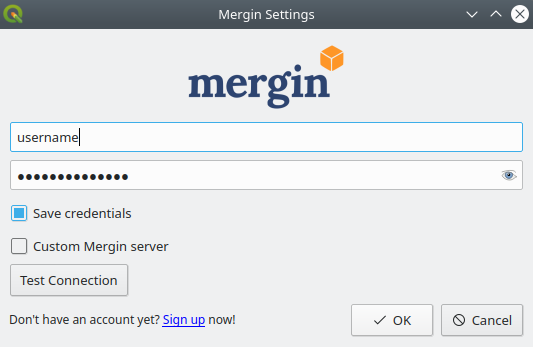
Sharing projects through Mergin

Click on Test Connection and you should see a green OK.

If you have selected to Save credentials (so you do not need to type in the username and password again) and you have not configured QGIS password manager, you will be prompted to set a password for your QGIS password manager.

After clicking OK, you should see a list of folders on your Mergin connection in your browser panel:
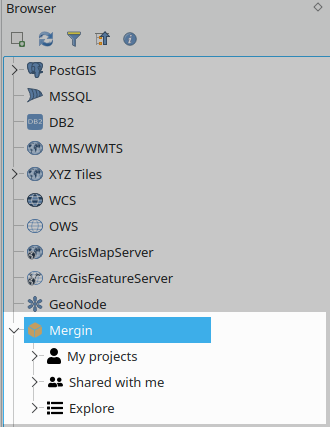
Sharing projects through Mergin

We can know upload the data:

Right click on the Mergin and select Create new project. A new window will appear:

For Project name type Potholes survey

Select Initialize from local drive

Click on … and and select data collection folder
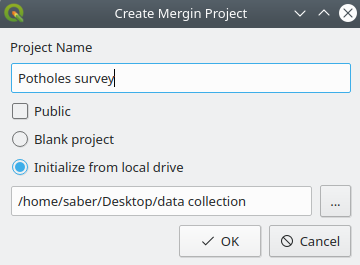
Sharing projects through Mergin

Once click OK, the project will be created and content of the data collection folder will be uploaded there.

The project is now ready to be downloaded on your mobile device.

Collecting data using Input app

The project can now be accessed from Input app. Open your Input app and for the first time you should see a screen similar to the image below:
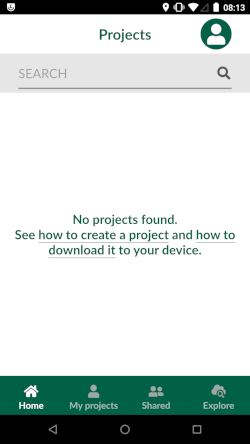
Sharing projects through Mergin

To log in to the Mergin service, you can select My projects or the green and white icon on the top right.
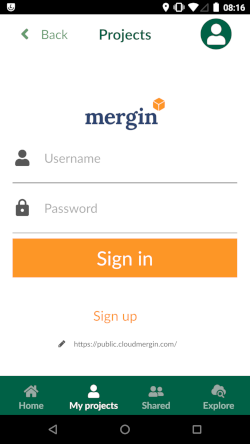
Sharing projects through Mergin

Type your Mergin username (or email address) and password and then select Sign in.

Once signed in, select My projects and you will see Potholes survey project in the lists
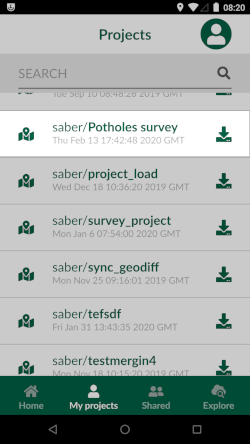
Sharing projects through Mergin

Select the download icon on the right side of Potholes survey to download your project on the phone and make it ready for survey.

After downloading is completed, select Home and you should be able to see Potholes survey.
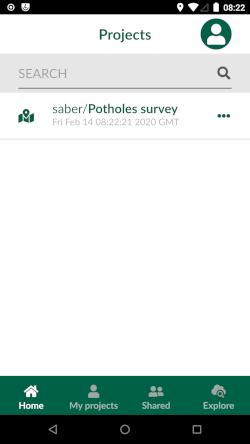
Sharing projects through Mergin

Select Potholes survey and it will open the map:
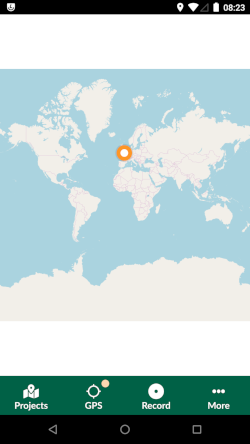
Sharing projects through Mergin

To record a feature, select Record button and the pointer changes to a cross-hair.
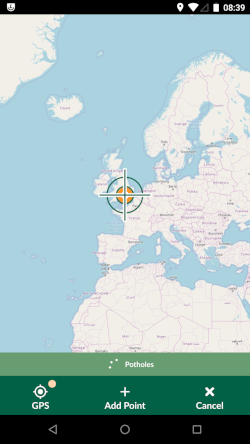
Sharing projects through Mergin

By default, the cross-hair centres to your location (the orange point) on the map. You can move the map and adjust the location. To recentre the map to your location, you can select GPS button. Once you are happy with the location, you can select Add point and the form for your point will appear:
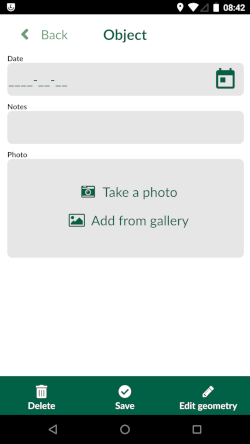
Sharing projects through Mergin

Fill in the form and press Save. You should see the map with the newly captured pothole:
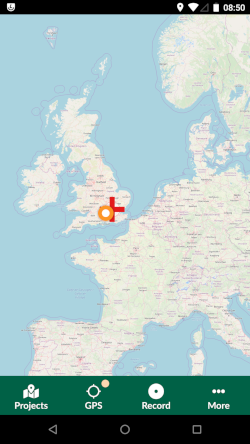
Sharing projects through Mergin

Synchronising data

The data you have captured on your phone can be synchronised through the Mergin service.

In Input app, select Projects and then My projects. You should see a double arrow on the right side of the Potholes survey.
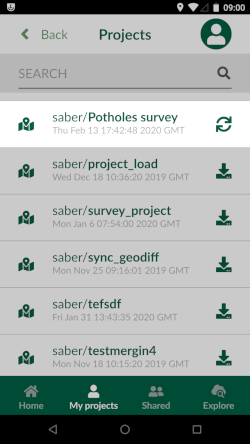
Sharing projects through Mergin

Select the double arrow to sync your project. You can also open QGIS from your PC/laptop and synchronise changes back to your desktop:

In QGIS, from the Browser Panel under Mergin > My projects right-click on Potholes survey and select Synchronize
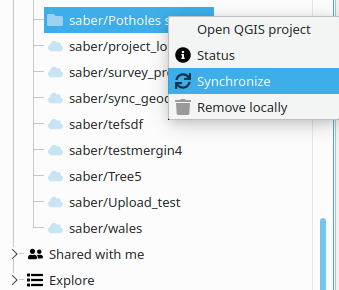
Sharing projects through Mergin

After synchronising is completed, you should be able to see the point and its associated form on your QGIS.
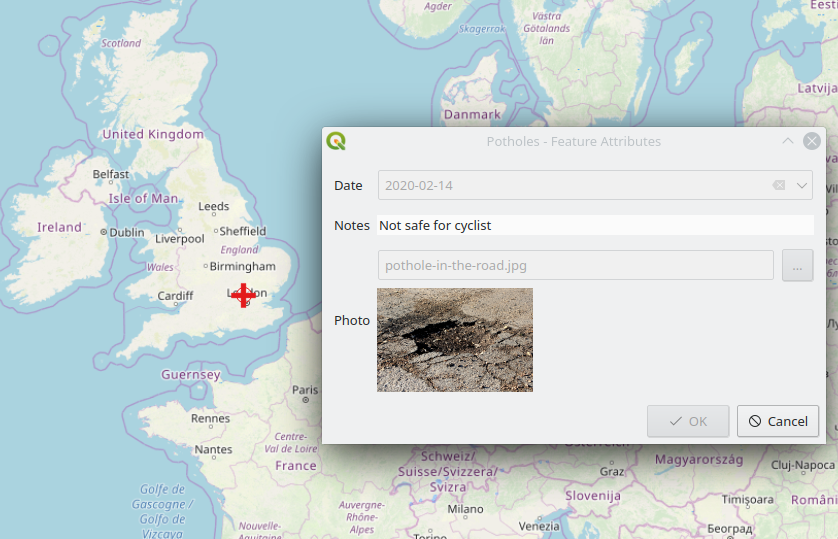
Sharing projects through Mergin

Further reading

Input app’s manual can be found here.

With the Mergin service, multiple users can collect data on the same project. For more information, see this the blog post.

For more information on how to set up complex forms and map themes see QGIS documentation.
Who is behind QGIS at Oslandia ?

You are using QGIS and look for support services to improve your experience and solve problems ? Oslandia is here to help you with our full QGIS editor service range ! Discover our team members below.

You will probably interact first with our pre-sales engineer Bertrand Parpoil. He leads Geographical Information System projects for 15 years for large corporations, public administrations or hi-tech SME. Bertrand will listen to your needs and explore your use cases, to offer you the best set of services.

Régis Haubourg also takes part in the first steps of projects to analyze your usages and improve them. GIS Expert, he knows QGIS by heart and will make the most of its capabilities. As QGIS Community Manager at Oslandia, he is very active in the QGIS community of developers and contributors. He is president of the Francophone OSGeo local chapter ( OSGeo-fr ), QGIS voting member, organizes the French QGIS day conference in Montpellier, and participates to QGIS community meetings. Before joining Oslandia, he led the migration to QGIS and PostGIS at the Adour-Garonne Water Agency, and now guides our clients with their GIS migrations to OpenSource solutions. Régis is also a great asset when working on water, hydrology and other specific thematic subjects.

Loïc Bartoletti develops QGIS, specializing in features corresponding to his fields of interests : network management, topography, urbanism, architecture… We find him contributing to advanced vector editing in QGIS, writing Python plugins, namely for DICT management. Pushing CAD and migrations from CAD tools to GIS and QGIS is one of his major goals. He will develop your custom applications, combining technical expertise and functional competences. When bored, Loïc packages software on FreeBSD.

Vincent Mora is senior developer in Python and C++, as well as PostGIS expert. He has a strong experience in numerical simulation. He likes coupling GIS (PostGIS, QGIS) with 3D numerical computing for risk management or production optimization. Vincent is an official QGIS committer and can directly integrate your needs into the core of the software. He is also GDAL committer and optimizes low-level layers of your applications. Among numerous activities, Vincent serves as lead developer of the development team for Hydra Software, a tool dedicated to unified hydraulics and hydrology modelling and simulation based on QGIS.

Hugo Mercier is an officiel QGIS committer too for several years. He regularly talks in international conferences on PostGIS, QGIS and other OpenSource GIS softwares. He will implement your needs with new QGIS features, develop innovative plugins ( like QGeoloGIS ) and design and build your new custom applications, solving all kind of technological challenges.

Paul Blottière completes our QGIS committers : very active on core development, Paul has refactored the QGIS server component to bring it to an industry-grade quality level. He also designed and implemented the infrastructure allowing to guarantee QGIS server performances. He dedicated himself to QGIS server OGC certification, especially for WMS (1.3). Thanks to this work QGIS is now a reference OGC implementation.
Julien Cabièces recently joined Oslandia, and quickly dived into QGIS : he contributes to the core of this Desktop GIS, on the server component, as well as applications linked to numerical simulation. Coming from a satellite imagery company with industrial applications, he uses his flexibility to answer all your needs. He brings quality and professionalism to your projects, minimizing risks for large production deployments.
You may also meet Vincent Picavet. Oslandia’s founder is a QGIS.org voting member, and is involved in the project’s evolution and the organization of the community.

Aside from these core contributors, all other Oslandia members also master QGIS integrate this tool into their day-to-day projects.

Bertrand, Régis, Loïc, Vincent (x2), Hugo, Paul et Julien are in tune with you and will be happy to work together for your migrations, application development, and all your desires to contribute to the QGIS ecosystem. Do not hesitate to contact us !

First working MovingPandas setup on Databricks

In December, I wrote about GeoPandas on Databricks. Back then, I also tried to get MovingPandas working but without luck. (While GeoPandas can be installed using Databricks’ dbutils.library.installPyPI("geopandas") this PyPI install just didn’t want to work for MovingPandas.)

Now that MovingPandas is available from conda-forge, I gave it another try and … *spoiler alert* … it works!

First of all, conda support on Databricks is in beta. It’s not included in the default runtimes. At the time of writing this post, “6.0 Conda Beta” is the latest runtime with conda:

Once the cluster is up and connected to the notebook, a quick conda list shows the installed packages:

Time to install MovingPandas! I went with a 100% conda-forge installation. This takes a looong time (almost half an hour)!
When the installs are finally done, it get’s serious: time to test the imports!

Success!

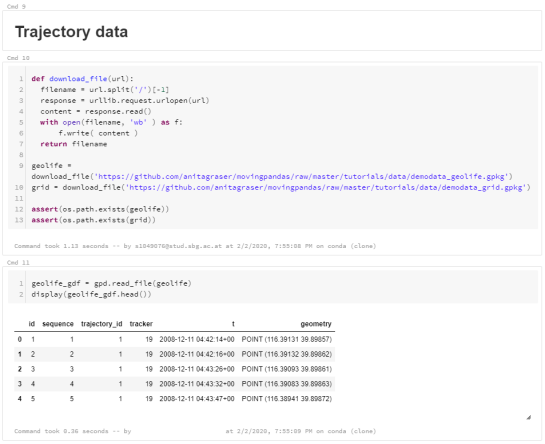
Now we can put the MovingPandas data structures to good use. But first we need to load some movement data:

Or course, the points in this GeoDataFrame can be plotted. However, the plot isn’t automatically displayed once plot() is called on the GeoDataFrame. Instead, Databricks provides a display() function to display Matplotlib figures:

MovingPandas also uses Matplotlib. Therefore we can use the same approach to plot the TrajectoryCollection that can be created from the GeoDataFrame:

These Matplotlib plots are nice and quick but they lack interactivity and therefore are of limited use for data exploration.
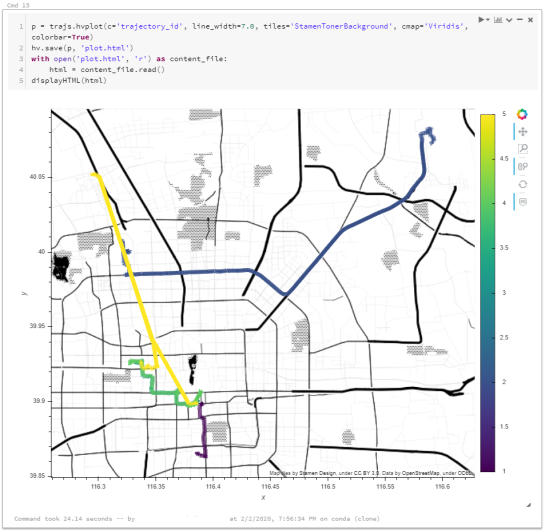
MovingPandas provides interactive plotting (including base maps) using hvplot. hvplot is based on Bokeh and, luckily, the Databricks documentation tells us that bokeh plots can be exported to html and then displayed using  displayHTML():

Of course, we could achieve all this on MyBinder as well (and much more quickly). However, Databricks gets interesting once we can add (Py)Spark and distributed processing to the mix. For example, “Getting started with PySpark & GeoPandas on Databricks” shows a spatial join function that adds polygon information to a point GeoDataFrame.

A potential use case for MovingPandas would be to speed up flow map computations. The recently added aggregator functionality (currently in master only) first computes clusters of significant trajectory points and then aggregates the trajectories into flows between these clusters. Matching trajectory points to the closest cluster could be a potential use case for distributed computing. Each trajectory (or each point) can be handled independently, only the cluster locations have to be broadcast to all workers.

Flow map (screenshot from MovingPandas tutorial 4_generalization_and_aggregation.ipynb)


Public Service Announcement: Update to the latest point release now

QGIS users who have adopted the 3.10 version when initially released at the end of October 2019 have likely noticed a sharp drop in reliability. The underlying issues have now been addressed in 3.10.2, all users are advised to update *now*.

When QGIS 3.10 was first released in the end of October 2019, a pair of libraries – namely GDAL and PROJ – were updated to their next-generation versions. The advantages are plenty: GeoPDF export[1] support, more accurate coordinate transformation, etc. For those interested, more technical information on this is available here[2].

The update of these crucial libraries led to a number of regressions. While we expected some issues to arise, the seriousness of the disruption caught us off guard. Yet, it was also somewhat inevitable: QGIS is the first large GIS project to expose these next-generation libraries to the masses. The large number of QGIS users across the globe were essentially stress testing both new code within QGIS as well as the libraries themselves.

Thanks to dedicated users taking time to file in report and the community helping out as well as our project sponsors for allowing us to fund development time, developers have been able to fix all known regressions in both in QGIS as well as underlying GDAL and PROJ libraries, benefiting a large number of open source projects.

As a result of this collective effort by the community, QGIS 3.10.2 is now back to being the reliable and stable GIS software we all love. As such, we cannot stress enough the importance of updating now.

Once again, thanks to our community of testers, sponsors, and developers for their countless hours and efforts in making QGIS better.

Happy mapping!

[1] https://north-road.com/2019/09/03/qgis-3-10-loves-geopdf/
[2] https://gdalbarn.com/

(Fr) Oslandia recrute : Ingénieur(e) développement d&#8217;applications SIG ( Python / SQL / QGIS )

Sorry, this entry is only available in French.

QGIS Processing, Model Designer and ETL Campaign crowdfund launched!

QGIS Processing offers a rich and expandable set of algorithms which can operate on spatial data, along with a powerful Model Designer which allows users to string together these algorithms to create custom workflows.

Since its introduction in QGIS 2, the Processing framework has seen an intensive amount of development and optimisation efforts. In recent QGIS releases it offers a very user-friendly way of performing complex spatial data processing tasks, all without requiring ANY expensive third-party tools or software licenses!

At North Road we are passionate about the QGIS Processing framework, and have invested considerable effort in this framework over the past 5 years. We’re proud to announce that our latest crowd-funding campaign is focused on further expanding the capabilities and flexibility of Processing and the Processing Model Designer!

Unlike a typical crowdfunding campaign, where a specific funding target and deadline is set, we’re running this campaign a little differently. Instead, this campaign is taking the form of a “à la carte” menu of Processing enhancements. These range from small “paper-cut” style fixes, through to larger architectural improvements, and are each individually priced accordingly. We are asking backers to pick individual enhancements from this “menu of enhancements” and fund that enhancement’s development in full. In order to make this campaign affordable for a wide range of backers, we’ve included a huge range of enhancements which vary in price from smaller amounts to larger amounts.

You can read the full details of the campaign and browse the list of proposed enhancements at the campaign page.

QGIS Abstract Connections API


The goal of the new API is twofold:

  1. provide a unified way to store and retrieve data provider connections in the QGIS settings
  2. provide an abstract set of methods to perform most common operation on DB data sources (e.g. browse tables, drop/create a table/schema, run arbitrary SQL commands etc.)


The new API is documented in https://qgis.org/api/classQgsAbstractProviderConnection.html and it provides a few specializations for DB connections (https://qgis.org/api/classQgsAbstractDatabaseProviderConnection.html) and an initial PR implementation for web service-based connections (https://github.com/qgis/QGIS/pull/33045).


While the whole of the desired refactoring work was too big for a single grant request, the first work package has been completed and the following data providers have been partially or totally refactored to make use of the new connections API:

  • postgres
  • geopackage (OGR)
  • spatialite


The new API was also used to implement the automatic loading of layer dependencies (not part of the grant program).


For developers interested in working with the new API, a set Python tests are available to show how to use the methods:  https://github.com/qgis/QGIS/blob/master/tests/src/python/test_qgsproviderconnection_ogr_gpkg.py (see also the postgres and spatialite companion tests).


There is still a large amount of work to be done in order to complete all the desired refactoring and to remove all the Python and C++ code that will be ultimately be made redundant. In particular, future work should be undertaken to:

  • port all remaining data providers to the new API
  • refactor and eliminate the remaining DB-manager connectors to make use of the abstract API
  • eliminate duplicate and untested code inside the Processing framework for working with Postgres databases and port the code to the new, stable, well-tested API
  • refactor and eliminate the remaining QGIS browser data items to make use of the abstract API 


For further information, the following paragraphs (taken from the original grant proposal) will provide full details about the background of this work.

Background/motivation

  • DB-Manager is an important part of the QGIS interface, which allows browsing/previews of different DB-based data sources, complex queries, management of layers, import-export etc., DB creation and deletion etc.
  • After the QGIS 3.0 release, improvements within the core browser widgets implemented in C++ have resulted in a (constantly growing) degree of overlapping functionality between the browser and db manager.
  • After QGIS 3 API improvements concerning layer import and export functionality, there are many duplicated implementations between browser and db manager – some functionality is better in browser, some functionality is better in db manager. Users are forced to choose between two competing semi-complete alternatives, instead of having one, complete, well integrated solution.
  • There are no unit tests for DB-Manager and this leads to frequent regressions, which (aside from being frustrating for users) consume a substantial part of our development time and budget during the bugfixing programs. Furthermore the nature of large Python codebases like db manager makes it very easy to accidentally break functionality with no warning or errors during development.
 

Proposed solution

We propose to start refactoring the DB-manager plugin functionality into core C++ implementation, reusing existing core API and replacing redundant duplicate functionality.

The clear advantages are:

  • no duplicate functionality, so it’s easier for users to understand and use
  • more usage of well-tested and well-maintained core C++ API
  • testability and immediate feedback on API breaks (an advantage of C++ is that the application won’t even build if an API is changed or accidentally misused)
  • better performance
  • the ability to expose database management functionality via stable PyQGIS API, allowing other plugins and scripts to utilise this functionality. In future, Processing algorithms may also be developed which would take advantage of these functions (e.g. “create schema”, “drop table”, “vacuum table” algorithms)
  • DB management functionality would be available within the main QGIS window (from the Browser panel), instead of as a separate dialog.


Grant proposal package

The above mentioned work is too large to be completed within a single grant, so what we propose here is to start the refactoring needed in order to have a core stable C++ API that can be used by the application and the plugins and that will be available to fully move DB manager to C++ API in the future avoiding duplication of code and functionality.

  • create an interface for databases that expose the required functions to a coherent API
  • add missing tests and documentation for the a.m. API
  • porting some basic functions from db manager to the new api:
    • create table (with native field types support)
    • create schema
    • delete table
    • Rename table

The API will be exposed through the browser and it will be used by the DB manager instead of the Python implementation that is currently used.

The post QGIS Abstract Connections API first appeared on Open Web Solutions, GIS & Python Development.

Overview of QGIS 3.12 Mesh Features

Ready for 3D meshes, vector streamlines or contour export?

The releases of QGIS 3.12, MDAL 0.5.0 and Crayfish 3.2.1 are planned for end of February 2020. We are proud to present you few of upcoming features we implemented for this release:

  • vector trace animation
  • 3D stacked meshes
  • mesh calculator enhancements
  • export contours
  • various smaller enhancements (reference time support, resampling, export plot data, mdal_translate utility)

If you are hesitant to wait till end of February, feel free to get nightly build and test it out!

Do you want to use QGIS Mesh Layers in your projects? Read more…

Support for vector trace animation and streamlines (QGIS)

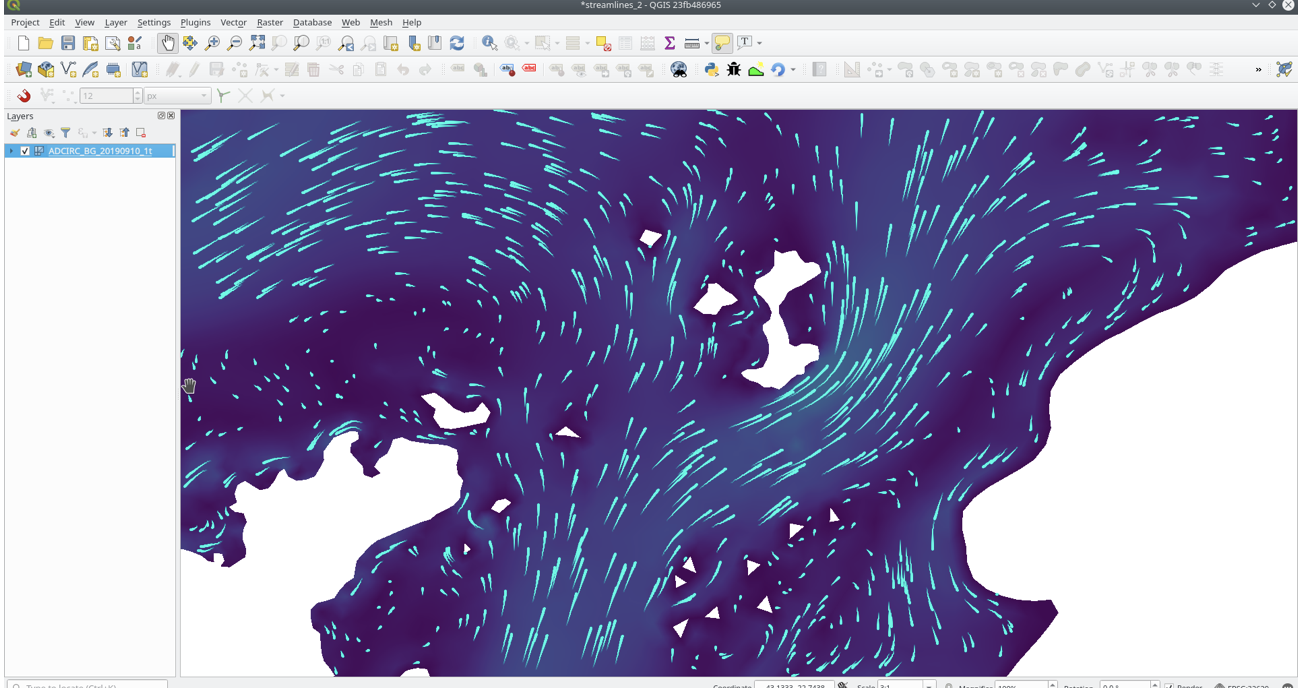
Last feature from QGIS 2.x/Crayfish 2.x series that was not ported to QGIS 3 is finally available. You would be able to visualize streamlines and particles for vector datasets in mesh layers. In QGIS main menu, under Mesh>Crayfish>Export Trace you are also able to export animation with the particle traces to various video formats

Trace animation

This feature was funded by TUFLOW

Support for 3d Stacked Meshes (e.g. TUFLOW FV format)

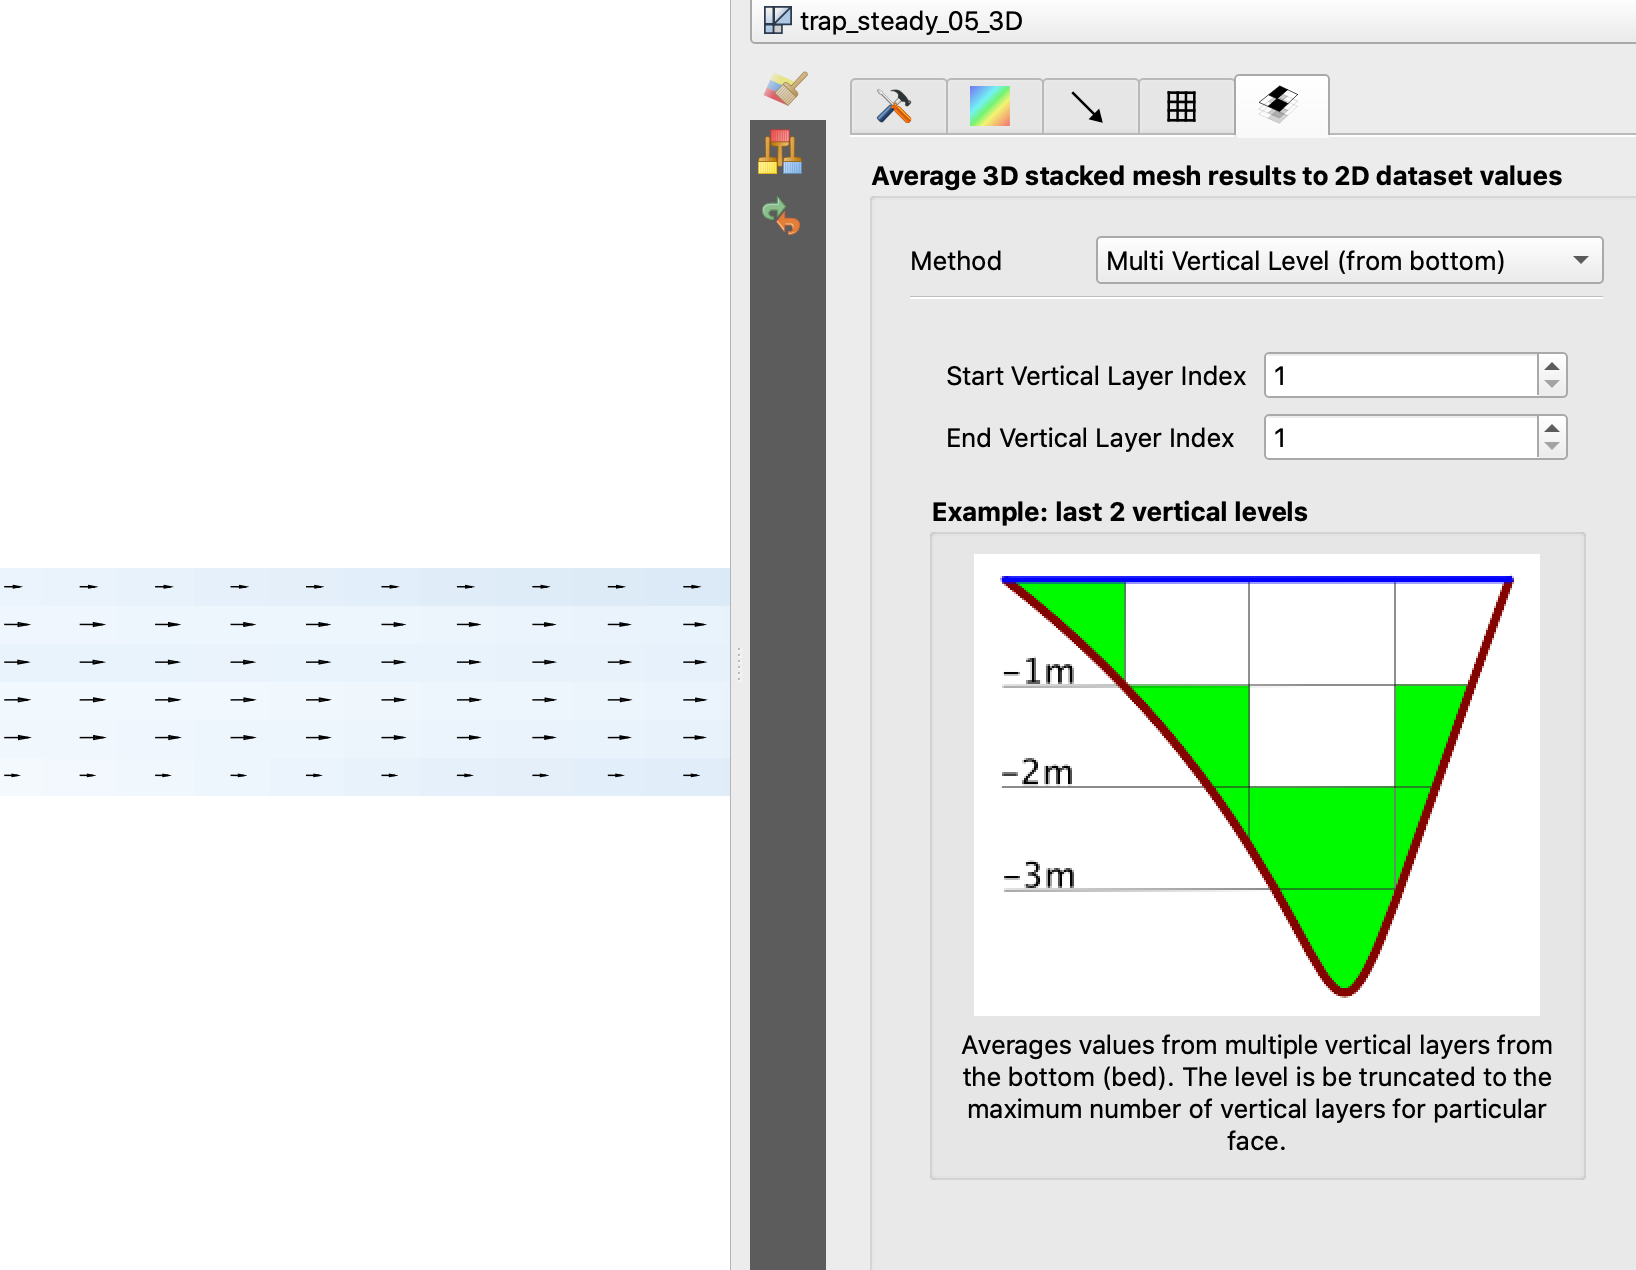
MDAL and QGIS now supports 3D Stacked Meshes, particularly for TUFLOW-FV format. For this release, you need to choose appropriate averaging method in the QGIS interface and you are able to browse the data similarly to any other 2D dataset. 3d stacked

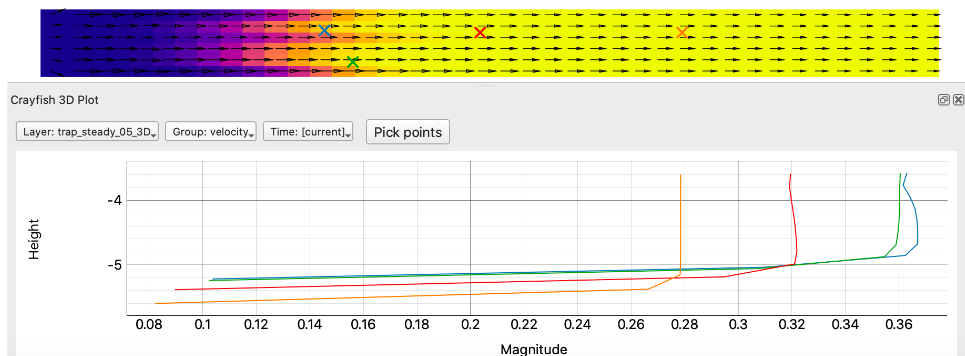
In Crayfish 3.2.1, you can create plots of the profile showing the variation along Z-axis.

3d stacked plot

The technical description can be found in the following QEP

This feature was funded by TUFLOW

On the fly resampling of data defined on faces to vertices

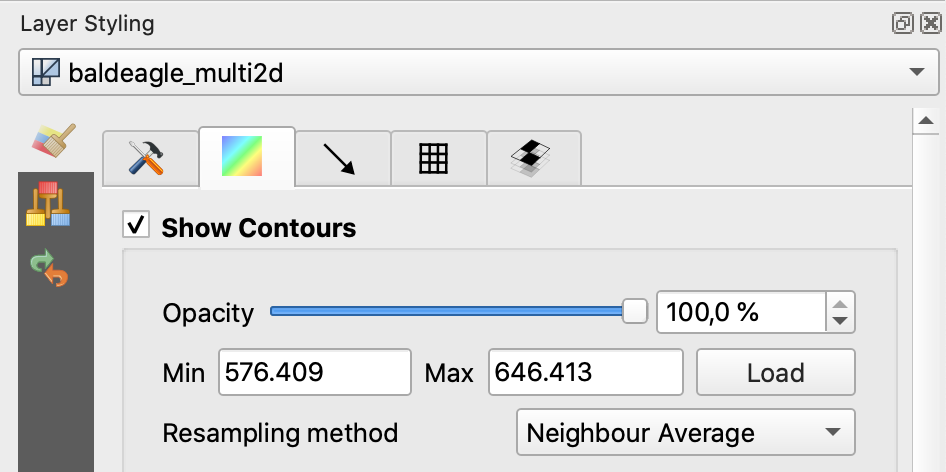
For datasets defined on faces, one can choose to interpolate data to vertices with neighbour average method. When no data interpolation method is chosen, each pixel on a single face has a single value/color. With data on vertices, the rendering for each pixel is interpolated from the values on the vertices, making smoother figures.

Use mesh contours styling panel to switch between the data interpolation methods.

No Mesh Data Resampling Dialog Mesh Data Resampling Mesh Data Resampling Dialog

This feature was funded by Austrian Ministry of Agriculture, Forestry, Environment and Water Management

Smooth export of the contours (Crayfish processing algorithm)

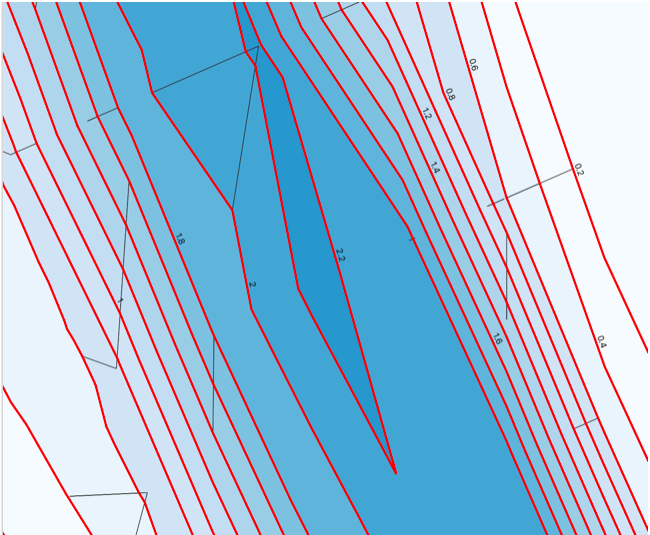
We have implemented a new algorithm in QGIS’s analysis library to export directly contour lines and polygons. The method is not based on GDAL as it was in the Crayfish 2.x releases. It is both faster and with smoother shapes, matching rendered images from QGIS. You can find the new processing algorithm in Crayfish processing toolbox.

Mesh Contours

This feature was funded by Austrian Ministry of Agriculture, Forestry, Environment and Water Management

Support of datasets defined on faces in QGIS Mesh Calculator

From QGIS 3.12 you can use mesh calculator for all datasets, both defined on faces and vertices. Additionally, it allows users to store the result of mesh calculator under different name or format. This allows for example to work with FLO-2D or HEC-RAS data in the QGIS mesh calculator

This feature was funded by Austrian Ministry of Agriculture, Forestry, Environment and Water Management

Support for reference time (QGIS)

For various dataset type, for example GRIB and NetCDF, the reference time in QGIS time settings dialog is prepopulated from the raw data and does not need to be set manually. Also we fixed various bugs related to time parsing, so in QGIS 3.12 it should be possible to format and show your time in plots/animations in proper way.

Reference Time

This feature was funded by TUFLOW

Support for conversion of 2dm to UGRID mesh (mdal_translate utility)

MDAL library now has a new utility: mdal_translate. For now, use can use the utility to convert text-based 2dm mesh definition files to UGRID NetCDF/HDF5 binary-based format and save up to 80% disk and speed up loading of your mesh by similar amount.

This feature was funded by TUFLOW

Support for export of 2D plot data (processing)

With Crayfish 3.2.1 you can export your time series or cross section raw dat to CSV format for further processing.

This feature was funded by Lutra Consulting

You may also like...

Mergin Maps, a field data collection app based on QGIS. Mergin Maps makes field work easy with its simple interface and cloud-based sync. Available on Android, iOS and Windows. Screenshots of the Mergin Maps mobile app for Field Data Collection
Get it on Google Play Get it on Apple store

  • <<
  • Page 27 of 141 ( 2808 posts )
  • >>

Back to Top

Sustaining Members