QGIS Server — Docker edition
Today’s post is a QGIS Server update. It’s been a while (12 years  ) since I last posted about QGIS Server. It would be an understatement to say that things have evolved since then, not least due to the development of Docker which, Wikipedia tells me, was released 11 years ago.
There have been multiple Docker images for QGIS Server provided by QGIS Community members over the years. Recently, OPENGIS.ch’s Docker image has been adopted as official QGIS Server image https://github.com/qgis/qgis-docker which aims to be a starting point for users to develop their own customized applications.
The following steps have been tested on Ubuntu (both native and in WSL).
First, we need Docker. I installed Docker from the apt repository as described in the official docs.
Once Docker is set up, we can get the QGIS Server, e.g. for the LTR:
docker pull qgis/qgis-server:ltrNow we only need to start it:
docker run -v $(pwd)/qgis-server-data:/io/data --name qgis-server -d -p 8010:80 qgis/qgis-server:ltrNote how we are mapping the qgis-server-data directory in our current working directory to /io/data in the container. This is where we’ll put our QGIS project files.
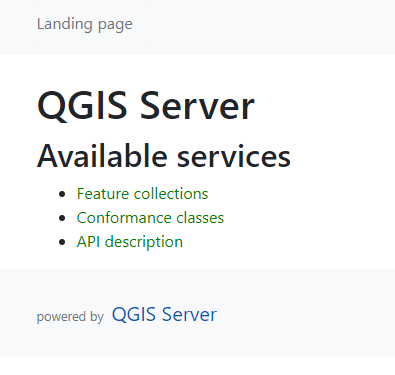
We can already check out the OGC API landing page at http://localhost:8010/wfs3/
Let’s add a sample project from the Training demo data repo. (You may need to install unzip if you haven’t yet.)
mkdir qgis-server-data
cd qgis-server-data
wget https://github.com/qgis/QGIS-Training-Data/archive/release_3.22.zip
unzip release_3.22.zip
mkdir world
cp QGIS-Training-Data-release_3.22/exercise_data/qgis-server-tutorial-data/world.qgs world/
cp QGIS-Training-Data-release_3.22/exercise_data/qgis-server-tutorial-data/naturalearth.sqlite world
Giving us:

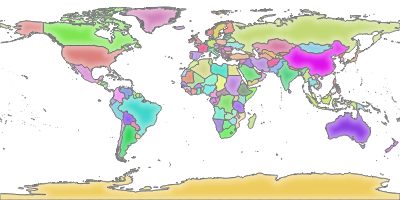
QGIS Server should now be serving this sample project. Let’s check with a WMS GetMap request:
Giving us:
If you instead get the error “<ServerException>Project file error. For OWS services: please provide a SERVICE and a MAP parameter pointing to a valid QGIS project file</ServerException>”, it probably means that the world.qgs file is not found in the qgis-server-data/world directory.
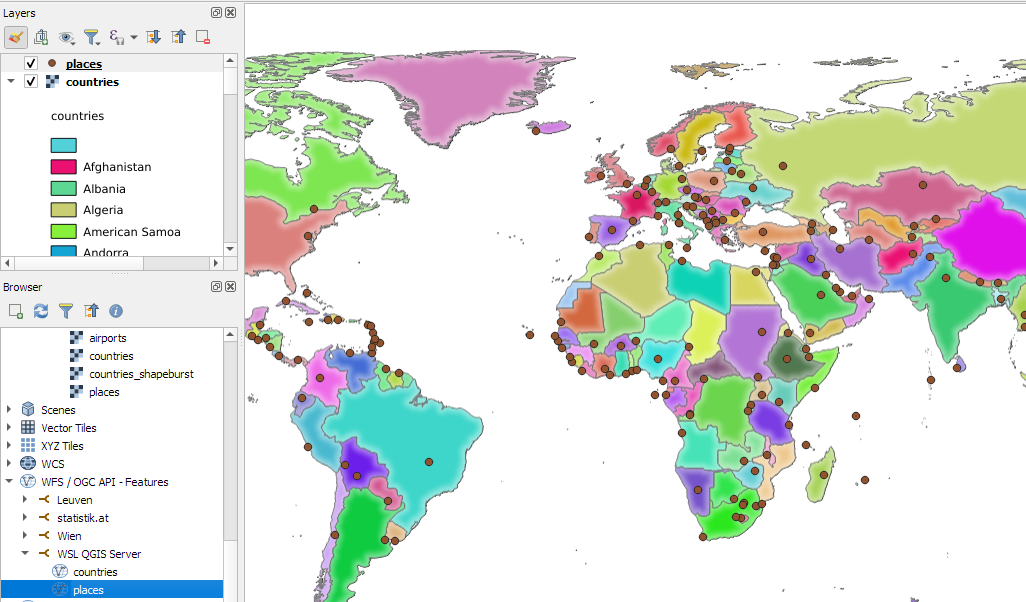
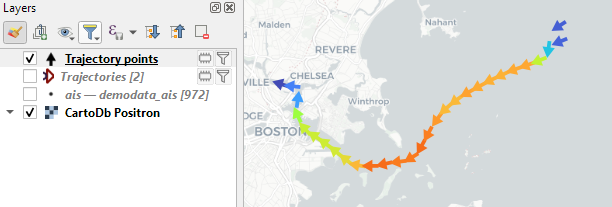
Of course, we can also add http://localhost:8010/ogc/world to the WMS and WFS server connections in our QGIS Desktop: