


Designing QGIS Cloud QWC2 with CSS
In an earlier post, I showed how it is possible to permanently position a legend in the QGIS Cloud map as part of a QGIS Cloud Pro subscription. To achieve this, the appearance of the map view was changed using CSS. In this post, I will describe exactly what this is and how it works. The appearance of the QGIS Cloud Web Client is controlled via CSS. CSS stands for Cascading Style Sheets.
New point clouds and mesh features in QGIS 3.36
QGIS 3.36 is round the corner and as usual, there will be several new exciting features with the new release. Below is the list of features our team has added to the new release. This was made possible by generous funding from clients.
Render point clouds as a surface in 2D map views
Point clouds are rendered as individual points by default. Depending on the zoom level and density of the points, you might not be able to get a full picture of the map.
Rendering points as surface enables you to have a better understanding of the data before trying to do any analysis or processing. This has been possible in 3D map views for a couple of QGIS releases, now we have added the functionality also in 2D map views.
The feature generates a surface using triangulation on-the-fly from the points using the same symbology. Below you can see the difference between a point cloud rendered as individual points and rendered as a surface:

The good news is that rendering as a surface also works well with global map shading, allowing users to get a nice hillshade:

To enable this feature, you need to check the option for Render as a Surface (Triangulate) under the Layer Styling panel.

Pro-tip: if the on-the-fly rendering as a surface takes too long to render, try increasing the Maximum error: for example 0.6 mm instead of the default 0.3 mm.
Flexible styling of classes
Previously, point cloud data visualisation in QGIS was limited to rendering all points with a uniform size and opacity. This made it difficult to differentiate between different point classes and highlight specific features of interest. To address this issue, we have introduced a new feature that allows users to customise the point size and opacity for each point cloud data class. This provides a flexible way for visualising point cloud data, allowing users to highlight specific point classes, e.g. by increasing the point size.


Set 3D map view extent in 2D map
Effectively navigating and visualising large-scale 3D datasets can be challenging on PCs with limited resources. To address this issue, we introduced a new feature that allows users to interactively limit the 3D scene, enabling them to focus on specific areas of interest. This new feature, conveniently accessible from the toolbar, eliminates the need for tedious manual entry of coordinates for bounding boxes. Instead, users can simply drag and draw a box around the desired area, instantly restricting the 3D scene to that specific extent. This interactive approach significantly enhances the user experience and streamlines the process of exploring and analysing 3D data:

Python API for 3D views
Creating and viewing 3D maps in QGIS with the correct camera location and angle, scene tilt, light, and other parameters can be a time-consuming and error-prone process. This is because it requires users to manually adjust these settings, often through trial and error. However, with the introduction of the new 3D map view API in QGIS, Python plugins can now automate this process, making it much easier, consistent and more efficient to create high-quality 3D maps that are visually appealing and informative.
# List all open 3D map canvases
iface.mapCanvases3D()
# [<qgis._3d.Qgs3DMapCanvas object at 0x7f23491b5e10>]
canvas = iface.mapCanvases3D()[0]
Now let’s try something more complicated:
# Let's change some settings!
ms = canvas.mapSettings()
ms.setEyeDomeLightingEnabled(True)
ms.setBackgroundColor(QColor('beige'))
ms.setTerrainMapTheme('dtm')
ms.setFieldOfView(110)

# Move the camera to look at specific map coordinates in layer's CRS
cam = canvas.cameraController()
mapPoint = QgsVector3D(-498175.92, -1205400.58, 210)
worldPoint = ms.mapToWorldCoordinates(mapPoint)
cam.setLookingAtPoint(worldPoint, 60, 45, 100)

# Create four new 3D map views
c1 = iface.createNewMapCanvas3D('South View')
c2 = iface.createNewMapCanvas3D('West View')
c3 = iface.createNewMapCanvas3D('North View')
c4 = iface.createNewMapCanvas3D('East View')

# Apply settings to all open 3D map views
for canvas in iface.mapCanvases3D():
	canvas.mapSettings().setEyeDomeLightingEnabled(True)

# Define a camera pose to update the views' cameras
pose = QgsCameraPose()
pose.setCenterPoint(QgsVector3D(0, 210, 0))  # This is in 3D world coordinates
pose.setDistanceFromCenterPoint(100)
pose.setPitchAngle(75)  # Tilt the camera by 75 degrees
pose.setHeadingAngle(0)  # Looking towards North
c1.cameraController().setCameraPose(pose)
pose.setHeadingAngle(90)  # Towards East
c2.cameraController().setCameraPose(pose)
pose.setHeadingAngle(180)  # Towards South
c3.cameraController().setCameraPose(pose)
pose.setHeadingAngle(270)  # Towards West
c4.cameraController().setCameraPose(pose)

# We can set the 3D map views 2D extent to always match the main 2D canvas one
# Our 3D views get updated while zooming/panning the main 2D canvas
canvas = iface.mapCanvas()
canvas.extentsChanged.connect(lambda :c1.mapSettings().setExtent(canvas.extent()))
canvas.extentsChanged.connect(lambda :c2.mapSettings().setExtent(canvas.extent()))
canvas.extentsChanged.connect(lambda :c3.mapSettings().setExtent(canvas.extent()))
canvas.extentsChanged.connect(lambda :c4.mapSettings().setExtent(canvas.extent()))

More point clouds attributes
LAS/LAZ/COPC point clouds have a classificationFlags attribute that stores four types of information (Synthetic, Keypoint, Withheld, and Overlap) in a single value. This saves space, but it makes it difficult to use the information for styling or filtering, as you need to write complex expressions.
To make it easier to use, we are following the approach introduced in PDAL 2.6: the classificationFlags attribute gets replaced with four separate attributes: Synthetic, Keypoint, Withheld, and Overlap. This will make it easier to include these attributes in styling and filtering expressions.
Performance enhancement for rendering
To improve the performance of point cloud rendering in QGIS, we introduced a new caching system to minimise the need for repeated decompression of LAS node data while panning or zooming. This caching mechanism efficiently stores decompressed points for each unique combination of layer URI, node, requested attributes, filter extent, and filter expression. This enables rapid rendering of previously cached nodes, significantly enhancing the overall rendering performance in 2D and 3D maps.
Performance can vary depending on actual data, but on a local sample COPC file, it renders 7 times faster with this change.
Labels for mesh layer
Viewing mesh data has been possible through styling, plotting or using the Identify tool. But now you can also create labels on mesh surfaces or vertices similar to vector layers.
To display labels for your mesh data, simply open the styling panel and enable labels for:
- Labels on Vertices
- Labels on Surfaces

Below is an example of mesh Z values at vertices (yellow) and mesh areas at cell centre (purple):

Want more changes in QGIS?
Do you want to see more improvements and new features in QGIS? Do not hesitate to contact us to discuss your requiremnets.
Finding geospatial accounts on Mastodon
Besides following hashtags, such as #GISChat, #QGIS, #OpenStreetMap, #FOSS4G, and #OSGeo, curating good lists is probably the best way to stay up to date with geospatial developments.
To get you started (or to potentially enrich your existing lists), I thought I’d share my Geospatial and SpatialDataScience lists with you. And the best thing: you don’t need to go through all the >150 entries manually! Instead, go to your Mastodon account settings and under “Import and export” you’ll find a tool to import and merge my list.csv with your lists:
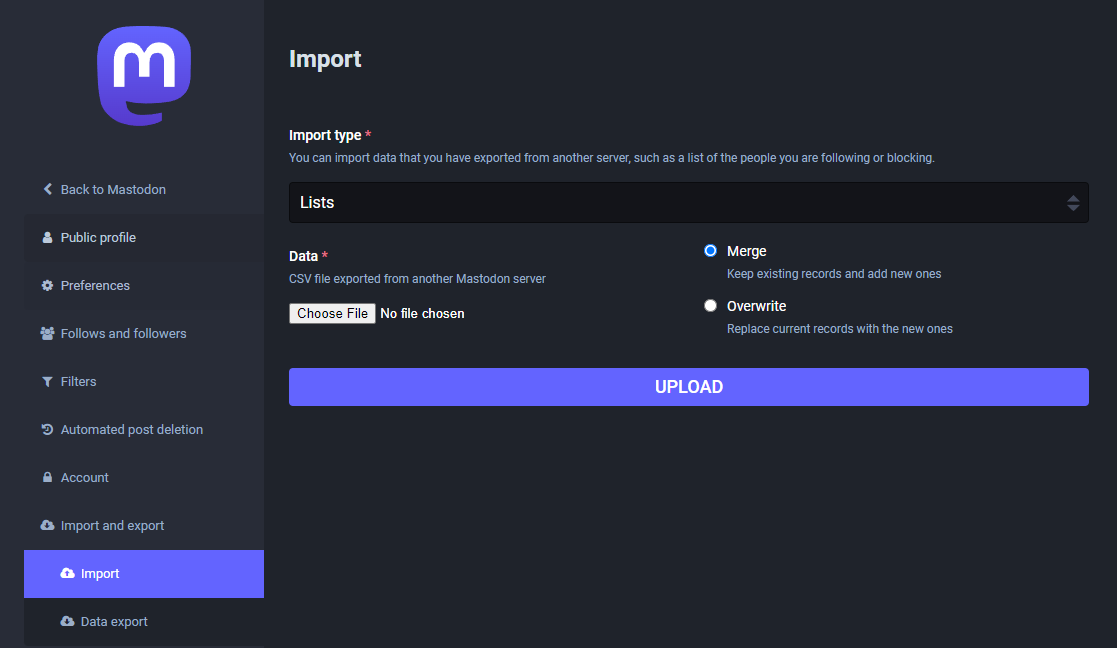
And if you are not following the geospatial hashtags yet, you can search or click on the hashtags you’re interested in and start following to get all tagged posts into your timeline:
[Case Study] Improving wildfire prevention and firefighting readiness
David Galloway works as a volunteer with the Wallcliffe Volunteer Fire Brigade in Western Australia. Volunteer brigades are the front line of firefighting and prevention across the State.
[Changelog] Enhanced synchronization performance and stability
The mobile app 2.5.0 contains multiple synchronization fixes and enhancements. Enjoy faster and more reliable file transfers!
[Changelog] Reset local changes from QGIS
With Mergin Maps QGIS Plugin 2024.1 you can now revert local changes of your QGIS project. Click on synchronise button in the toolbar and in the “Project status” dialog you will see new button to “Reset Changes”
Read the full changelog of the release: https://github.com/MerginMaps/qgis-plugin/releases/tag/2024.1
[Changelog] Stake out mode now supports multiple distance units
Users now have the flexibility to utilize a variety of distance units in the stake out mode, moving beyond the conventional meters. This enhancement allows for a more customized and user-friendly experience, catering to diverse geographic contexts and preferences.
To configure these distance units, navigate to QGIS project settings and change “distance units“ to your preferred units.
For detailed instructions on how to set up and leverage alternative distance units in stakeout mode, refer to our documentation https://merginmaps.com/docs/field/stake-out/#changing-stake-out-distance-units-in-qgis.
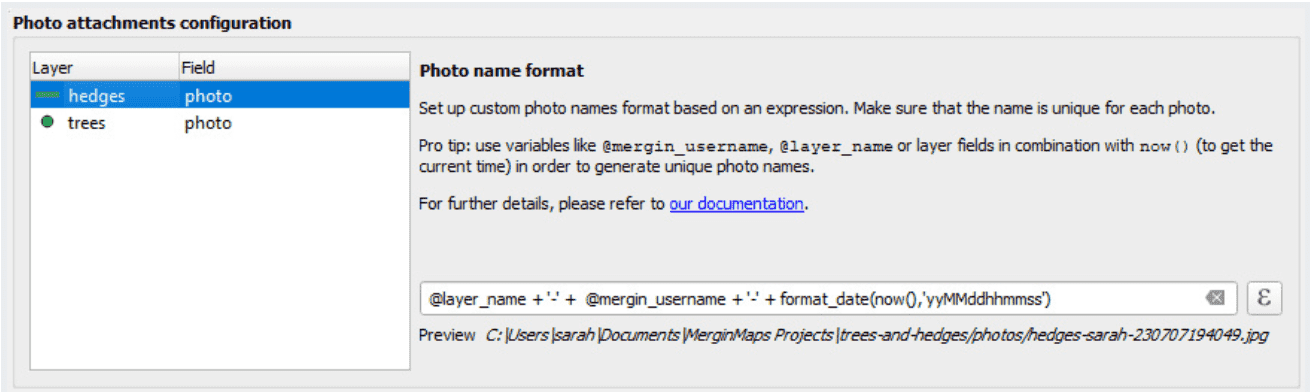
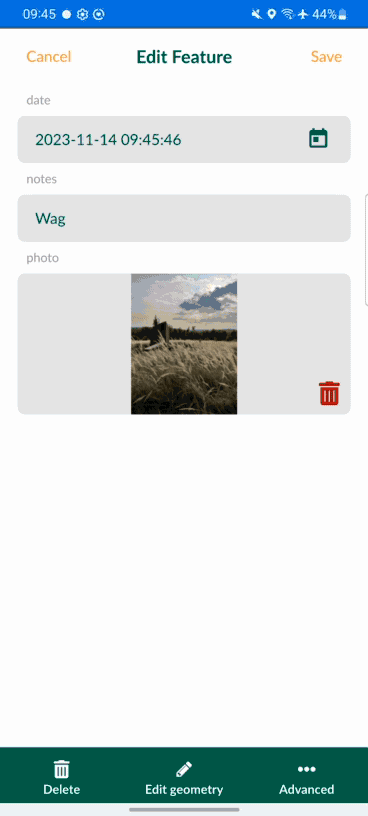
[Changelog] Ability to set custom name for photos taken in Mergin Maps mobile
Mergin Maps QGIS plugin is now capable of setting a custom QGIS expression that will be used as a name for the photos taken in the Mergin Maps mobile app. It is possible to combine field values, variables (even Mergin Maps variables) and other QGIS expression elements to create your custom photo name format (subfolders supported). You can find this configuration in the QGIS project settings > Mergin Maps.
 Available since Mergin Maps QGIS plugin 2023.2 and Mergin Maps mobile 2.2
Read more about this in our documentation here: https://merginmaps.com/docs/gis/photo-names/
[Blog] Mergin Maps 2023: our year in review
This year was another successful year for Mergin Maps, as we are growing to a feature-rich and scalable enterprise geodata collection solution.
[Changelog] Enhanced viewing: zoom feature now available in the mobile app
In our latest mobile app update, we've added an enhanced viewing feature that allows users to smoothly zoom in and out of images. This new functionality provides a more detailed and flexible viewing experience, letting you focus on intricate details or take in the big picture with ease. Navigate your visual data with precision and control!
[Case Study] Mapping ground points in Senegal for imagery stereo-preparation
Valentin was overseeing a large-scale stereo-preparation project in Senegal in order to adjust aerial imagery and LiDAR with recognizable ground control points
[Changelog] Enhanced feature identification speed
In our latest update, we've turbocharged the speed of feature identification on the map! Enjoy a faster and more responsive experience as you navigate and identify features with efficiency.
[Blog] View and track changes in QGIS
With the recent changes to the Mergin Maps plugin for QGIS, you can visualise the local changes before synchronising your data. Read more in our blog post!
[Changelog] Configure DB Sync right from your QGIS
QGIS Plugin now allows you to generate configuration file for DB Sync based on your PostgreSQL connections. Simply navigate to “Plugins → Mergin Maps → Configure DB Sync“ and follow the guide.
Resulting configuration file can be saved and used for synchronising our GPKG data with PostgreSQL. Read more about DB Sync here: https://merginmaps.com/docs/dev/dbsync/
[Changelog] Added support for text, spacer and HTML widgets
In our most recent update, we're thrilled to announce the addition of support for QGIS's spacer, text, and HTML widgets in our forms! This enhancement brings greater flexibility and customization to your data entry process. Easily incorporate spacers, add informative text, and use HTML elements to create dynamic and engaging forms tailored to your specific needs.
[Changelog] Easier way to prepare offline projects - download vector tile layers
Introducing an easier way to prepare offline projects!
Now, you can download vector tile layers seamlessly by simply right-clicking on the layer and selecting 'Make available offline...' - making offline project preparation a breeze.
For a step-by-step guide, check out our documentation here. Enhance your offline mapping experience today!
[Changelog] Position tracking is now available
I am pleased to announce that position tracking 📡 has been released today as part of Mobile version 2.3.0 and Plugin version 2023.3.
You can learn more about the tracking feature and how to set it up by visiting: https://merginmaps.com/docs/field/tracking/
Enjoy the tracking, and please let us know your thoughts! If you encounter any issues, please don’t hesitate to contact us.
Trajectools update: stop detection & trajectory styling
The Trajectools toolbox has continued growing:

I’m continuously testing the algorithms integrated so far to see if they work as GIS users would expect and can to ensure that they can be integrated in Processing model seamlessly.
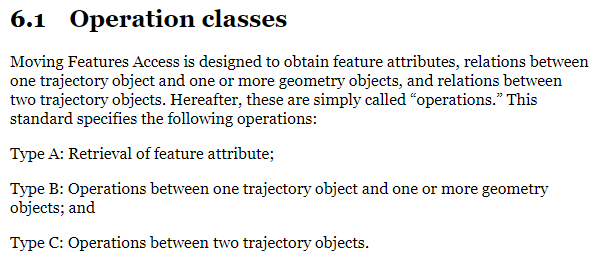
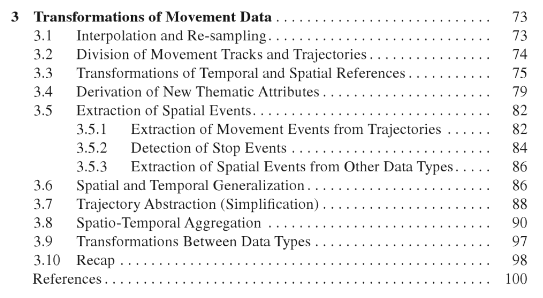
Because naming things is tricky, I’m currently struggling with how to best group the toolbox algorithms into meaningful categories. I looked into the categories mentioned in OGC Moving Features Access but honestly found them kind of lacking:
Andrienko et al.’s book “Visual Analytics of Movement” comes closer to what I’m looking for:
… but I’m not convinced yet. So take the above listed three categories with a grain of salt. Those may change before the release. (Any inputs / feedback / recommendation welcome!)
Let me close this quick status update with a screencast showcasing stop detection in AIS data, featuring the recently added trajectory styling using interpolated lines:

While Trajectools is getting ready for its 2.0 release, you can get the current development version directly from https://github.com/movingpandas/qgis-processing-trajectory.
