Related Plugins and Tags

QGIS Planet

Drive-time Isochrones from a single Shapefile using QGIS, PostGIS, and Pgrouting

This is a guest post by Chris Kohler .

Introduction:

This guide provides step-by-step instructions to produce drive-time isochrones using a single vector shapefile. The method described here involves building a routing network using a single vector shapefile of your roads data within a Virtual Box. Furthermore, the network is built by creating start and end nodes (source and target nodes) on each road segment. We will use Postgresql, with PostGIS and Pgrouting extensions, as our database. Please consider this type of routing to be fair, regarding accuracy, as the routing algorithms are based off the nodes locations and not specific addresses. I am currently working on an improved workflow to have site address points serve as nodes to optimize results. One of the many benefits of this workflow is no financial cost to produce (outside collecting your roads data). I will provide instructions for creating, and using your virtual machine within this guide.

Steps:–Getting Virtual Box(begin)–

Intro 1. Download/Install Oracle VM(https://www.virtualbox.org/wiki/Downloads)

Intro 2. Start the download/install OSGeo-Live 11(https://live.osgeo.org/en/overview/overview.html).

Pictures used in this workflow will show 10.5, though version 11 can be applied similarly. Make sure you download the version: osgeo-live-11-amd64.iso. If you have trouble finding it, here is the direct link to the download (https://sourceforge.net/projects/osgeo-live/files/10.5/osgeo-live-10.5-amd64.iso/download)
Intro 3. Ready for virtual machine creation: We will utilize the downloaded OSGeo-Live 11 suite with a virtual machine we create to begin our workflow. The steps to create your virtual machine are listed below. Also, here are steps from an earlier workshop with additional details with setting up your virtual machine with osgeo live(http://workshop.pgrouting.org/2.2.10/en/chapters/installation.html).

1.  Create Virutal Machine: In this step we begin creating the virtual machine housing our database.

Open Oracle VM VirtualBox Manager and select “New” located at the top left of the window.

VBstep1

Then fill out name, operating system, memory, etc. to create your first VM.

vbstep1.2

2. Add IDE Controller:  The purpose of this step is to create a placeholder for the osgeo 11 suite to be implemented. In the virtual box main window, right-click your newly-created vm and open the settings.

vbstep2

In the settings window, on the left side select the storage tab.

Find “adds new storage controller button located at the bottom of the tab. Be careful of other buttons labeled “adds new storage attachment”! Select “adds new storage controller button and a drop-down menu will appear. From the top of the drop-down select “Add IDE Controller”.

vbstep2.2

vbstep2.3

You will see a new item appear in the center of the window under the “Storage Tree”.

3.  Add Optical Drive: The osgeo 11 suite will be implemented into the virtual machine via an optical drive. Highlight the new controller IDE you created and select “add optical drive”.

vbstep3

A new window will pop-up and select “Choose Disk”.

vbstep3.2

Locate your downloaded file “osgeo-live 11 amd64.iso” and click open. A new object should appear in the middle window under your new controller displaying “osgeo-live-11.0-amd64.iso”.

vbstep3.3

Finally your virtual machine is ready for use.
Start your new Virtual Box, then wait and follow the onscreen prompts to begin using your virtual machine.
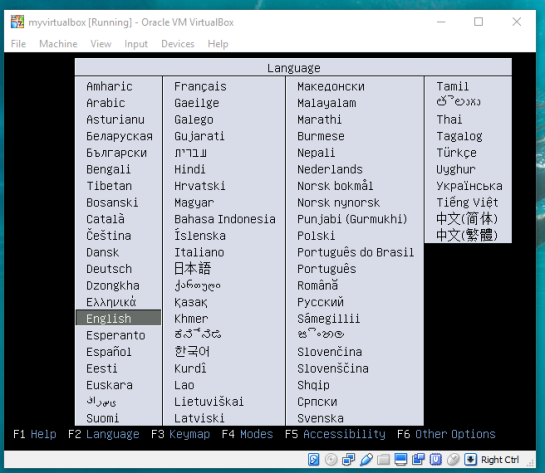
vbstep3.4

–Getting Virtual Box(end)—

4. Creating the routing database, and both extensions (postgis, pgrouting): The database we create and both extensions we add will provide the functions capable of producing isochrones.

To begin, start by opening the command line tool (hold control+left-alt+T) then log in to postgresql by typing “psql -U user;” into the command line and then press Enter. For the purpose of clear instruction I will refer to database name in this guide as “routing”, feel free to choose your own database name. Please input the command, seen in the figure below, to create the database:

CREATE DATABASE routing;

You can use “\c routing” to connect to the database after creation.

step4

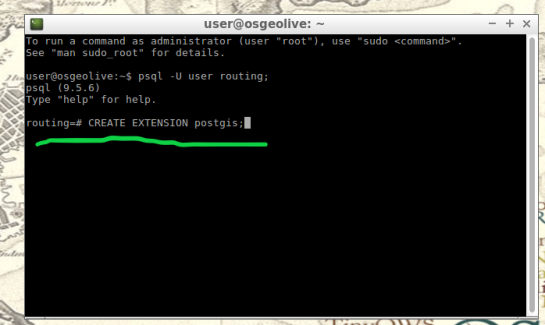
The next step after creating and connecting to your new database is to create both extensions. I find it easier to take two-birds-with-one-stone typing “psql -U user routing;” this will simultaneously log you into postgresql and your routing database.

When your logged into your database, apply the commands below to add both extensions

CREATE EXTENSION postgis;
CREATE EXTENSION pgrouting;
step4.2

step4.3

5. Load shapefile to database: In this next step, the shapefile of your roads data must be placed into your virtual machine and further into your database.

My method is using email to send myself the roads shapefile then download and copy it from within my virtual machines web browser. From the desktop of your Virtual Machine, open the folder named “Databases” and select the application “shape2pgsql”.

step5

Follow the UI of shp2pgsql to connect to your routing database you created in Step 4.

step5.2

Next, select “Add File” and find your roads shapefile (in this guide we will call our shapefile “roads_table”) you want to use for your isochrones and click Open.

step5.3

Finally, click “Import” to place your shapefile into your routing database.

6. Add source & target columns: The purpose of this step is to create columns which will serve as placeholders for our nodes data we create later.

There are multiple ways to add these columns into the roads_table. The most important part of this step is which table you choose to edit, the names of the columns you create, and the format of the columns. Take time to ensure the source & target columns are integer format. Below are the commands used in your command line for these functions.

ALTER TABLE roads_table ADD COLUMN "source" integer;
ALTER TABLE roads_table ADD COLUMN "target" integer;

step6

step6.2

7. Create topology: Next, we will use a function to attach a node to each end of every road segment in the roads_table. The function in this step will create these nodes. These newly-created nodes will be stored in the source and target columns we created earlier in step 6.

As well as creating nodes, this function will also create a new table which will contain all these nodes. The suffix “_vertices_pgr” is added to the name of your shapefile to create this new table. For example, using our guide’s shapefile name , “roads_table”, the nodes table will be named accordingly: roads_table_vertices_pgr. However, we will not use the new table created from this function (roads_table_vertices_pgr). Below is the function, and a second simplified version, to be used in the command line for populating our source and target columns, in other words creating our network topology. Note the input format, the “geom” column in my case was called “the_geom” within my shapefile:

pgr_createTopology('roads_table', 0.001, 'geom', 'id',
 'source', 'target', rows_where := 'true', clean := f)

step7

Here is a direct link for more information on this function: http://docs.pgrouting.org/2.3/en/src/topology/doc/pgr_createTopology.html#pgr-create-topology

Below is an example(simplified) function for my roads shapefile:

SELECT pgr_createTopology('roads_table', 0.001, 'the_geom', 'id')

8. Create a second nodes table: A second nodes table will be created for later use. This second node table will contain the node data generated from pgr_createtopology function and be named “node”. Below is the command function for this process. Fill in your appropriate source and target fields following the manner seen in the command below, as well as your shapefile name.

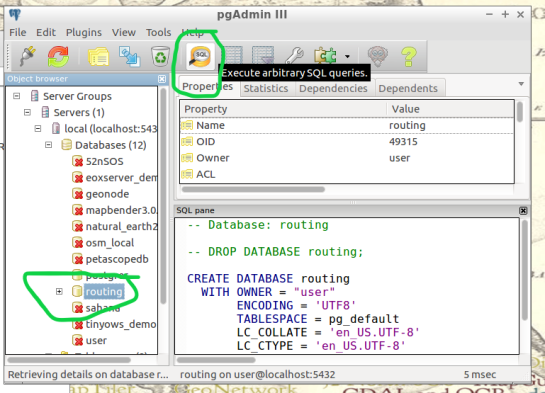
To begin, find the folder on the Virtual Machines desktop named “Databases” and open the program “pgAdmin lll” located within.

step8

Connect to your routing database in pgAdmin window. Then highlight your routing database, and find “SQL” tool at the top of the pgAdmin window. The tool resembles a small magnifying glass.
step8.2

We input the below function into the SQL window of pgAdmin. Feel free to refer to this link for further information: (https://anitagraser.com/2011/02/07/a-beginners-guide-to-pgrouting/)

CREATE TABLE node AS
   SELECT row_number() OVER (ORDER BY foo.p)::integer AS id,
          foo.p AS the_geom
   FROM (     
      SELECT DISTINCT roads_table.source AS p FROM roads_table
      UNION
      SELECT DISTINCT roads_table.target AS p FROM roads_table
   ) foo
   GROUP BY foo.p;

step8.3

  1.  Create a routable network: After creating the second node table from step 8,  we will combine this node table(node) with our shapefile(roads_table) into one, new, table(network) that will be used as the routing network. This table will be called “network” and will be capable of processing routing queries.  Please input this command and execute in SQL pgAdmin tool as we did in step 8. Here is a reference for more information:(https://anitagraser.com/2011/02/07/a-beginners-guide-to-pgrouting/)   

step8.2


CREATE TABLE network AS
   SELECT a.*, b.id as start_id, c.id as end_id
   FROM roads_table AS a
      JOIN node AS b ON a.source = b.the_geom
      JOIN node AS c ON a.target = c.the_geom;
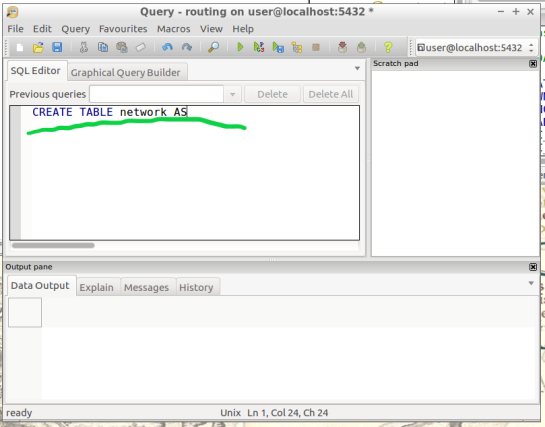
step9.2

10. Create a “noded” view of the network:  This new view will later be used to calculate the visual isochrones in later steps. Input this command and execute in SQL pgAdmin tool.

CREATE OR REPLACE VIEW network_nodes AS 
SELECT foo.id,
 st_centroid(st_collect(foo.pt)) AS geom 
FROM ( 
  SELECT network.source AS id,
         st_geometryn (st_multi(network.geom),1) AS pt 
  FROM network
  UNION 
  SELECT network.target AS id, 
         st_boundary(st_multi(network.geom)) AS pt 
  FROM network) foo 
GROUP BY foo.id;

step10

11.​ Add column for speed:​ This step may, or may not, apply if your original shapefile contained a field of values for road speeds.

In reality a network of roads will typically contain multiple speed limits. The shapefile you choose may have a speed field, otherwise the discrimination for the following steps will not allow varying speeds to be applied to your routing network respectfully.

If values of speed exists in your shapefile we will implement these values into a new field, “traveltime“, that will show rate of travel for every road segment in our network based off their geometry. Firstly, we will need to create a column to store individual traveling speeds. The name of our column will be “traveltime” using the format: ​double precision.​ Input this command and execute in the command line tool as seen below.

ALTER TABLE network ADD COLUMN traveltime double precision;
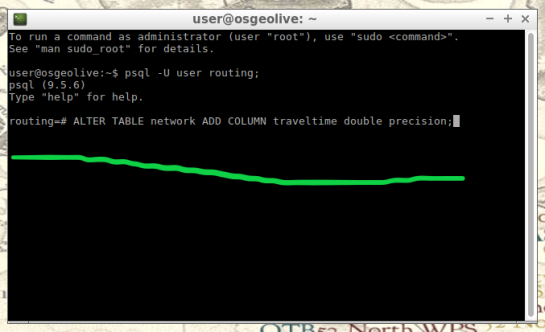
step11

Next, we will populate the new column “traveltime” by calculating traveling speeds using an equation. This equation will take each road segments geometry(shape_leng) and divide by the rate of travel(either mph or kph). The sample command I’m using below utilizes mph as the rate while our geometry(shape_leng) units for my roads_table is in feet​. If you are using either mph or kph, input this command and execute in SQL pgAdmin tool. Below further details explain the variable “X”.

UPDATE network SET traveltime = shape_leng / X*60
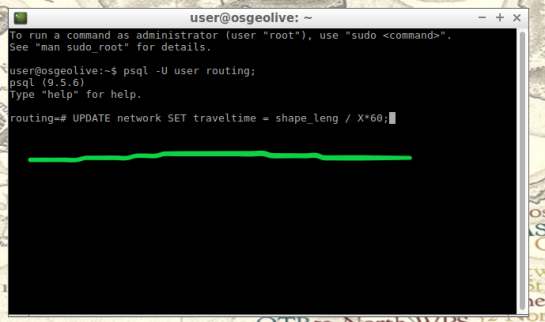
step11.2

How to find X​, ​here is an example​: Using example 30 mph as rate. To find X, we convert 30 miles to feet, we know 5280 ft = 1 mile, so we multiply 30 by 5280 and this gives us 158400 ft. Our rate has been converted from 30 miles per hour to 158400 feet per hour. For a rate of 30 mph, our equation for the field “traveltime”  equates to “shape_leng / 158400*60″. To discriminate this calculations output, we will insert additional details such as “where speed = 30;”. What this additional detail does is apply our calculated output to features with a “30” value in our “speed” field. Note: your “speed” field may be named differently.

UPDATE network SET traveltime = shape_leng / 158400*60 where speed = 30;

Repeat this step for each speed value in your shapefile examples:

UPDATE network SET traveltime = shape_leng / X*60 where speed = 45;
UPDATE network SET traveltime = shape_leng / X*60 where speed = 55;

The back end is done. Great Job!

Our next step will be visualizing our data in QGIS. Open and connect QGIS to your routing database by right-clicking “PostGIS” in the Browser Panel within QGIS main window. Confirm the checkbox “Also list tables with no geometry” is checked to allow you to see the interior of your database more clearly. Fill out the name or your routing database and click “OK”.

If done correctly, from QGIS you will have access to tables and views created in your routing database. Feel free to visualize your network by drag-and-drop the network table into your QGIS Layers Panel. From here you can use the identify tool to select each road segment, and see the source and target nodes contained within that road segment. The node you choose will be used in the next step to create the views of drive-time.

12.Create views​: In this step, we create views from a function designed to determine the travel time cost. Transforming these views with tools will visualize the travel time costs as isochrones.

The command below will be how you start querying your database to create drive-time isochrones. Begin in QGIS by draging your network table into the contents. The visual will show your network as vector(lines). Simply select the road segment closest to your point of interest you would like to build your isochrone around. Then identify the road segment using the identify tool and locate the source and target fields.

step12

step12.2

Place the source or target field value in the below command where you see ​VALUE​, in all caps​.

This will serve you now as an isochrone catchment function for this workflow. Please feel free to use this command repeatedly for creating new isochrones by substituting the source value. Please input this command and execute in SQL pgAdmin tool.

*AT THE BOTTOM OF THIS WORKFLOW I PROVIDED AN EXAMPLE USING SOURCE VALUE “2022”

CREATE OR REPLACE VIEW "​view_name" AS 
SELECT di.seq, 
       di.id1, 
       di.id2, 
       di.cost, 
       pt.id, 
       pt.geom 
FROM pgr_drivingdistance('SELECT
     gid::integer AS id, 
     Source::integer AS source, 
     Target::integer AS target,                                    
     Traveltime::double precision AS cost 
       FROM network'::text, ​VALUE::bigint, 
    100000::double precision, false, false)
    di(seq, id1, id2, cost)
JOIN network_nodes pt ON di.id1 = pt.id;
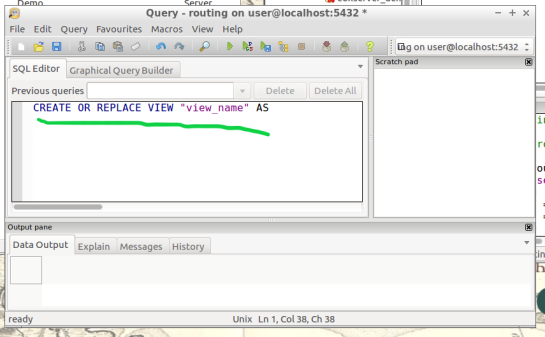
step12.3

13.Visualize Isochrone: Applying tools to the view will allow us to adjust the visual aspect to a more suitable isochrone overlay.

​After creating your view, a new item in your routing database is created, using the “view_name” you chose. Drag-and-drop this item into your QGIS LayersPanel. You will see lots of small dots which represent the nodes.

In the figure below, I named my view “take1“.

step13

Each node you see contains a drive-time value, “cost”, which represents the time used to travel from the node you input in step 12’s function.
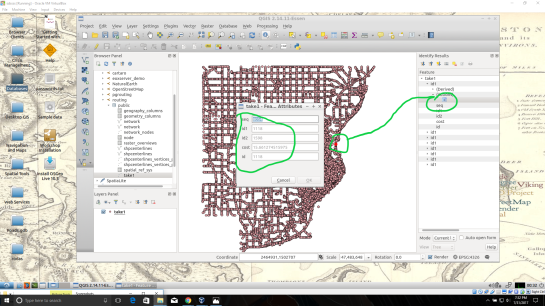
step13.2

Start by installing the QGIS plug-in Interpolation” by opening the Plugin Manager in QGIS interface.
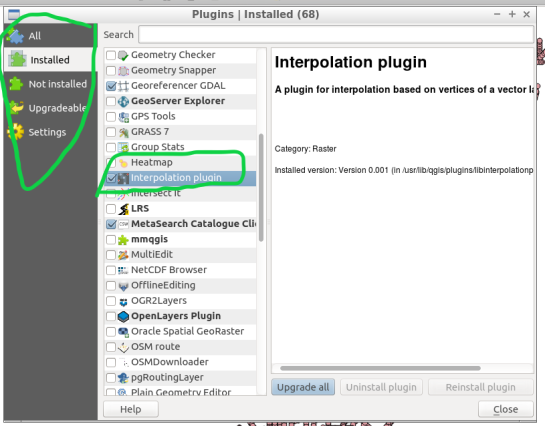
step13.3

Next, at the top of QGIS window select “Raster” and a drop-down will appear, select “Interpolation”.
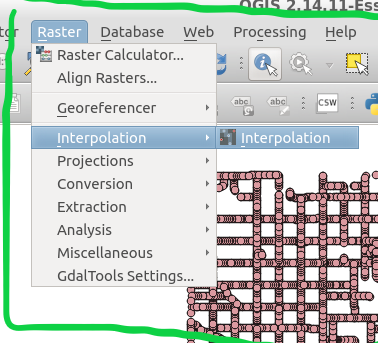
step13.4


A new window pops up and asks you for input.

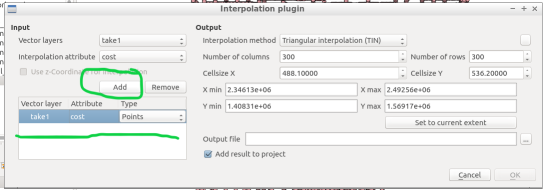
step13.5

Select your “​view”​ as the​ vector layer​, select ​”cost​” as your ​interpolation attribute​, and then click “Add”.

step13.6

A new vector layer will show up in the bottom of the window, take care the type is Points. For output, on the other half of the window, keep the interpolation method as “TIN”, edit the ​output file​ location and name. Check the box “​Add result to project​”.

Note: decreasing the cellsize of X and Y will increase the resolution but at the cost of performance.

Click “OK” on the bottom right of the window.

step13.7

A black and white raster will appear in QGIS, also in the Layers Panel a new item was created.
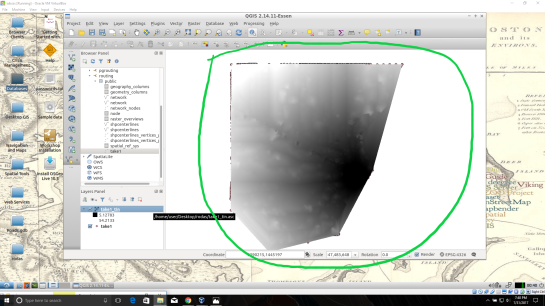
step13.8

Take some time to visualize the raster by coloring and adjusting values in symbology until you are comfortable with the look.

step13.9

step13.10

14. ​Create contours of our isochrone:​ Contours can be calculated from the isochrone as well.

Find near the top of QGIS window, open the “Raster” menu drop-down and select Extraction → Contour.

step14

Fill out the appropriate interval between contour lines but leave the check box “Attribute name” unchecked. Click “OK”.

step14.2

step14.3

15.​ Zip and Share:​ Find where you saved your TIN and contours, compress them in a zip folder by highlighting them both and right-click to select “compress”. Email the compressed folder to yourself to export out of your virtual machine.

Example Isochrone catchment for this workflow:

CREATE OR REPLACE VIEW "2022" AS 
SELECT di.seq, Di.id1, Di.id2, Di.cost,                           
       Pt.id, Pt.geom 
FROM pgr_drivingdistance('SELECT gid::integer AS id,                                       
     Source::integer AS source, Target::integer AS target, 
     Traveltime::double precision AS cost FROM network'::text, 
     2022::bigint, 100000::double precision, false, false) 
   di(seq, id1, id2, cost) 
JOIN netowrk_nodes pt 
ON di.id1 = pt.id;

References: Virtual Box ORACLE VM, OSGeo-Live 11  amd64 iso, Workshop FOSS4G Bonn(​http://workshop.pgrouting.org/2.2.10/en/index.html​),
QGIS versioning plugin

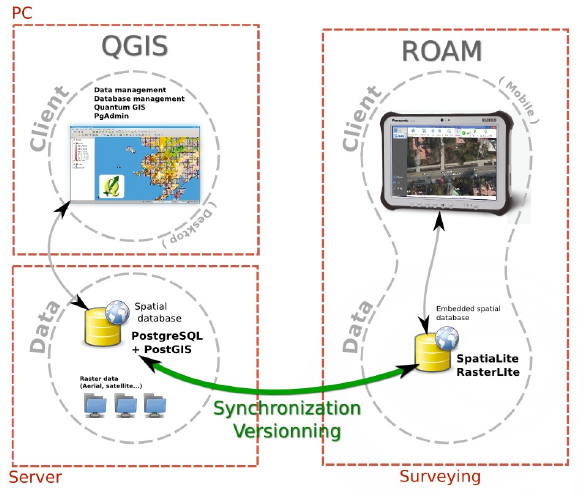
We developped a tool to manage data history, branches, and to work offline with your PostGIS-stored data and QGIS. Read more to get the insight of QGIS Versioning plugin.
The QGIS plugin is available in QGIS plugin repository, and you can `fork it on GitHub too https://github.com/Oslandia/qgis-versioning !

Introduction

Even if the necessity of data versioning often arises, no standard solution exist for databases.

The GeoGit project proposes a solution to store versioned geospatial data. There is also an existing plugin for QGIS, pgversion, which uses views and triggers to version a PostGIS database. Unfortunately those solutions were not adapted to the specific constrains of this project, namely: using a PostGIS database as the main repository (excludes GeoGit) and the ability to working off-line (excludes pgversion).The project we developed QGIS/PostGIS versioning looks like the following.


Design

The database is stored in a PostGIS schema, the complete schema is versioned (i.e. not individual tables). Revisions are identified by a revision number. A revision table in the versioned schema, called ‘revisions’, keeps track of the date, author, commit message and branch of all revisions.

Once a table structure is defined, three operations can be performed on rows: INSERT, DELETE and UPDATE. To be able to track history, every row is kept in the tables. Deleted rows are marked as such and updated rows are a combined insertion-deletion where the deleted and added rows are linked to one another as parent and child.|

A total of five columns are needed for versioning the first branch:

PRIMARY KEY
a unique identifier across the table

branch_rev_begin
revision when this record was inserted

branch_rev_end
last revision for which this record exist (i.e. revision when it was deleted minus one)

branch_parent
in case the row has been inserted as the result of an update, this fields stores the hid of the row that has been updated

branch_child
in case the row has been marked as deleted as the result of an update, this field stores the hid of the row that has been inserted in its place.

For each additional branch, four additional columns are needed (the ones with the prefix branch_).

Note:
If the branch_rev_begin is null, it means that a row belongs to another branch.

SQL views are used to see the database for a given revision number. If we note ‘rev’ the revision we want to see. For each table, the condition for a row to be present is the view is::

(branch_rev_end IS NULL OR branch_rev_end >= rev) AND branch_rev_begin <= rev

In the special case of the current revision, or head revision, the condition reads::

branch_rev_end IS NULL AND branch_rev_begin IS NOT NULL

Note:
Since elements are not deleted (but merely marked as such) from an historized table, care must be taken with the definition of constrains, in particular the conceptual unicity of a field values.

Withing the PostGIS database, the views on revisions must be read-only  and historized tables should not be edited directly. This is a basic principle for version control: editions must be made to working copies an then committed to the database. Please note that by default PostGIS 9.3 creates updatable views.

Workflow schema

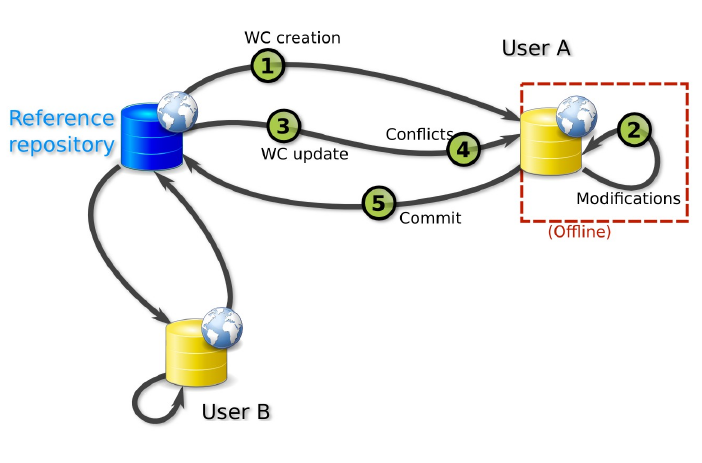
This setup allows for multiple users to use and edit data offline from a central repository, and commit their modifications concurrently.

Working copies

Two kinds of working copies are available:

SpatiaLite working copies
They are meant to be used off-line. They consist of the versioned tables of a given versioned database (i.e. PostGIS schema) or any subset. For each table, only the elements that have not been marked as deleted in the head revision need to be present. Furthermore only a subset of the elements the user needs to edit can be selected (e.g. a spatial extend).  To create a working copy (i.e. to checkout), tables from the versioned schema (or the aforementioned subsets) are converted to a SpatiaLite database using ogr2ogr.

PostGIS working copies
They are meant to be used when the connection to the original database will remain available. They are quite similar to pgversion working copies since they only store differences from a given revision (the one checked out).

The following description is aimed at understanding the inner workings of the qgis versioning plugin. The user does not need to perform the described operations manually.

For each versioned table in the working copy, a view is created with the suffix _view (e.g. mytable_view). Those views typically filters out the historization columns and shows the head revision. A set of triggers is defined to allow updating on those views (DELETE, UPDATE and INSERT).

The DELETE trigger simply marks the end revision of a given record.

The INSERT trigger create a new record and fills the branch_rev_begin field.

The UPDATE trigger create a new record and fills the branch_rev_begin and branch_parent fields. It then marks the parent record as deleted, and fills the branch_rev_end and branch_child fields.

Updating the working copy

Changes can be made to the database while editing the working copy. In order to reconcile those edition, the user needs to update the working copy.

When updating, a set of records can be in conflicts: the records for which the end revision has been set since the initial checkout or last update if any.

Multiple editions can be made to the same record. Therefore the child relation must be followed to the last child in order to present tu user with the latest state of a given conflicting feature.

Conflicts are stored in a table and identified with a conflict id and the tag ‘theirs’ or ‘mine’. A DELETE trigger on this table is used for conflict resolution. On deletion of ‘mine’, the working copy edition is discarded, on deletion of ‘theirs’ the working copy edition is appended to the feature history (i.e. the working copy feature becomes a child of the last state of the feature in the historized database).

Committing the editions to the versionned database

If a working copy is up to date, the editions can be integrated in the versioned database. This operation consists simply in the insertion of a record in the revisions table, and, for each versioned table, the update of rows that are different and inserting rows that are not present.

Branching

A branch can be created from any revision by adding the four history columns and setting the branch_rev_begin field of features that are present in their revision.

Plugin interface tutorial

Groups are used for all versioning operations in QGIS since the versions are for a complete PostGIS schema or SpatiaLite database.

The versioning toolbar will change depending on the group selected in the QGIS legend.

Note:
The group elements must share the same connection information (i.e. share the same database and schema for PostGIS working copies and revision views or share same SpatiaLite database for SpatiaLite working copies).

Versioning a PostGIS schema

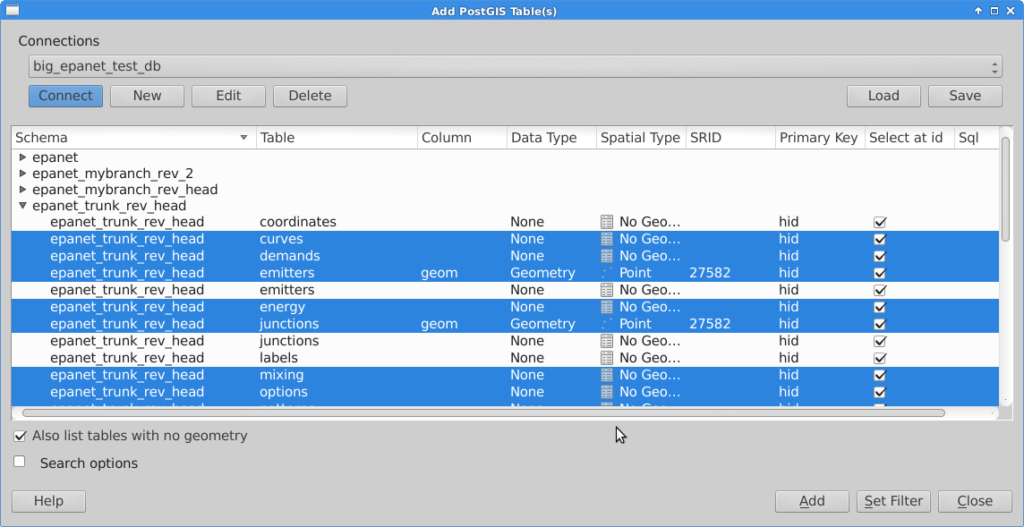
Starting with an unversioned database, import a number of layers from a schema that needs to be versioned into a QGIS project.

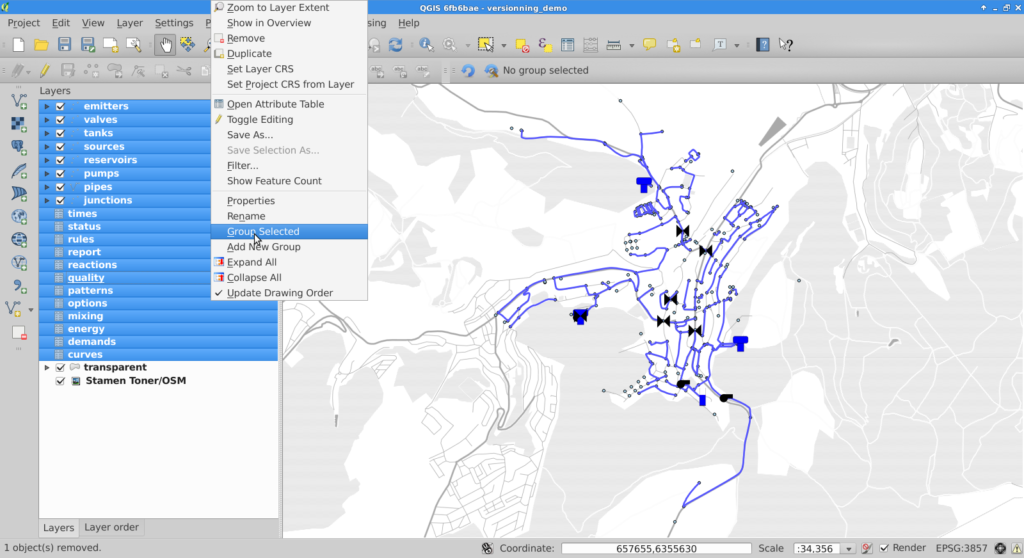
Once the layers are imported, they must be grouped together.

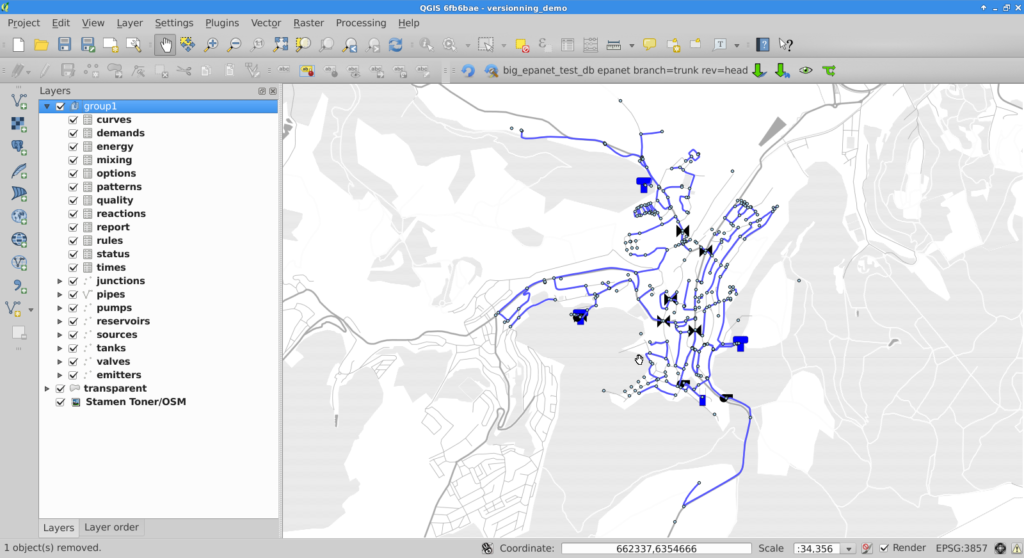
Selecting the newly created group will cause the versioning toolbar to display the historize button (green V). On click a confirmation is requested to version the database schema.

The versioned layers are imported in a new group and the original layers are removed from the project.

Note:
The symobology is not kept in the process.

Working with a versioned PostGIS schema

Versioned layers can be imported in QGIS. The layers must be from a head revision or a view on any revision.


Once the layers are in QGIS, they must be grouped.


For PostGIS groups at head revision, the versioning plugin allows the user to create a SpatiaLite or a PostGIS working copy, create a view on a given revision or create a branch. A corresponding group will be imported in QGIS.

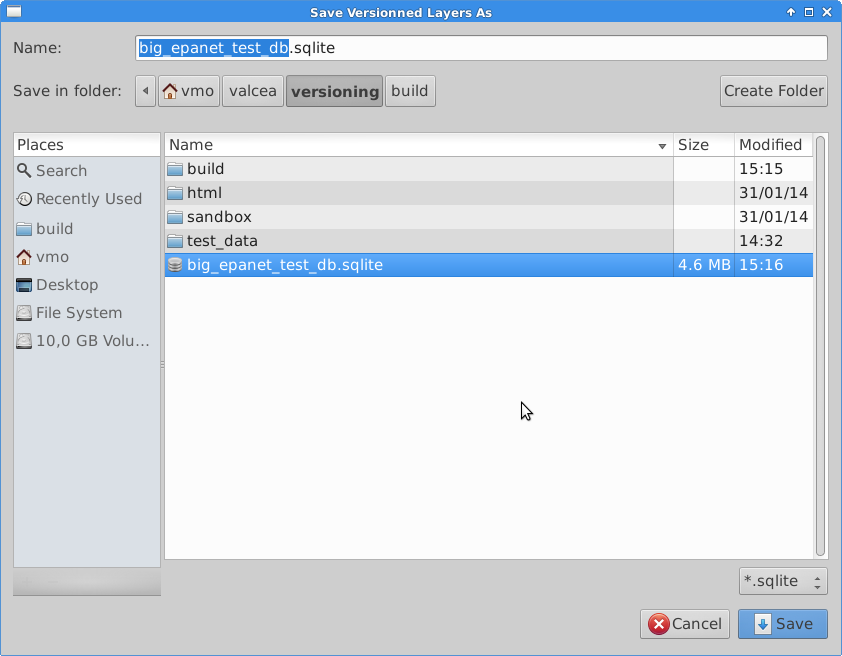
If the user chooses to create a SpatiaLite working copy, he will be asked to select a file to store the working copy.


Commiting changes

Once the working copy is imported in QGIS, the user can start edition of its layers. With SpatiaLite working copies, this edition can be done off-line.

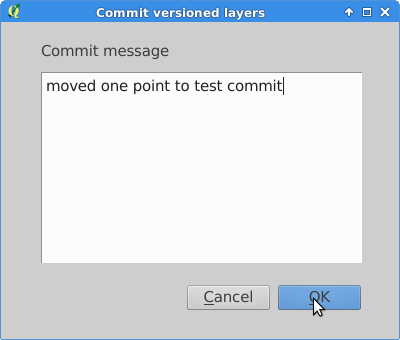
When the user is done with edition, he can commit the changes to the database and if commit is feasible (i.e. the working copy is up to date with the versioned database), he will be prompted for a commit message and subsequently be informed of the revision number he committed.


If the commit is not feasible, the user will be informed that he must update his working copy prior to commit.

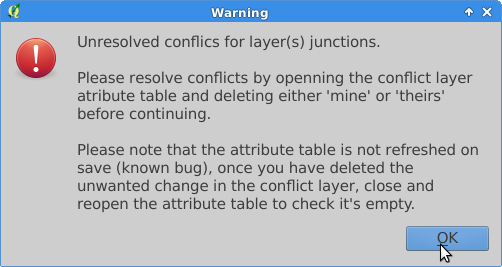
Resolving conflicts

Conflicts are detected during update, the user is informed, and conflicts layers are imported into QGIS.

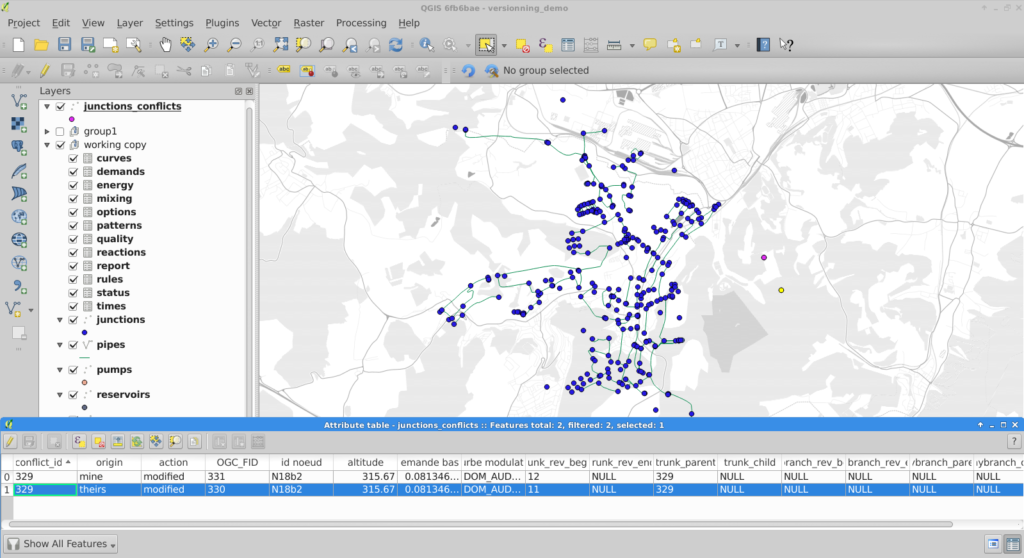
To resolve conflicts, the user can open the conflict layer’s attribute table. Selected entries are also selected on the map canvas and the user can decide which version, either his or the database’s, he wants to keep. User version is tagged with ‘mine’ and database version with ‘theirs’. The conflict is resolved by deleting the unwanted entry in the conflict layer.

Note:
On deletion of one conflict entry, both entries are removed (by a trigger) but the attribute table (and canvas) are not refreshed. As a workaround, the user can close and re-open the attribute table to see the actual state of the conflict table.

Once the conflict table is empty, the commit can be done.

Restrictions

Due to design choices and tools used for conversion to SpatiaLite, a number of restrictions apply to the versioned database:

  • |schemas, tables and branch names should not have space, caps or quotes
  • tables must have primary keys
  • columns are lowercase (because of conversion to SpatiaLite) but can have spaces (not that it’s recommended
  • geometry column is geom in PostGIS, GEOMETRY in SpatiaLite

Note
Do not edit OGC_FID or ROWID

Note
The constrains on the tables are be lost in the PostGIS to SpatiaLite conversion.

Known bug

The conflict layer won’t be loaded automatically is it has no geometry. The user will have to load it manually.

QGIS plugin for water management

Oslandia releases today a new plugin for the QGIS processing framework, allowing for water distribution network simulation. It integrates the opensource EPANET simulation software. EPANET models water distribution networks. It’s a widely used public-domain simulation software developed by the US Environmental Protection Agency.

Hydraulic simulation is used to understand water distribution in distribution network, to forecast the impact of network alterations, to dimension network elements or study extreme case scenarios (e.g. important demand for firefighting, pipes breakages, interruption in supply).

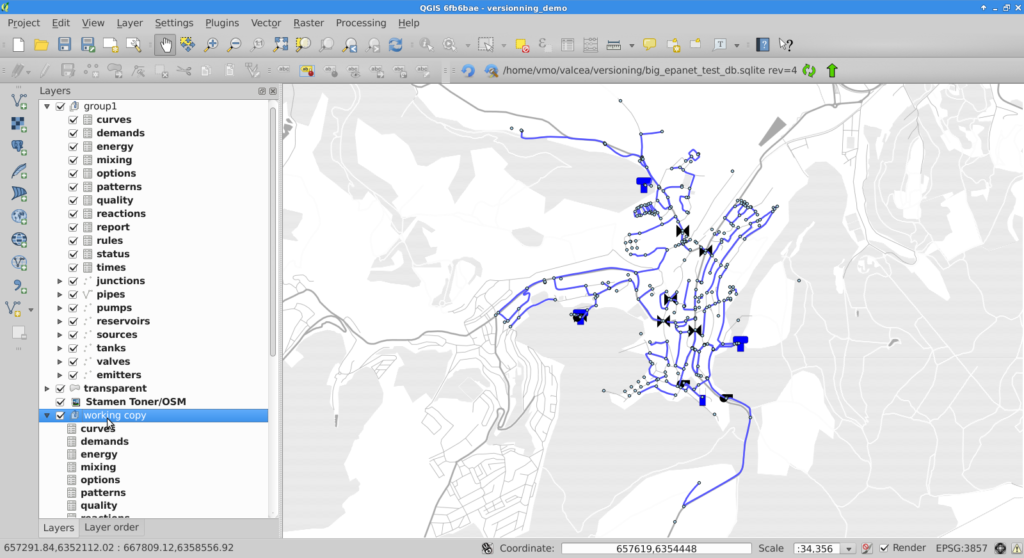
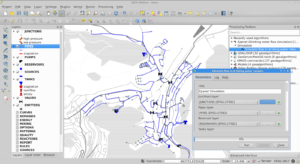
QGIS provides a graphical user interface that can be used to import/edit/export hydraulic model elements and simulation parameters from various sources, launch simulation and visualize results directly inside QGIS.

Hydraulic model

A hydraulic model consists of junctions (POINT) and pipes (LINESTRING) along with various other elements like tanks, pumps and valves. Those elements can be stored as features in a spatially enabled database. Features attributes can be simple (e.g. pipe diameter) or complex (e.g. pumps characteristic curves or water consumption). Complex attributes are stored via a foreign key in other alphanumeric tables.

This is the kind of data QGIS is designed to handle. It can import/export them from/to a variety of sources and also display and edit them.

Simulation parameters

Simulation parameters and options (e.g. simulation time step or accuracy) are key-value pairs. The values can be stored in a table which columns are keys. Each set of simulation parameters is then a record in this table. This kind of table can be loaded in QGIS as a vector layer without geometry.

Integration in the processing framework

Once the hydraulic model and simulation parameters are loaded in QGIS, the simulation can be launched through the Processing toolbox. The plugin uses the standalone command line interface of EPANET (CLI) which path needs to be specified in processing Options and configuration.

The plugin assembles an EPANET input file, runs EPANET and parses its output to generate result layers.

One interesting aspect with processing modules is that they can be used for chained processing: the user can use other modules to do additional transformations of simulation results, as feeding them into another simulation model.

Result visualization

Simulation results are water pressure and velocity at all points in the network along with state of network elements (e.g. volume in tanks, power of pumps) for all simulation time steps . This represent a huge amount of data that are usually displayed either as time-plots or as map-plots of time aggregated data (e.g. max and min during simulation).

Results of particular interest are:

  • time-plots of:
    • volume in reservoirs
    • flow at pumps
    • pressure in pipes and at junctions
  • map-plots of:
    • low speed (stagnation)
    • high and low pressure (risk of breakage, unhappy consumer)
    • lack of level variation in reservoirs (stagnation)
    • empty reservoir
    • reservoir overflow
    • abnormal pressure (typical of error in the altitude of a node in the model)
    • flow direction

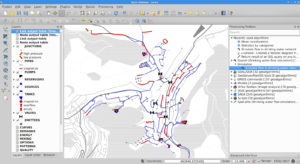
QGIS is naturally suited for map-plots. Time-aggregated simulation results are automatically joined to map layers when the result table is added to the map. Rule-based symbology is used to highlight zones of concern (e.g. low water velocity or empty reservoirs).

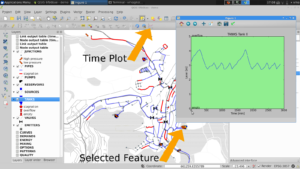
The matplotlib library provides 2D plotting facilities in python and QGIS provides an extensive set of selection tools (on the map or in tables). The plugin’s button plots the appropriate value depending on the selected feature type (e.g. water level for tanks, pressure for junctions).

Screencast

For a full demo of this plugin, see the following video :


Where and who

The plugin is available on GitHub and should be available soon on QGIS plugin repository : https://github.com/Oslandia/qgis-epanet

This work has been funded by European Funds. Many thanks to the GIS Office of Apavil, Valcea County (Romania). Oslandia has developped this plugin, and provides support and development around QGIS, PostGIS and this plugin. Get in touch if you need more : [email protected]

We are looking for a free dataset with full informations (pumps, tanks, valves, pipes and their characteristics…) to distribute with this plugin as a test case and demonstration. If you can provide this, mail us !

We also are implementing a Processing plugin for SWMM, the public domain Waste-water simulation tool. If you are interested to participate to the development, please contact us.

PostGIS 3D &#8211; Foss4g video and workshop

The latest PostGIS and QGIS 3D enhancements presented at FOSS4G by Oslandia are available online.We suggest you to have a look on our PostGIS 3D / QGIS 3D video demonstration using SFCGAL library and the QGIS Horao plugin.

A step by step workshop, (really close to the video workflow) is also available online  https://github.com/Oslandia/Workshops/tree/master/FOSS4G_2013_PostGIS_3D

We can provide you the full virtual machine on demand, with proper software environment (6GB Virtual Box Image).

We would be really interested in having your advice on these new 3D features, and the use cases you could be interested in. Do not hesitate to get in touch.

Contact us at [email protected] for any information.

QGIS Community meeting in Brighton

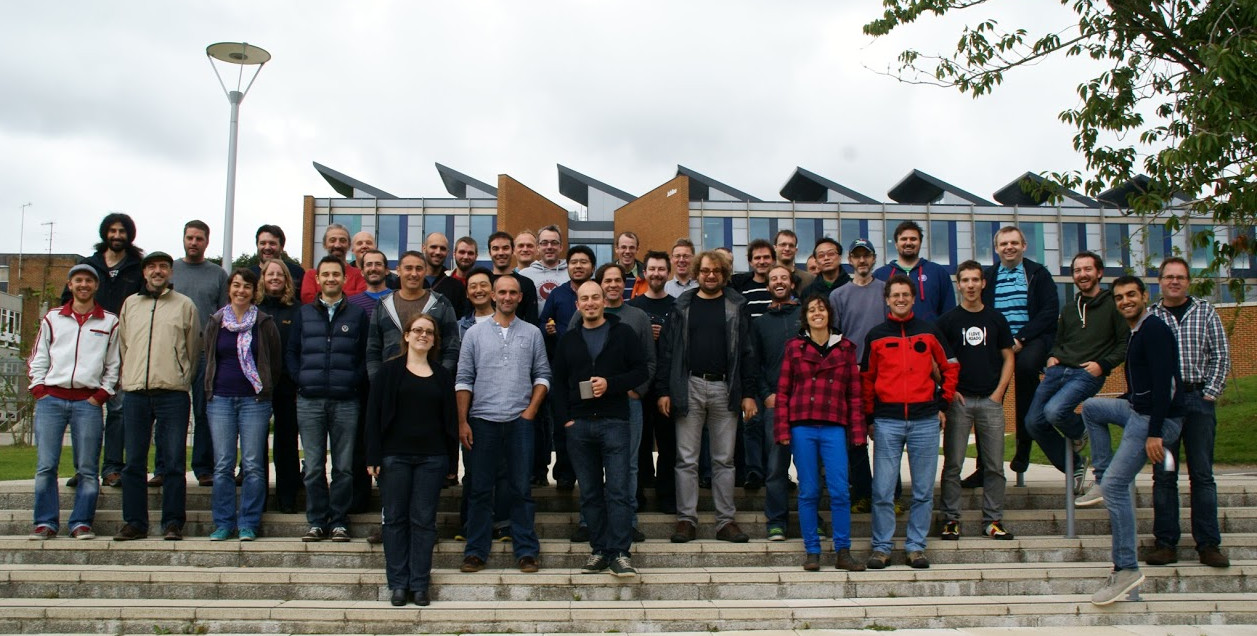
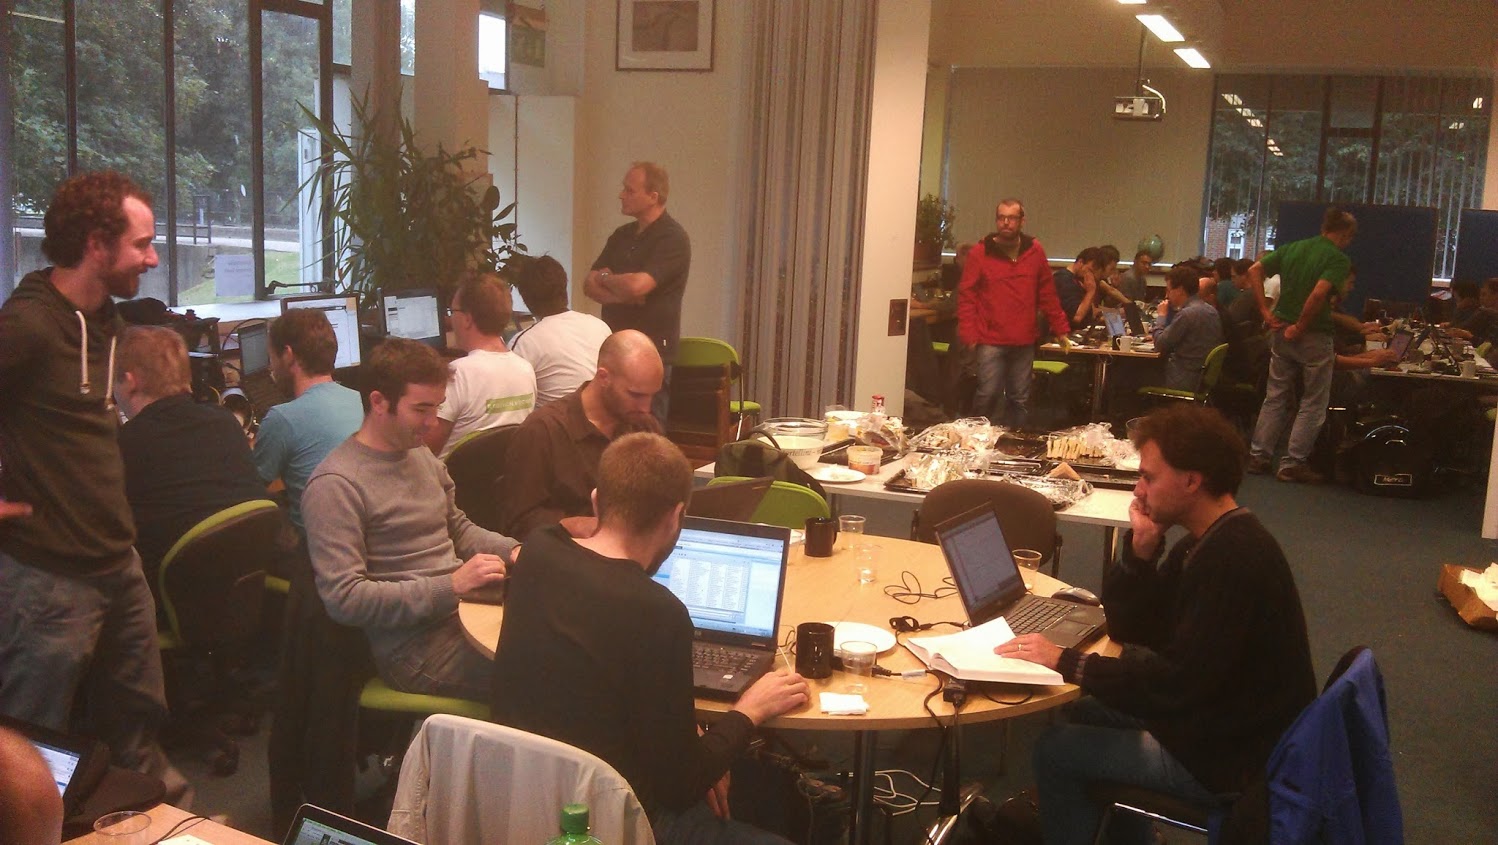
Developers and contributors from the QGIS project are used to gather physically twice a year across different countries. Such an event allows people to synchronize their effort, and discuss new possible developments.cThe latest QGIS community meeting took place in Brighton from the 12th to the 16th of September, just before the FOSS4G event. It was the biggest community meeting organized so far, with close to 50 people attending ! Everything went smooth thanks to the perfect organization by Lutra Consulting.

This session was of particular interest in the project’s history, since it was dedicated to the release of the eagerly-awaited new 2.0 version of QGIS.

Oslandia is used to take part in the event and even organized the march 2012 session in Lyon.


Presentations

Despite being originally oriented toward code and translations, some presentations took place during the event. Some of them have been video recorded, some did not. Hereafter is a subset of them.

A new website

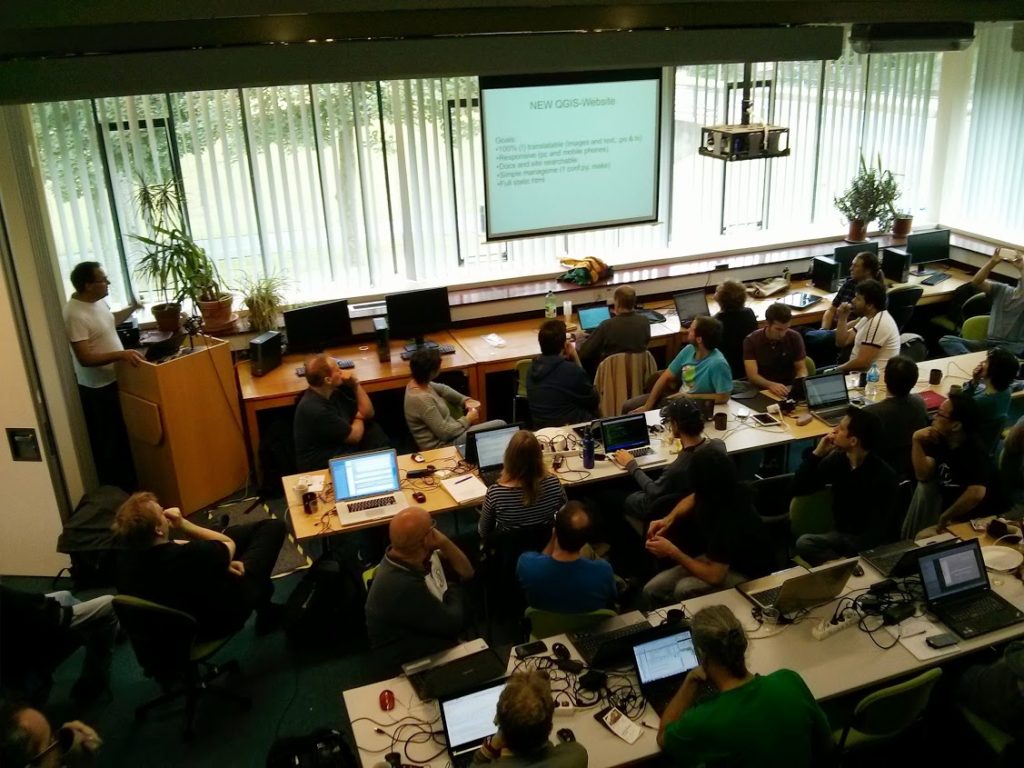
In parallel to the release of the 2.0 version, the QGIS website has been updated. Its look and feel, but also the way it is now build. Richard Duivenvoorde presented the efforts that have been put on the support of multiple languages, adaptation to mobile devices, and the reuse of tools used for building the documentation of the project. The new website is now online.

Richard presenting the new website


Presentation of the new website : http://www.ustream.tv/recorded/38687971

Constraints on attributes

Some more developer-oriented presentations and discussions also took place. Matthias Kuhn and Nathan Woodrow presented an idea about extending the way attributes are handled by QGIS. In particular, the concept of constrained attributes emerged. The idea is to be able to express, manipulate and edit contrains on attributes (possible range of values for instance) as it is found in databases. This could then be used to constrain user editing of layers, presenting to the user an appropriate widget (combo box for an enumeration for instance), especially for layers that do not have native support for these constraints.

QGIS for Android tablets

RealworldSystems presented their work on what they called the “QGIS Mobility framework”, based on previous works by Marco Bernasocchi on QGIS for Android. It is dedicated to the design of custom QGIS applications for deployment on Android tablets (for on-the-field editing campains for instance). It looks promising and has already been used in a real-world application for gaz pipeline inspection. The framework can be found on github.

QGIS webserver

Andreas Neumann presented evolutions of QGIS webserver and webclient. More can be found in the corresponding video.

Andreas presenting the work on QGIS webserver and webclient

Video 1 http://www.ustream.tv/recorded/38741015

Evolution of the Globe plugin

Matthias Kuhn presented evolutions he made to the Globe plugin that allows to display a 3D earth with different kinds of data on it. Lots of osgearth features are now integrated into the Globe plugin (in particular the support for 2D vector layers).

Matthias presenting its work on the Globe plugin

Video 2 http://www.ustream.tv/recorded/38737991

Visualisation of 3D data

Oslandia presented also its ongoing work on the integration of Postgis 3D. After a thourought evaluation of osgearth, which is the base of the Globe plugin, we decided to develop our own 3D visualisation stack directly on top of OpenSceneGraph.

A QGIS plugin has also been developed in order to be able to view QGIS layers in 3D.

With this new 3D visualisation stack we are able to display and manipulate data of a whole city between 20 and 60 frames per second on a laptop (here the demo has been designed on data from the city of Lyon) , when we were hardly able to display a small city quarter with Globe.

Oslandia presenting its work on its 3D visualisation stack

Video 3 http://www.ustream.tv/recorded/38738897

Slides https://github.com/Oslandia/presentations/tree/master/qgis_hf_2013

QGIS 2.0

All the work done during this community meeting allowed to polish the 2.0 version of QGIS which has been publicly announced during the FOSS4G in Nottingham by Tim Sutton.
Waiting now for the 2.1 release 🙂

Movement data in GIS: issues & ideas

Since I’ve started working, transport and movement data have been at the core of many of my projects. The spatial nature of movement data makes it interesting for GIScience but typical GIS tools are not a particularly good match.

Dealing with the temporal dynamics of geographic processes is one of the grand challenges for Geographic Information Science. Geographic Information Systems (GIS) and related spatial analysis methods are quite adept at handling spatial dimensions of patterns and processes, but the temporal and coupled space-time attributes of phenomena are difficult to represent and examine with contemporary GIS. (Dr. Paul M. Torrens, Center for Urban Science + Progress, New York University)

It’s still a hot topic right now, as the variety of related publications and events illustrates. For example, just this month, there is an Animove two-week professional training course (18–30 September 2016, Max-Planck Institute for Ornithology, Lake Konstanz) as well as the GIScience 2016 Workshop on Analysis of Movement Data (27 September 2016, Montreal, Canada).

Space-time cubes and animations are classics when it comes to visualizing movement data in GIS. They can be used for some visual analysis but have their limitations, particularly when it comes to working with and trying to understand lots of data. Visualization and analysis of spatio-temporal data in GIS is further complicated by the fact that the temporal information is not standardized in most GIS data formats. (Some notable exceptions of formats that do support time by design are GPX and NetCDF but those aren’t really first-class citizens in current desktop GIS.)

Most commonly, movement data is modeled as points (x,y, and optionally z) with a timestamp, object or tracker id, and potential additional info, such as speed, status, heading, and so on. With this data model, even simple questions like “Find all tracks that start in area A and end in area B” can become a real pain in “vanilla” desktop GIS. Even if the points come with a sequence number, which makes it easy to identify the start point, getting the end point is tricky without some custom code or queries. That’s why I have been storing the points in databases in order to at least have the powers of SQL to deal with the data. Even so, most queries were still painfully complex and performance unsatisfactory.

So I reached out to the Twitterverse asking for pointers towards moving objects database extensions for PostGIS and @bitnerd, @pwramsey, @hruske, and others replied. Amongst other useful tips, they pointed me towards the new temporal support, which ships with PostGIS 2.2. It includes the following neat functions:

  • ST_IsValidTrajectory — Returns true if the geometry is a valid trajectory.
  • ST_ClosestPointOfApproach — Returns the measure at which points interpolated along two lines are closest.
  • ST_DistanceCPA — Returns the distance between closest points of approach in two trajectories.
  • ST_CPAWithin — Returns true if the trajectories’ closest points of approach are within the specified distance.

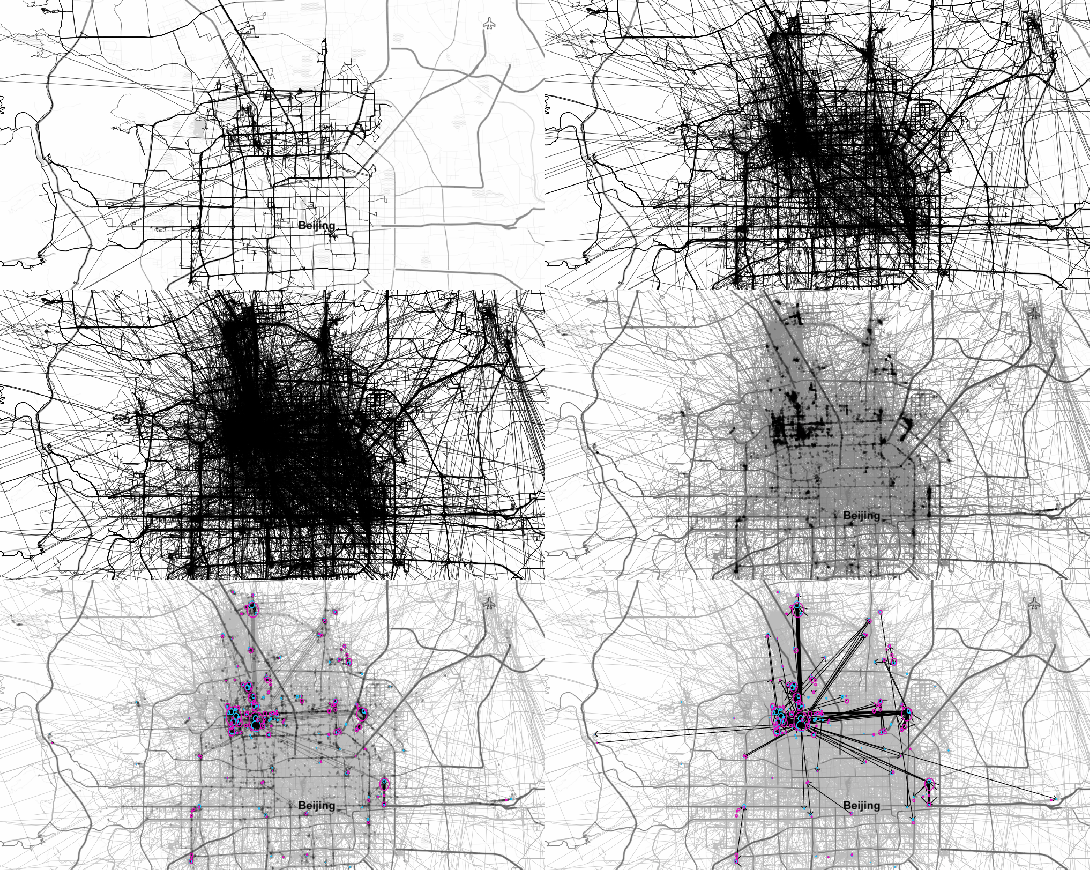
Instead of  points, these functions expect trajectories that are stored as LinestringM (or LinestringZM) where M is the time dimension. This approach makes many analyses considerably easier to handle. For example, clustering trajectory start and end locations and identifying the most common connections:

animation_clusters

(data credits: GeoLife project)

Overall, it’s an interesting and promising approach but there are still some open questions I’ll have to look into, such as: Is there an efficient way to store additional info for each location along the trajectory (e.g. instantaneous speed or other status)? How well do desktop GIS play with LinestringM data and what’s the overhead of dealing with it?


Getting multipolygon vertexes using PostGIS

EN | PT

Today I needed to create a view in PostGIS that returned the vertexes of a multi-polygon layer. Besides, I needed that they were numerically ordered starting in 1, and with the respective XY coordinates.

Screenshot from 2015-11-05 23:58:19

It seemed to be a trivial task – all I would need was to use the ST_DumpPoints() function to get all vertexes – if it wasn’t for the fact that PostGIS polygons have a duplicate vertex (the last vertex must be equal to the first one) that I have no interess in showing.

After some try-and-fail, I came up with the following query:

CREATE OR REPLACE VIEW public.my_polygons_vertexes AS
WITH t AS -- Transfor polygons in sets of points
    (SELECT id_polygon,
            st_dumppoints(geom) AS dump
     FROM public.my_polygons),
f AS -- Get the geometry and the indexes from the sets of points 
    (SELECT t.id_polygon,
           (t.dump).path[1] AS part,
           (t.dump).path[3] AS vertex,
           (t.dump).geom AS geom
     FROM t)
-- Get all points filtering the last point for each geometry part
SELECT row_number() OVER () AS gid, -- Creating a unique id
       f.id_polygon,
       f.part,
       f.vertex,
       ST_X(f.geom) as x, -- Get point's X coordinate
       ST_Y(f.geom) as y, -- Get point's Y coordinate
       f.geom::geometry('POINT',4326) as geom -- make sure of the resulting geometry type
FROM f 
WHERE (f.id_polygon, f.part, f.vertex) NOT IN
      (SELECT f.id_polygon,
              f.part,
              max(f.vertex) AS max
       FROM f
       GROUP BY f.id_polygon,
                f.part);

The interesting part occurs in the WHERE clause, basically, from the list of all vertexes, only the ones not included in the list of vertexes with the maximum index by polygon part are showed, that is, the last vertex of each polygon part.

Here’s the result:

Screenshot from 2015-11-05 23:58:40

The advantage of this approach (using PostGIS) instead of using “Polygons to Lines” and “Lines to points” processing tools is that we just need to change the polygons layer, and save it, to see our vertexes get updated automatically. It’s because of this kind of stuff that I love PostGIS.

Labels leading lines with QGIS and Postgis

EN | PT

Recently I had the need to add labels to features with very close geometries, resulting in their collision.

Capturar_3

Using data-defined override for label’s position (I have used layer to labeled layer plugin to set this really fast) and the QGIS tool to move labels, it was quite easy to relocate them to better places. However, in same cases, it was difficult to understand to which geometry they belonged.

Capturar_2

I needed some kind of leading lines to connect, whenever necessary, label and feature. I knew another great plugin called “Easy Custom Labeling“, by Regis Haubourg, that did what I needed, but it would create a memory duplicate of the original layer, wish meant that any edition on the original layer wouldn’t be updated in the labels.

Since the data were stored in a PostgreSQL/Postgis database, I have decided to create a query that would return a layer with leading lines. I used the following query in DB manager:

SELECT
  gid,
  label,
  ST_Makeline(St_setSRID(ST_PointOnSurface(geom),27493), St_setSRID(St_Point(x_label::numeric, y_label::numeric),27493))
FROM
  epvu.sgev
WHERE
  x_label IS NOT NULL AND
  y_label IS NOT NULL AND
  NOT ST_Within(ST_Makeline(St_setSRID(ST_PointOnSurface(geom),27493), St_setSRID(St_Point(x_label::numeric, y_label::numeric),27493)),geom))

This query creates a line by using the feature centroid as starting point and the label coordinate as end point. The last condition on the WHERE statement assures that the lines are only created for labels outside the feature.

Capturar_1

With the resulting layer loaded in my project, all I need is to move my labels and save the edition (and press refresh) to show a nice leading line.

guidelines

A new QGIS tool (based on ogr2ogr) to import vectors in PostGIS, the fast way

In QGIS there are many tools that can be used to import vectors inside a PostGIS database, each one has pros and cons: SPIT core plugin: available since long ago but now seems to be a unmaintained tool and therefore will be probably removed in a future QGIS release. It  has the advantage to allow […]

Dissolver polígonos em Postgres\Postgis

Trata-se de um cenário muito recorrente em análise espacial. Tendo uma camada\tabela composta por diversos polígonos, queremos “juntá-los” de acordo com valores distintos de um ou mais atributos (exemplo: de uma camada com os limites de freguesias, queremos obter os concelhos, ou, da COS ao 3º nível, obter o 2º ou o 1º)

Este artigo tem como objectivo mostrar como fazê-lo em Postgres\Postgis.

Tabela de exemplo

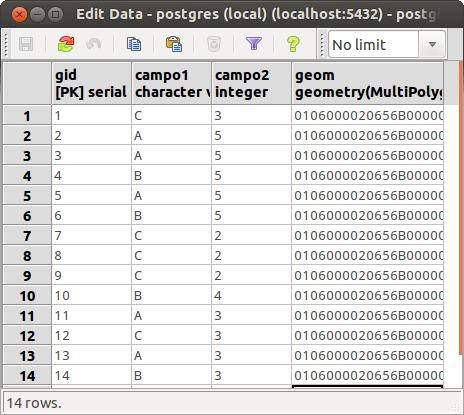
Como exemplo vou usar uma tabela como o seguinte formato:

CREATE TABLE tabela_1
    (gid serial PRIMARY KEY,
     campo1 character varying(128),
     campo2 integer,
     geom geometry(MultiPolygon,27493);

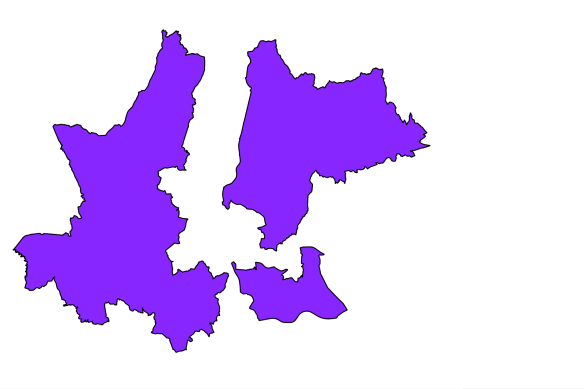
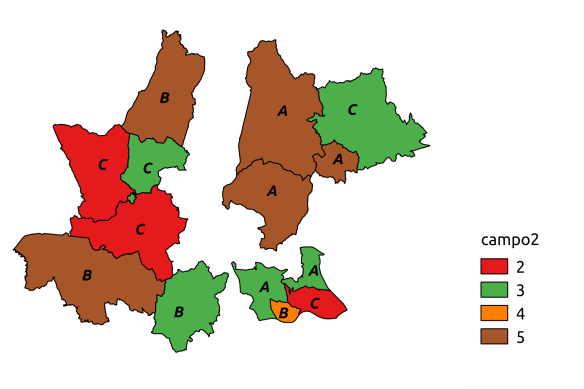
tabela1_original_tabela

tabela1_original

Dissolver todos os polígonos

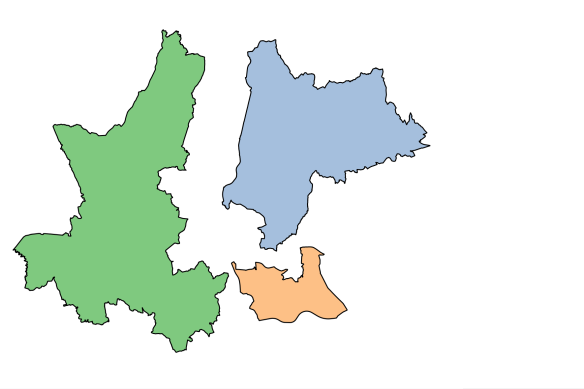
Em primeiro lugar podemos simplesmente agregar todos os elementos num multi-polígono único. Para tal usamos a função ST_Union().

SELECT
    ST_Union(t.geom) as geom
FROM
    tabela_1 as t;

tabela1_union

Separar polígonos que não sejam contíguos

Se por outro lado não quisermos que o resultado apresente multi-polígonos usamos a função ST_Dump() recolhendo o campo da geometria.

SELECT
    (ST_Dump(ST_Union(t.geom))).geom as geom
FROM
    tabela_1 as t;

tabela1_union_dump

Dissolver polígonos com base em valores dos campos

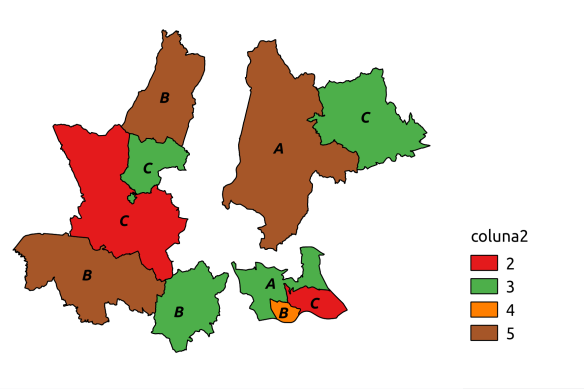
Se quisermos dissolver os polígonos que tenham valores iguais num ou mais campos, basta incluí-los na cláusula GROUP BY. Se quisermos que esses campos apareçam no resultado (geralmente queremos) há que referi-los no início do SELECT.

SELECT
    campo1,
    campo2,
    (ST_Dump(ST_Union(t.geom))).geom as geom
FROM
    tabela_1 as t
GROUP BY
    campo1,
    campo2;

tabela1_union_by_value

Nota 1: Para quem prefere usar interfaces gráficos, preencher formulários e clicar em botões, o uso de SQL para fazer este tipo de operações pode parecer demasiado complicado e até um pouco retrógrado. Mas uma coisa garanto, com alguma prática as dificuldades iniciais são ultrapassadas e os benefícios que se retiram deste tipo de abordagem são muito recompensadores.

Nota 2: Visualizar o resultado deste tipos consultas de agregação (que usam a cláusula GROUP BY) no QGIS pode ser desafiante, este artigo explica como ultrapassar essa dificuldade.


Training courses calendar: QGIS (Desktop, Server and Web) and PostGIS

We just published our Training Courses calendar for the period September 2014 – January 2015. This includes training courses about QGIS (Desktop, Server and Web) and PostgreSQL/PostGIS in both Italy and Portugal. Training courses about QGIS python programming are available on demand. For details (locations, prices, discounts, etc.) about training courses in Portugal see: http://www.faunalia.eu/pt/training.html […]

Packaging PostGIS dev releases with Docker

Packaging PostGIS dev releases with Docker

We recently added support for GML curves to PostGIS, which enables TinyOWS to deliver WFS requests with curve geometries. More on this in a later post. This enhancement is in the current PostGIS developement version (SVN master) and not released yet. To enable our customer testing this functionality, we had to build packages for their server environment which is Ubuntu Precise with UbuntuGIS repositories. After working with Linux LXC containers and it's predecessor VServer for years, Docker was a logical choice for a clean reproducible build environment.

Rebuilding a Debian package is usually quite easy:

apt-get build-dep <package>
apt-get source <package>
cd <packagedir>
#Make your changes
dch -i
dpkg-buildpackage

But getting build dependencies for PostGIS currently fails with libssl-dev conflicts, maybe because the dev packages got out of sync after the recent Heartblead updates. So the Dockerfile uses equivs to build a dummy package which satisfies the dependencies.

The command

docker run -v /tmp:/pkg sourcepole/postgis-svn-build-env sh -c 'cp /root/*postgis*.deb /pkg'

loads the Docker image with packages built from the latest SVN version of PostGIS in /root and copies the deb files from the containter into /tmp.

Now we're ready to install these packages on the Ubuntu server:

sudo dpkg -i /tmp/*postgis*.deb

Thats it. Feedback welcome!

@PirminKalberer

P.S.

If you happen to be a developer, then you may prefer running a cutting-edge version of PostGIS in a Docker container instead of building packages. Our colleagues from Oslandia just published how to do this.

Packaging PostGIS dev releases with Docker

Packaging PostGIS dev releases with Docker

We recently added support for GML curves to PostGIS, which enables TinyOWS to deliver WFS requests with curve geometries. More on this in a later post. This enhancement is in the current PostGIS developement version (SVN master) and not released yet. To enable our customer testing this functionality, we had to build packages for their server environment which is Ubuntu Precise with UbuntuGIS repositories. After working with Linux LXC containers and it's predecessor VServer for years, Docker was a logical choice for a clean reproducible build environment.

Rebuilding a Debian package is usually quite easy:

apt-get build-dep <package>
cd <packagedir>
#Make your changes
dch -i
dpkg-buildpackage

But getting build dependencies for PostGIS currently fails with libssl-dev conflicts, maybe because the dev packages got out of sync after the recent Heartblead updates. So the Dockerfile uses equivs to build a dummy package which satisfies the dependencies.

The command

docker run -v /tmp:/pkg sourcepole/postgis-svn-build-env sh -c 'cp /root/*postgis*.deb /pkg'

loads the Docker image with packages built from the latest SVN version of PostGIS in /root and copies the deb files from the containter into /tmp.

Now we're ready to install these packages on the Ubuntu server:

sudo dpkg -i /tmp/*postgis*.deb

Thats it. Feedback welcome!

@PirminKalberer

P.S.

If you happen to be a developer, then you may prefer running a cutting-edge version of PostGIS in a Docker container instead of building packages. Our colleagues from Oslandia just published how to do this.

Installing PostGIS on Fedora 20

In order to explore all the new interfaces to PostGIS (from QGIS, GDAL, GRASS GIS 7 and others) I decided to install PostGIS 2.1 on my Fedora 20 Linux box. Eventually it is an easy job but I had to visit a series of blogs to refresh my dark memories from past PostGIS installations done some years ago… So, here the few steps:

# become root
su -
# grab the PostgreSQL 9.3 server and PostGIS 2.1
yum install postgresql-server postgresql-contrib postgis

Now the server is installed but yet inactive and not configured. The next step is to initialize, configure and start the PostgreSQL server:

# initialize DB:
postgresql-setup initdb
# start at boot time:
chkconfig postgresql on
# fire up the daemon:
service postgresql start

A test connection will show that we need to configure TCP/IP connections:

# this will fail
psql -l
psql: could not connect to server: No such file or directory
    Is the server running locally and accepting
    connections on Unix domain socket "/var/run/postgresql/.s.PGSQL.5432"?

So we enable TCP/IP connections listening on port 5432:

# edit "postgresql.conf" with editor of choice (nano, vim, ...),
# add line "listen_addresses = '*'":
vim /var/lib/pgsql/data/postgresql.conf
...
listen_addresses = '*'
#listen_addresses = 'localhost'         # what IP address(es) to listen on;
...

Now restart the PostgreSQL daemon:

# restart to re-read configuration
service postgresql restart

Check if the server is now listening on TCP/IP:

# check network connections:
netstat -l | grep postgres
tcp        0      0 0.0.0.0:postgres        0.0.0.0:*               LISTEN     
tcp6       0      0 [::]:postgres           [::]:*                  LISTEN     
unix  2      [ ACC ]     STREAM     LISTENING     2236495  /var/run/postgresql/.s.PGSQL.543

So far so nice. Still PostGIS is not yet active, and we need a database user “gisuser” with password:

# switch from root user to postgres user:
su - postgres
# create new DB user with password (will prompt you for it, choose a strong one):
createuser --pwprompt --encrypted gisuser

Finally we create a first database “gis”:

# create new DB
createdb --encoding=UTF8 --owner=gisuser gis

We enable it for PostGIS 2.1:

# insert PostGIS SQL magic (it should finish with a "COMMIT"):
psql -d gis -f /usr/share/pgsql/contrib/postgis-64.sql

That’s it! Now exit from the “postgres” user account a the “root” account:

# exit from PG user account (back to "root" account level):
exit

In case you want to reach the PostgreSQL/PostGIS server from outside your machine (i.e. from the network), you need to enable PostgreSQL for that:

# enable the network in pg_hba.conf (replace host line; perhaps comment IP6 line):
vim /var/lib/pgsql/data/pg_hba.conf

...
host    all             all             all                     md5
...

# save and restart the daemon:
service postgresql restart

Time for another connection test:

# we try our new DB user account on the new database (hostname is the 
# name of the server in the network):
psql --user gisuser -h hostname -l
Password for user gisuser: xxxxxx

Wonderful, we are connected!

# exit from root account:
exit
[neteler@oboe ] $

Now have our PostGIS database ready!

What’s left? Get some spatial data in as a normal user:

# nice tool
shp2pgsql-gui
shp2pgsql-gui

Using the shp2pgsql-gui

Next pick a SHAPE file and upload it to PostGIS with “Import”.

Now connect to your PostGIS database with QGIS or GRASS GIS and enjoy!

See also: https://fedoraproject.org/wiki/PostgreSQL

The post Installing PostGIS on Fedora 20 appeared first on GFOSS Blog | GRASS GIS Courses.

OSGeo Code Sprint, Vienna

This is how OSGeo happens.  These are the folk who bring us a lot of that open-source geo-spatial goodness. You can follow the code sprint on Twitter using the hashtags #csprint and #viennacodesprint14


Two book recommendations

I recently finished reading two books which may be of interest to open-source GIS users – “PostGIS Cookbook” and “The PyQGIS Programmer’s Guide“, both of which I highly recommend:

PostGIS Cookbook

PostGIS CookbookI’ve been a fan of Stephen Mather’s blog for a while now, and have consistently found it to be a great source of trustworthy information and creative solutions to GIS problems. So when I first saw mention of his work on the PostGIS Cookbook I knew it would be a must-read for me. PostGIS is an essential part of my daily toolkit, and I’ll quickly devour any tutorial or guide which can lead me to better ways to put it to use. And that’s exactly what this book is! It’s full of tips and guides which has inspired me in a lot of techniques I’d never tried or even thought possible in PostGIS.

It’s important to point out that this book isn’t a training manual or beginner’s guide to PostGIS. It assumes readers are already familiar with using PostGIS and have a good understanding of GIS software in general. (If you’re looking for a book to start from scratch with PostGIS, PostGIS in Action is a better fit). I think that’s really what makes this book stand out though. There’s currently not a lot of books available covering PostGIS, and as far as I’m aware the PostGIS Cookbook is the only book available which is targeted to experienced PostGIS users.

Highlights for me are:

  • A great explanation and write up on optimised KNN filtering in PostGIS (something which often trips me up)
  • The detailed guide to topologically correct simplification of features
  • The exploration of PgRouting, which is a great introduction to PostGIS’ routing abilities
  • The “PostGIS and the web” chapter – I really wasn’t expecting this, but it’s quite eye opening (I’m going to have to do some digging into GeoDjango sometime)

The only criticism I have with this book is that it jumps around a lot between operating systems. While most of the code is provided for both Linux/OSX and Windows, there’s occasional examples which only have code for one specific operating system. It’s a little jarring and assumes the user is well versed in their particular operating system to workaround these omissions.

Overall, I strongly recommend the PostGIS Cookbook, and would consider it a must have for anyone serious about expanding their PostGIS abilities. (Also, looks like the publisher, Packt, have a two-for-one sale going at the moment, so it’s a good time to grab this title).

The PyQGIS Programmer’s Guide

The PyQGIS Programmer's GuideThe second book I’ve just finished reading is Gary Sherman’s “The PyQGIS Programmer’s Guide“. For those who are unaware, Gary was the original founder of QGIS back in 2002, so you can be confident that he knows exactly what he’s writing about. In The PyQGIS Programmer’s Guide  Gary has created an in-depth guide on how to get started with programming for QGIS using python. It takes readers all the way from simple scripts right through to developing QGIS plugins and standalone applications based on the QGIS API.

This book fills an important void in the literature available for QGIS. Previously, the PyQGIS Developer Cookbook was the only available guide for QGIS python scripting, and unfortunately it’s a little out-of-date now. PyQGIS scripting can be a steep learning curve and that’s why this book is so appreciated.

It would be valuable to have some python knowledge and experience prior to reading this book. While the “Python Basics” chapter quickly runs through an introduction to the language, the book makes no claims to be a comprehensive python tutorial. But if you’ve dabbled in the language before and have familiarity with the python way of doing things you’ll easily be able to follow along.

Highlights are:

  • The “Tips and Techniques” chapter, which is a great mini-reference for performing a range of common tasks in PyQGIS (including loading layers, changing symbol styles, editing feature attributes, etc).
  • A complete tutorial for creating a QGIS plugin
  • A guide to debugging PyQGIS code and plugins

I’d definitely recommend that anyone who wants to get started with PyQGIS start with Gary’s work – you’ll find it the perfect place to begin.

50th ICA-OSGeo Lab established at Fondazione Edmund Mach (FEM)

We are pleased to announce that the 50th ICA-OSGeo Lab has been established at the GIS and Remote Sensing Unit (Piattaforma GIS & Remote Sensing, PGIS), Research and Innovation Centre (CRI), Fondazione Edmund Mach (FEM), Italy. CRI is a multifaceted research organization established in 2008 under the umbrella of FEM, a private research foundation funded by the government of Autonomous Province of Trento. CRI focuses on studies and innovations in the fields of agriculture, nutrition, and environment, with the aim to generate new sharing knowledge and to contribute to economic growth, social development and the overall improvement of quality of life.

The mission of the PGIS unit is to develop and provide multi-scale approaches for the description of 2-, 3- and 4-dimensional biological systems and processes. Core activities of the unit include acquisition, processing and validation of geo-physical, ecological and spatial datasets collected within various research projects and monitoring activities, along with advanced scientific analysis and data management. These studies involve multi-decadal change analysis of various ecological and physical parameters from continental to landscape level using satellite imagery and other climatic layers. The lab focuses on the geostatistical analysis of such information layers, the creation and processing of indicators, and the production of ecological, landscape genetics, eco-epidemiological and physiological models. The team pursues actively the development of innovative methods and their implementation in a GIS framework including the time series analysis of proximal and remote sensing data.

The GIS and Remote Sensing Unit (PGIS) members strongly support the peer reviewed approach of Free and Open Source software development which is perfectly in line with academic research. PGIS contributes extensively to the open source software development in geospatial (main contributors to GRASS GIS), often collaborating with various other developers and researchers around the globe. In the new ICA-OSGeo lab at FEM international PhD students, university students and trainees are present.

PGIS is focused on knowledge dissemination of open source tools through a series of courses designed for specific user requirement (schools, universities, research institutes), blogs, workshops and conferences. Their recent publication in Trends in Ecology and Evolution underlines the need on using Free and Open Source Software (FOSS) for completely open science. Dr. Markus Neteler, who is leading the group since its formation, has two decades of experience in developing and promoting open source GIS software. Being founding member of the Open Source Geospatial Foundation (OSGeo.org, USA), he served on its board of directors from 2006-2011. Luca Delucchi, focal point and responsible person for the new ICA-OSGeo Lab is member of the board of directors of the Associazione Italiana per l’Informazione Geografica Libera (GFOSS.it, the Italian Local Chapter of OSGeo). He contributes to several Free and Open Source software and open data projects as developer and trainer.

Details about the GIS and Remote Sensing Unit at http://gis.cri.fmach.it/

Open Source Geospatial Foundation (OSGeo) is a not-for-profit organisation founded in 2006 whose mission is to support and promote the collaborative development of open source geospatial technologies and data.

International Cartographic Association (ICA) is the world authoritative body for cartography and GIScience. See also the new ICA-OSGeo Labs website.

Public transport isochrones with pgRouting

This post covers a simple approach to calculating isochrones in a public transport network using pgRouting and QGIS.

For this example, I’m using the public transport network of Vienna which is loaded into a pgRouting-enable database as network.publictransport. To create the routable network run:

select pgr_createTopology('network.publictransport', 0.0005, 'geom', 'id');

Note that the tolerance parameter 0.0005 (units are degrees) controls how far link start and end points can be apart and still be considered as the same topological network node.

To create a view with the network nodes run:

create or replace view network.publictransport_nodes as
select id, st_centroid(st_collect(pt)) as geom
from (
	(select source as id, st_startpoint(geom) as pt
	from network.publictransport
	) 
union
	(select target as id, st_endpoint(geom) as pt
	from network.publictransport
	) 
) as foo
group by id;

To calculate isochrones, we need a cost attribute for our network links. To calculate travel times for each link, I used speed averages: 15 km/h for buses and trams and 32km/h for metro lines (similar to data published by the city of Vienna).

alter table network.publictransport add column length_m integer;
update network.publictransport set length_m = st_length(st_transform(geom,31287));

alter table network.publictransport add column traveltime_min double precision;
update network.publictransport set traveltime_min = length_m  / 15000.0 * 60; -- average is 15 km/h
update network.publictransport set traveltime_min = length_m  / 32000.0 * 60 where "LTYP" = '4'; -- average metro is 32 km/h

That’s all the preparations we need. Next, we can already calculate our isochrone data using pgr_drivingdistance, e.g. for network node #1:

create or replace view network.temp as
 SELECT seq, id1 AS node, id2 AS edge, cost, geom
  FROM pgr_drivingdistance(
    'SELECT id, source, target, traveltime_min as cost FROM network.publictransport',
    1, 100000, false, false
  ) as di
  JOIN network.publictransport_nodes pt
  ON di.id1 = pt.id;

The resulting view contains all network nodes which are reachable within 100,000 cost units (which are minutes in our case).

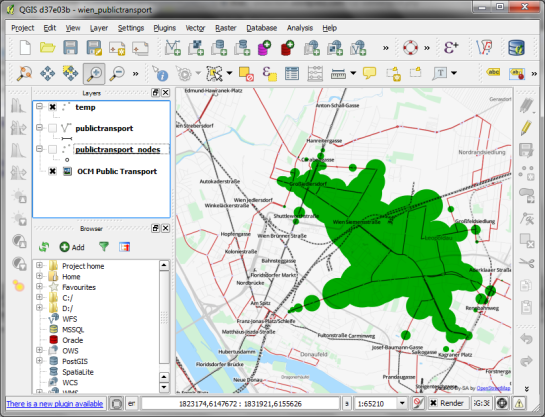
Let’s load the view into QGIS to visualize the isochrones:

isochrone_publictransport_1

The trick is to use data-defined size to calculate the different walking circles around the public transport stops. For example, we can set up 10 minute isochrones which take into account how much time was used to travel by pubic transport and show how far we can get by walking in the time that is left:

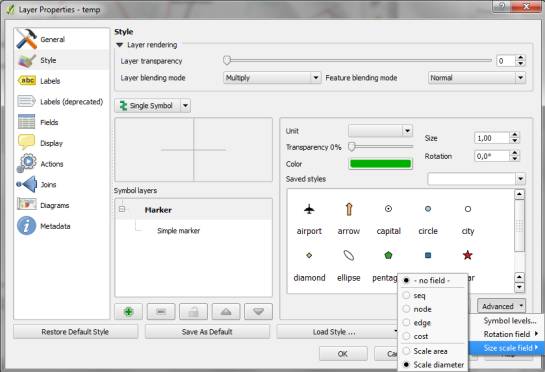
1. We want to scale the circle radius to reflect the remaining time left to walk. Therefore, enable Scale diameter in Advanced | Size scale field:

scale_diameter

2. In the Simple marker properties change size units to Map units.
3. Go to data defined properties to set up the dynamic circle size.

datadefined_size

The expression makes sure that only nodes reachable within 10 minutes are displayed. Then it calculates the remaining time (10-"cost") and assumes that we can walk 100 meters per minute which is left. It additionally multiplies by 2 since we are scaling the diameter instead of the radius.

To calculate isochrones for different start nodes, we simply update the definition of the view network.temp.

While this approach certainly has it’s limitations, it’s a good place to start learning how to create isochrones. A better solution should take into account that it takes time to change between different lines. While preparing the network, more care should to be taken to ensure that possible exchange nodes are modeled correctly. Some network links might only be usable in one direction. Not to mention that there are time tables which could be accounted for ;)


pgRouting 2.0 for Windows quick guide

This post is a quick instruction for installing Postgres 9.2, PostGIS 2.0 and pgRouting 2.0.

  1. For Postgres, download the installer from enterprisedb.com.
  2. Run the installer. You’ll have to pick a superuser password – remember it, you’ll need it again soon.
  3. At the end of the installation process, allow the installer to start Stack Builder.
  4. In Stack Builder, select the Postgres 9.2 installation and install PostGIS from the list of available extensions.
  5. The PostGIS installation procedure will prompt you for the superuser password you picked before.
  6. I suggest letting the installer create a sample database We’ll need it later anyway.

Now for the pgRouting part:

  1. Download the pgRouting zip file for your system (32 or 64 bit) from Winnie.
  2. Unzip the file. It contains bin, lib and share folders as well as two text files.
  3. Copy these folders and files over to your Postgres installation. In my case C:\Program Files\PostgreSQL\9.2

Installation – done.

Next, fire up pgAdmin. If you allowed the PostGIS installer to create a sample database, you will find it named postgis20 or similar. Otherwise just create a new database using the PostGIS template database. You can enable pgRouting in a database using the following steps:

  1. In postgis20, execute the following query to create the pgrouting extension. This will add the pgRouting-specific functions:
    CREATE EXTENSION pgrouting;
  2. Test if everything worked fine:
    SELECT pgr_version();

    It should return "(2.0.0-dev,v2.0.0-beta,18,a3be38b,develop,1.46.1)" or similar – depending on the version you downloaded.

pgadmin_pgrouting

How about some test data? I’ll be using the public transport network of the city of Vienna provided in GeoJSON format from http://data.wien.gv.at/daten/wfs?service=WFS&request=GetFeature&version=1.1.0&typeName=ogdwien:OEFFLINIENOGD&srsName=EPSG:4326&outputFormat=json:

  1. Just copy paste the url in Add Vector Layer | Protocol to load the dataset.
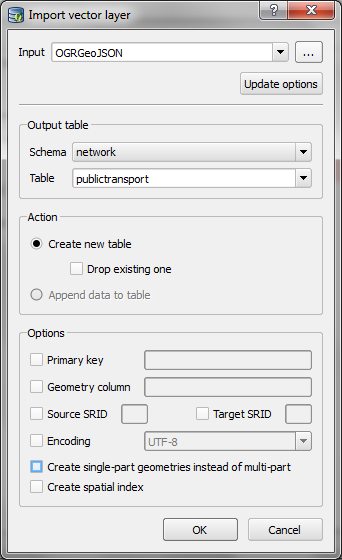
  2. Use DB Manager to load the layer into your database. (As you can see in the screenshot, I created a schema called network but that’s optional.)
  3. import_publictransport

  4. To make the line vector table routable, we use pgr_createTopology. This function assumes the columsn called “source” and “target” exist so we have to create those as well:
    alter table network.publictransport add column source integer;
    alter table network.publictransport add column target integer;
    select pgr_createTopology('network.publictransport', 0.0001, 'geom', 'id');
    

    I’m quite generously using a tolerance of 0.0001 degrees to build the topology. Depending on your dataset, you might want to be more strict here.

  5. Let’s test it! Route from source #1 to target #3000 using pgr_dijkstra:
    SELECT seq, id1 AS node, id2 AS edge, cost, geom
      FROM pgr_dijkstra(
        'SELECT id, source, target, st_length(geom) as cost FROM network.publictransport',
        1, 3000, false, false
      ) as di
      JOIN network.publictransport pt
      ON di.id2 = pt.id ;

    Note how the query joins the routing results and the network table together. (I’m aware that using the link length as a cost attribute will not lead to realistic results in a public transport network but bear with me for this example.)

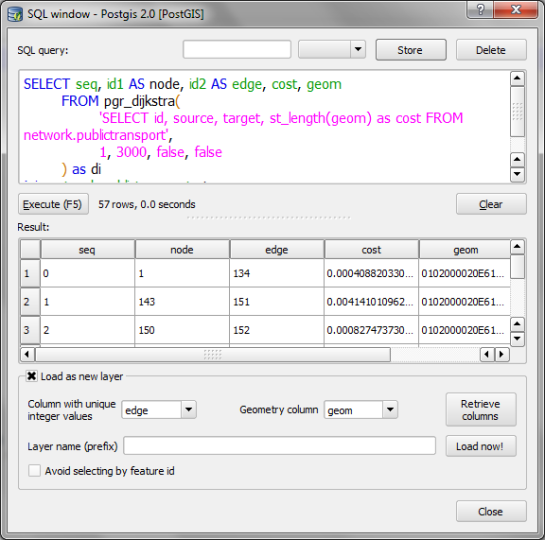
  6. We can immediately see the routing results using the Load as new layer option:

select_dijkstra
route

Nice work! pgRouting 2.0 has come a long way. In a post from April this year, Boston GIS even announced to add pgRouting into the Stack Builder. That’s going to make the installation even more smooth.


WFS to PostGIS in 1 Step

This is an update to my previous post “WFS to PostGIS in 3 Steps”. Thanks to Even Rouault’s comments and improvements to GDAL, it is now possible to load Latin1-encoded WFS (like the one by data.wien.gv.at) into PostGIS in just one simple step.

To use the following instructions, you’ll have to get the latest GDAL (release-1600-gdal-mapserver.zip)

You only need to run SDKShell.bat to set up the environment and ogr2ogr is ready for action:

C:\Users\Anita>cd C:\release-1600-gdal-mapserver
C:\release-1600-gdal-mapserver>SDKShell.bat
C:\release-1600-gdal-mapserver>ogr2ogr -overwrite -f PostgreSQL PG:"user=myuser password=mypassword dbname=wien_ogd" "WFS:http://data.wien.gv.at/daten/geoserver/ows?service=WFS&request=GetFeature&version=1.1.0&typeName=ogdwien:BEZIRKSGRENZEOGD&srsName=EPSG:4326"

Thanks everyone for your comments and help!


  • <<
  • Page 2 of 4 ( 67 posts )
  • >>
  • postgis

Back to Top

Sustaining Members