Related Plugins and Tags

QGIS Planet

Installing PostGIS 2.0 on ubuntu

PostGIS 2.0 is out and the awesomness continues! You can install PostGIS 2.0 on Ubuntu using packages which is exactly what I am going to show you here. Read on for details on how to get up and running and do your first simple raster analysis!

Note: You should make good backups first!

Before we begin, you should uninstall your existing postgis packages:

sudo dpkg --purge postgis postgresql-9.1-postgis

Then add a new repository and install PostGIS from there (based on this post):

sudo apt-add-repository ppa:sharpie/for-science  # To get GEOS 3.3.2
sudo apt-add-repository ppa:sharpie/postgis-nightly
sudo apt-get update
sudo apt-get install postgresql-9.1-postgis

Next we should create a new template database (optional but recommended).

createdb -E UTF8 template_postgis2
createlang -d template_postgis2 plpgsql
psql -d postgres -c "UPDATE pg_database SET datistemplate='true' WHERE datname='template_postgis2'"
psql -d template_postgis2 -f /usr/share/postgresql/9.1/contrib/postgis-2.0/postgis.sql
psql -d template_postgis2 -f /usr/share/postgresql/9.1/contrib/postgis-2.0/spatial_ref_sys.sql
psql -d template_postgis2 -f /usr/share/postgresql/9.1/contrib/postgis-2.0/rtpostgis.sql
psql -d template_postgis2 -c "GRANT ALL ON geometry_columns TO PUBLIC;"
psql -d template_postgis2 -c "GRANT ALL ON geography_columns TO PUBLIC;"
psql -d template_postgis2 -c "GRANT ALL ON spatial_ref_sys TO PUBLIC;"
createdb training -T template_postgis2

Ok now we can load a raster (see sample data download below):

raster2pgsql -s 4326 srtm_4326.tif | psql training
shp2pgsql -s 4326 -d -g geom -I places.shp places| psql training

Good - now our spatial database is ready to use - and has raster support! Here is a nice example of what you can do. The query looks up the altitude from the SRTM raster for each place listed using the ST_Value function:

select ST_Value(rast, geom, true) from places, srtm_4326;

It should produce something like this:

Doing a 'point on raster' query on our raster in QGIS

Further reading: A really good place to start is the Boston GIS cheatsheets - I am really looking forward to exploring all the new features that are available in PostGIS 2.0, thanks to all those involved in building it!

Sample data for the example listed

Another bash one-liner - load all natural earth layers into postgis in one go

Having a good world dataset is kind of essential for most GIS users to have as a standard reference dataset, give context to maps and so on. Anita Graser's recent blog post about the Natural Earth Data project added another nice dataset to my world dataset collection. The Natural Earth Data set (I got the 'full' one) is provided as shapefiles. Of course as a PostGIS fan I'd rather have these in my geospatial database, so I wrote a one liner in bash to load all the datasets.

First download the full dataset from here, and then extract the contents into a working directory somewhere. Then simply run this line, adjusting your destination database and schema as needed:

for FILE in `find . -name *.shp`; do \
  BASE=`basename $FILE .shp`; \
  /usr/lib/postgresql/9.1/bin/shp2pgsql -s 4326 -I $FILE world.$BASE \
  | psql gis; done

Ok that looks like four lines above, but only because I added some line breaks so things would be readable on this blog.

Note that you should replace 'world' with the name of the schema you are importing the data into, and 'gis' with the name of the database you are importing your data into. Thanks for the awesome dataset Natural Earth Team!

Osm2po Part 2 – PgRouting on OSM the Easy Way

This is the follow up post to “An osm2po Quickstart” which covers loading the OSM network into PostGIS and using the result with pgRouting. After parsing the OSM file, e.g.

C:\Users\Anita\temp\osm2po-4.2.30>java -jar osm2po-core-4.2.30-signed.jar prefix=at "C:\Users\Anita\Geodaten\OpenStreetMap Data\austria.osm.pbf"

you should find a folder with the name of the prefix you chose inside the osm2po folder. It contains a log file which in turn provides a command line template for importing the OSM network into PostGIS, e.g.

INFO commandline template: psql -U [username] -d [dbname] -q -f "C:\Users\Anita\temp\osm2po-4.2.30\at\at_2po_4pgr.sql"

Using this template, we can easily import the .sql file into an exiting database. My pgRouting-enabled database is called wien_ogd.

C:\Users\Anita\temp\osm2po-4.2.30\at>psql -U [username] -d wien_ogd -q -f C:\Users\Anita\temp\osm2po-4.2.30\at\at_2po_4pgr.sql

Now, the data is ready for usage in QGIS:

The osm2po table in QGIS

Using “pgRouting Layer” plugin, it’s now straightforward to calculate shortest paths. I had to apply some changes to the plugin code, so please get the latest version from Github.

A shortest path in osm2po network

Using osm2po turned out to be far less painful than I expected and I hope you’ll find this post useful too.


A Look at PgRouting find_ node_by_nearest_link_within_distance

The function with the glorious name “find_node_by_nearest_link_within_distance” is part of pgRouting and can be found in matching.sql.

“This function finds nearest node as a source or target of the nearest link”
That means that we can use this function e.g. to find the best road network node for a given address.

The function returns an object of type link_point:

CREATE TYPE link_point AS (id integer, name varchar);

To access only the id value of the nearest node, you can use:

SELECT id(foo.x) 
FROM (
   SELECT find_node_by_nearest_link_within_distance(
	'POINT(14.111 47.911)',
	0.5,
	'nw_table')::link_point as x
) AS foo


A Closer Look at Alpha Shapes in pgRouting

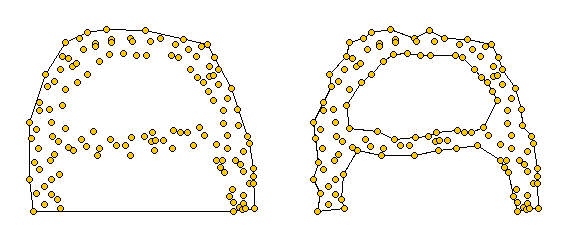
Alpha shapes are generalizations of the convex hull [1]. Convex hulls are well known and widely implemented in GIS systems. Alpha shapes are different in that they capture the shape of a point set. You can watch a great demo of how alpha shapes work on François Bélair’s website “Everything You Always Wanted to Know About Alpha Shapes But Were Afraid to Ask” I borrowed the following pictures from that site:

Alpha shapes for different values of alpha. The left one equals the convex hull of the point set. The right picture represents the alpha shape for a smaller value of alpha

pgRouting comes with an implementation of alpha shapes. There is an alpha shape function: alphashape(sql text) and a convenience wrapper: points_as_polygon(query character varying). The weird thing is that you don’t get to set an alpha value. The only thing supplied to the function is a set of points. Let’s see what kind of results it produces!

Starting point for this experiment is a 10 km catchment zone around node #2699 in my osm road network. Travel costs to nodes are calculated using driving_distance() function. (You can find more information on using this function in Catchment Areas with pgRouting driving_distance().)

CREATE TABLE home_catchment10km AS
SELECT *
   FROM osm_nodes
   JOIN
   (SELECT * FROM driving_distance('
      SELECT gid AS id,
          source,
          target,
          meters AS cost
      FROM osm_roads',
      2699,
      10000,
      false,
      false)) AS route
   ON
   osm_nodes.id = route.vertex_id

After costs are calculated, we can create some alpha shapes. The following queries create the table and insert an alpha shape for all points with a cost of less than 1500:

CREATE TABLE home_isodist (id serial, max_cost double precision);
SELECT AddGeometryColumn('home_isodist','the_geom',4326,'POLYGON',2);

INSERT INTO home_isodist (max_cost, the_geom) (
SELECT 1500, ST_SetSRID(the_geom,4326)
FROM 
  points_as_polygon(
    'SELECT id, ST_X(the_geom) AS x, ST_Y(the_geom) AS y FROM home_catchment10km where cost < 1500'));

In previous posts, I’ve created catchment areas by first interpolating a cost raster and creating contours from there. Now, let’s see how the two different approaches compare!

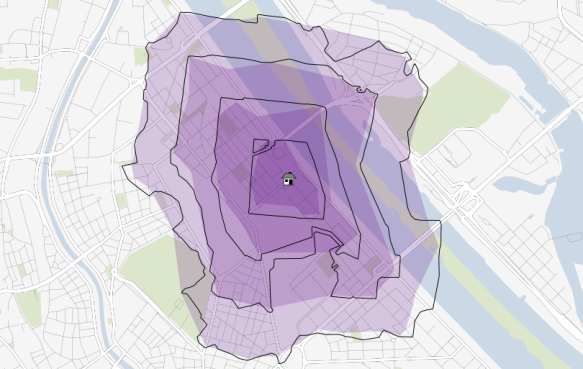
The following picture shows resulting catchment areas for 500, 1000, 1500, and 2000 meters around a central node. Colored areas show the form of pgRouting alpha shape results. Black contours show the results of the interpolation method:

Comparison of pgRouting alpha shapes and interpolation method

At first glance, results look similar enough. Alpha shape results look like a generalized version of interpolation results. I guess that it would be possible to get even closer if the alpha value could be set to a smaller value. The function should then produce a finer, more detailed polygon.

For a general overview about which areas of a network are reachable within certain costs, pgRouting alpha shapes function seems a viable alternative to the interpolation method presented in previous posts. However, the alpha value used by pgRouting seems too big to produce detailed catchment areas.

[1] http://biogeometry.duke.edu/software/alphashapes/


Guide to Advanced Labeling for OSM Roads

Advanced labeling in QGIS new labeling engine is mostly about data-defined settings. Almost any property of the label can be controlled.

For this example, we will try to mimic the look of the classic Google map with it’s line and label styles. The data for this post is from the OpenStreetMap project provided as Shapefiles by Cloudmade.

After importing the roads into PostGIS using PostGIS Manager Plugin, we can create a view that will contain the necessary label style information. The trick here is to use CASE statements to distinguish between different label “classes”. Motorway labels will be bigger than the rest and the buffer color will be the same color as used for the corresponding lines.

drop view if exists v_osm_roads_styled ;

CREATE VIEW v_osm_roads_styled AS
SELECT *,
CASE WHEN type = 'motorway' THEN 9
     ELSE 8 END
     as font_size,
'black'::TEXT as font_color,
false as font_bold,
false as font_italic,
false as font_underline,
false as font_strikeout,
false as font_family,
1 as buffer_size,
CASE WHEN type = 'motorway' THEN '#fb9139'::TEXT
     WHEN type IN ( 'primary','primary_link','secondary','secondary_link') THEN '#fffb8b'::TEXT
     ELSE 'white'::TEXT END
     as buffer_color
from osm_roads;

In QGIS, we can then load the view and start styling. First, let’s get the line style ready. Using rule-based renderer, it’s easy to create complex styles. In this case, I’ve left it rather simple and don’t distinguish between different zoom levels. That’s a topic for another post :)

Google-style rules for OSM road data

Now for the labels! In “Data defined settings”, we can assign the special attributes created in the database view to the settings.

Completed "Data defined settings"

To achieve an even better look, go to “Advanced” tab and enable “curved” and “on line” placement. “Merge connected lines to avoid duplicate labels” option is very helpful too.

Finally – after adding some water objects (Cloudmade natural.shp) – this is what our result looks like:

Google-style OSM map

This solution can be improved considerably by adding multiple zoom levels with corresponding styles. One obvious difference between the original Google map and this look-alike is the lack of road numbers. Tim’s post on “shield labels” can be a starting point for adding road numbers the way Google does.


Visualizing Global Connections

Today, I’ve been experimenting with data from OpenFlights.org. They offer airport, airline and route data for download. The first idea that came to mind was to connect airports on a shared route by lines. This kind of visualization just looks much nicer if the connections are curved instead of simple straight lines.

Luckily, that’s pretty easy to do using PostGIS. After loading airport positions and route data, we can create the connection lines like this (based on [postgis-users] Great circle as a linestring):

UPDATE experimental.airroutes
SET the_geom =
(SELECT ST_Transform(ST_Segmentize(ST_MakeLine(
       ST_Transform(a.the_geom, 953027),
       ST_Transform(b.the_geom, 953027)
     ), 100000 ), 4326 )
 FROM experimental.airports a, experimental.airports b
 WHERE a.id = airroutes.source_id
   AND b.id = airroutes.dest_id
);

The CRS used in the query is not available in PostGIS by default. You can add it like this (source: spatialreference.org):

INSERT into spatial_ref_sys (srid, auth_name, auth_srid, proj4text, srtext) values ( 953027, 'esri', 53027, '+proj=eqdc +lat_0=0 +lon_0=0 +lat_1=60 +lat_2=60 +x_0=0 +y_0=0 +a=6371000 +b=6371000 +units=m +no_defs ', 'PROJCS["Sphere_Equidistant_Conic",GEOGCS["GCS_Sphere",DATUM["Not_specified_based_on_Authalic_Sphere",SPHEROID["Sphere",6371000,0]],PRIMEM["Greenwich",0],UNIT["Degree",0.017453292519943295]],PROJECTION["Equidistant_Conic"],PARAMETER["False_Easting",0],PARAMETER["False_Northing",0],PARAMETER["Central_Meridian",0],PARAMETER["Standard_Parallel_1",60],PARAMETER["Standard_Parallel_2",60],PARAMETER["Latitude_Of_Origin",0],UNIT["Meter",1],AUTHORITY["EPSG","53027"]]');

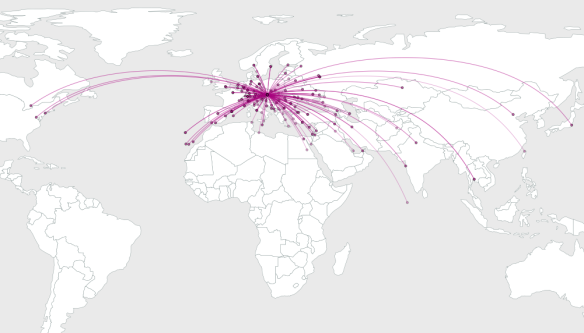
This is an example visualization (done in QGIS) showing only flight routes starting from Vienna International Airport:

Flight routes from Vienna International

Connections crossing the date line are currently more problematic. Lines would have to be split, otherwise this is what you’ll get:

Date line trouble


How to create a Table with Geometry Column in PostGIS

Do you need to create a table with a geometry column in PostGIS from scratch?
Can’t remember the syntax of AddGeometryColumn(varchar catalog_name, varchar schema_name, varchar table_name, varchar column_name, integer srid, varchar type, integer dimension)? I can’t. ;)

Let’s make our lives easier: QGIS PostGIS Manager offers a convenient GUI for creating tables with geometry columns:

PostGIS Manager Create Table dialog

The dialog works a lot like what you’re probably used to in pgAdmin – with the added nicety of supporting Geometry columns.

In my opinion, this is the fastest way so far to create a spatially enabled table. It provides a much better user experience than telling users (especially new ones) to use AddGeometryColumn(…


Infrastructure Coverage based on Open Data

This is something I have been wanting to do for a long time: map which areas of Vienna have fast access to a certain kind of infrastructure. Now, I finally found time and data to perform this analysis. Data used is OSM road data (Cloudmade shapefile) for Austria and metro station coordinates for Vienna by Max Kossatz and Robert Harm.

Before importing the OSM roads into PostGIS, I cut out my area of interest and created a clean topology using GRASS v.clean.break. Once loaded into the database, assign_vertex_id() function does the rest and the network is ready for routing and distance calculations.
For the metro stations, I calculated the nearest network node using George MacKerron’s Nearest Neighbor function.

Catchments were calculated using driving_distance() function. It returns distance to a given metro station for all network nodes (up to a maximum distance). The result can be interpolated to show e.g. which areas are at most 1 km away from any metro station.

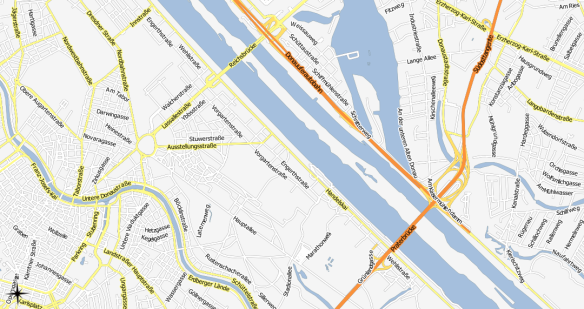
1 km catchments around metro stations in Vienna

Close-up look at the 1 km catchment zone border

Once set up, performing this analysis is reasonably fast. Instead of metro stations, any other infrastructure coverage can be analyzed easily. I could imagine this being really useful when looking for a new flat: “Find me an area close to work, a metro station and a highschool.”

The next great thing would be to have all data for calculation of transit travel times too. Yes, I’m looking at you Wiener Linien!


Listing the number of records in all postgresql tables

I love bash and the gnu tools provided on a Linux system. I am always writing little oneliners that help me do my work. Today I was generating some fixtures for django (yes I am finally properly learning to use unit testing in django). I wanted to know how many records where in each table in my database. Here is the little one liner I came up with:

for TABLE in $(psql foo-test -c "\dt" | awk '{print $3}'); do \
psql foo-test -c "select '$TABLE', count(*) from $TABLE;" | grep -A1 "\-\-\-\-" | tail -1; done

It produces output that looks something like this:

auth_group |     0
auth_group_permissions |     0
auth_message |     0
auth_permission |   273
auth_user |   366
auth_user_groups |     0
auth_user_user_permissions |     0
etc.

Catchment Areas with pgRouting driving_distance()

In a previous post, I’ve described how to create catchment areas with pgRouting shortest_path() function. The solution described there calculates costs from the starting node (aka vertex) to all other nodes in the network. Depending on the network size, this can take a long time. Especially, if you are only interested in relatively small catchment areas (e.g. 50 km around a node in a network covering 10,000 km) there is a lot of unnecessary calculation going on. This is where you might want to use driving_distance() instead.

Driving_distance() offers a parameter for maximum distance/cost and will stop calculations when the costs exceed this limit. But let’s start at the beginning: installing the necessary functions.

Installation

If you have followed my guide to installing pgRouting, you already have some routing functions installed – but not driving_distance(). Weirdly, the necessary SQL scripts are not shipped with the .zip file available on pgRouting’s download page. You need:

routing_dd.sql
routing_dd_wrappers.sql

Both are available through the project repository at Github. Get them and execute them in your pgRouting-enabled database. Now, you should be ready.

Calculating driving distances

To calculate driving distances, we need a query very similar to shortest_path():

CREATE OR REPLACE FUNCTION driving_distance(
sql text,
source_id integer,
distance float8,
directed boolean,
has_reverse_cost boolean)
RETURNS SETOF path_result

The only new value is “distance”. That’s the maximum distance/cost you want to be contained in the result set. “distance” has to be specified in the same units as the cost attribute (which is specified in the “sql” text parameter).

Note: In my opinion, the name “(driving) distance” is misleading. While you can use distance as a cost attribute, you’re not limited to distances. You can use any cost attribute you like, e.g. travel time, fuel consumption, co2 emissions, …

The actual query for a catchment area of 100 km around node # 2000 looks like this:

SELECT * FROM driving_distance('
      SELECT gid AS id,
          start_id::int4 AS source,
          end_id::int4 AS target,
          shape_leng::float8 AS cost
      FROM network',
      2000,
      100000,
      false,
      false)

Interpreting the result

These are the first lines of the result set:

vertex_id;edge_id;cost
294;7262;97400.433506144
297;7236;98012.620979231
335;1095;96849.456306244
347;7263;93617.693852324
364;7098;93573.849081386
366;2551;92702.443434779
378;7263;91994.328368081

The cost attribute contains the total cost of travel from the starting node to the vertex_id node.
We will only be using vertex_id and cost. The use of edge_id is a mystery to me.

Visualizing the result

The easiest way to visualize driving_distance() results is using RT Sql Layer plugin. We need to join the results of driving_distance() with the table containing node geometries:

SELECT *
   FROM node
   JOIN
   (SELECT * FROM driving_distance('
      SELECT gid AS id,
          start_id::int4 AS source,
          end_id::int4 AS target,
          shape_leng::float8 AS cost
      FROM network',
      2000,
      100000,
      false,
      false)) AS route
   ON
   node.id = route.vertex_id

If you color the nodes based on the cost attribute, it will look something like this:

result of pgRouting driving_distance() visualized in QGIS


PostGIS ST_Collect vs. ST_Union

This post covers the topic of creating MULTI* geometries or GEOMETRYCOLLECTIONs in PostGIS using ST_Collect or ST_Union.

Often it doesn’t matter if you use ST_Collect or ST_Union. Both will return MULTI* geometries or – if different geometry types or multi geometries are mixed – GEOMETRYCOLLECTIONS.

Why you might want to use ST_Collect instead of ST_Union

ST_Collect is much faster than ST_Union [1]. That’s already a good argument. It’s faster because it does not dissolve boundaries or check for overlapping regions. It simply combines geometries into MULTI*s or GEOMETRYCOLLECTIONs.

This leads to reason two for why you might prefer ST_Collect: Dissolving boundaries and overlapping regions – like ST_Union does – can lead to undesired effects. For example, combining three LINESTRING geometries that partially overlap, results in a MULTILINESTRING consisting of more than three lines. The input lines are split where they overlap each other or themselves.

Analysis and visualization based on the resulting geometries might lead to incorrect conclusions if the user is not aware of the processes performed by the union command.

[1] http://postgis.refractions.net/documentation/manual-svn/ST_Collect.html


Ubuntu PostGIS package for PostgreSQL 9.0

A while ago I’ve compiled PostGIS 1.5.2 for PostgreSQL 9.0.

To install it on Ubuntu the following steps are required:

apt-get install python-software-properties

add-apt-repository ppa:ubuntugis/ubuntugis-unstable
add-apt-repository ppa:pitti/postgresql
add-apt-repository ppa:pi-deb/gis

apt-get update

apt-get install postgresql-9.0-postgis

A basic template database can be created with the following commands:

sudo su - postgres

createdb template_postgis
psql -q -d template_postgis -f /usr/share/postgresql/9.0/contrib/postgis-1.5/postgis.sql
psql -q -d template_postgis -f /usr/share/postgresql/9.0/contrib/postgis-1.5/spatial_ref_sys.sql
psql -q -d template_postgis -f /usr/share/postgresql/9.0/contrib/postgis_comments.sql
cat <<EOS | psql -d template_postgis
UPDATE pg_database SET datistemplate = TRUE WHERE datname = 'template_postgis';
REVOKE ALL ON SCHEMA public FROM public;
GRANT USAGE ON SCHEMA public TO public;
GRANT ALL ON SCHEMA public TO postgres;
GRANT SELECT, UPDATE, INSERT, DELETE
  ON TABLE public.geometry_columns TO PUBLIC;
GRANT SELECT, UPDATE, INSERT, DELETE
  ON TABLE public.spatial_ref_sys TO PUBLIC;
EOS

To test database creation you can do the following:

createdb --template template_postgis test_gis
psql -d test_gis -c "select postgis_lib_version();"

Ubuntu supports parallel installations of different PostgreSQL versions. So if you have already PostgreSQL 8.x installed, PostgreSQL 9.0 will probably be configured to listen on port 5433. So you have to add the option -p 5433 to each command and to specify the full path for the executables. For example:

/usr/lib/postgresql/9.0/bin/psql -p 5433 -d test_gis -c "select postgis_lib_version();"

Fun with GeoNames

The GeoNames dataset provides a list of global placenames, their location and some additional information such as population and so on. It is published under the Creative Commons Attribution 3.0 License, which allows you to use the data for your own purposes. You can download the data by country, or the entire global dataset. In this article, I will walk you though how I downloaded the entire dataset, loaded it into PostgreSQL and added a geometry column so that I could view it in QGIS. Note that you can substitute these instructions for a specific country's data easily.

First up, lets get the data from the geonames download page!

wget -c http://download.geonames.org/export/dump/allCountries.zip

Note the download is around 196mb so if you live in an internet backwater like I do, expect it to take a little while. If the download gets disconnected, just rerun the same command again - the '-c' option tells wget to continue where it left off last time.

Once the data is downloaded, unzip it:

unzip allCountries.zip

You should now have a text file called allCountries.txt weighing in at just under 900mb. Next we can load it into PostgreSQL using a variation of this article. I highly recommend the use of schemas to partition your database into logical units. In the code listings that follow, it is assumed you have a schema called 'world'. If you need to create it, simply do:

create schema world;

From the psql prompt. Since I am only interested in the geoname table at the moment I simply do this in my database.

create table world.geoname (
         geonameid       int,
         name            varchar(200),
         asciiname        varchar(200),
         alternatenames  varchar(8000),
         latitude        float,
         longitude       float,
         fclass  char(1),
         fcode   varchar(10),
         country varchar(2),
         cc2 varchar(60),
         admin1  varchar(20),
         admin2  varchar(80),
         admin3  varchar(20),
         admin4  varchar(20),
         population      bigint,
         elevation       int,
         gtopo30         int,
         timezone varchar(40),
         moddate         date
 );

You will notice that I extended the alternatenames field size from the original tutorial's 4000 characters to 8000 characters in order to accommodate some longer entries that were causing my imports to fail with 4000 chars.

Next we can import the data (also from the psql prompt):

copy world.geoname (geonameid,name,asciiname,alternatenames,
latitude,longitude,fclass,fcode,country,cc2,
admin1,admin2,admin3,admin4,population,elevation,gtopo30,
timezone,moddate) from '/home/web/allCountries.txt' null as '';

Once again this is similar to the import line used by the original article I used, except I have used a full path to my allCountries.txt file. The import may take a little while depending on the speed of your computer.

When it is completed, you should have a bunch of data (~7.5 million records) in your table:

gis=# select count(*) from world.geoname ;
  count
---------
 7664712
(1 row)

It is going to be useful to have a unique id for every record - QGIS for one would like to have it, so lets add one (in addition to the geonameid field):

alter table world.geoname add column id serial not null;
CREATE UNIQUE INDEX idx_geoname_id ON world.geoname (id);

Because I know I will be using some other fields as basis for subset queries etc., I added some indexes on those too:

CREATE INDEX idx_geoname_population ON world.geoname (population);
CREATE INDEX idx_geoname_fcode ON world.geoname(fcode);

Ok thats all great, but there is no geometry column yet so we can't view this in QGIS easily. So lets GIS enable the table! First we add a new geometry column:

alter table world.geoname add column the_geom geometry;

Now we populate the geometry column:

update world.geoname set the_geom = st_makepoint(longitude,latitude);

Next we add a constraint to ensure that the column always contains a point record or is null

alter table world.geoname add constraint enforce_geotype_the_geom
CHECK (geometrytype(the_geom) = 'POINT'::text OR the_geom IS NULL);

Finally lets index the table on the geometry field:

CREATE INDEX idx_geoname_the_geom ON world.geoname USING gist(the_geom);

Ok next we can connect to the database using QGIS and view our data! Note that you may want to filter the data or set up scale dependent visibility so that QGIS doesn't try to render all 7.5 million points when you zoom out.

I added a query filter like this to the layer properties -> general tab -> subset:

"population" >= 10000 AND fcode != 'PPLA' and fcode != 'PCLI' AND fcode != 'ADM1'

You should experiment and read the geonames documentation in order to define a filter that is useful for your purposes.

Geonames layer loaded in QGIS

The Geonames dataset is a wonderful asset to the GIS community, particularly to those of us who value Free Software and Free Data.

Update 6 Aprl 2011:

I encountered one issue with the above procedure: the SRID for the imported points is -1 when loaded instead of 4326. This cause problems e.g. in mapserver you get an error like this:

ERROR:  Operation on two geometries with different SRIDs

To fix the issue I ran the following update query to assign all points a proper SRID:

update world.geoname set the_geom = ST_SETSRID(the_geom,4326);

Note that it takes quite a while to run.  When it completes, you can verify that the points are all in the correct CRS by running this little query:

gis=# select distinct ST_SRID(the_geom) from world.geoname;

Which should produce something like this:

 st_srid
---------
 4326
(1 row)

For good measure, I also added the geoname table to my geometry columns table:

insert into geometry_columns (f_table_catalog,f_table_schema,f_table_name,f_geometry_column,
coord_dimension,srid,type) values ('','world','geoname','the_geom',2,4326,'POINT');

Lastly I also gave select permissions to my readonly user (which I use when publishing in a web environment):

grant usage on schema world to readonly;
grant select on world to readonly;

I have also fixed the formatting of some of the SQL snippets above for those who struggled to read it within the width of this page.

Selecting a Random Sample From PostgreSQL

Do you need a random sample of features in a Postgres table? Here is an example of how to select 1,000 random features from a table:

SELECT * FROM myTable
WHERE attribute = 'myValue'
ORDER BY random()
LIMIT 1000;

Drive Time Isochrones – An Example Using Finnish Airports

Site analyses can benefit greatly from using “drive-time” isochrones to define the study area. Drive time isochrones are often significantly different from simple buffer areas which disregard natural barriers such as rivers or slow roads.

Of course, creating drive time isochrones requires more input data and more compute-intensive algorithms than a simple buffer analysis. It is necessary to create a routable network graph with adequate weights to be used by the routing algorithm.

One of the most popular routing  applications in the open source world is pgRouting for PostGIS enabled databases. I’ve already shown how to create drive time isochrones for one network node based on pgRouting and QGIS.  Today, I’ll show how to create drive time isochrones for a set of points – in this case all airports in Finland.

The first step is to find the closest network node to every airport:

ALTER TABLE airport
   ADD COLUMN nearest_node integer;

CREATE TABLE temp AS
   SELECT a.gid, b.id, min(a.dist)
   FROM
     (SELECT airport.gid,
             min(distance(airport.the_geom, node.the_geom)) AS dist
      FROM airport, node
      GROUP BY airport.gid) AS a,
     (SELECT airport.gid, node.id,
             distance(airport.the_geom, node.the_geom) AS dist
      FROM airport, node) AS b
   WHERE a.dist = b. dist
         AND a.gid = b.gid
   GROUP BY a.gid, b.id;

UPDATE airport
SET nearest_node =
   (SELECT id
    FROM temp
    WHERE temp.gid = airport.gid);

Then, we can calculate drive times between network nodes and “airport nodes”. I am still looking for the most efficient way to perform this calculation. The trivial solution I used for this example was to calculate all drive time values separately for each airport node (as described in “Creating Catchment Areas with pgRouting and QGIS”). Afterwards, I combined the values to find the minimum drive time for each network node:

CREATE table catchment_airport_final AS
SELECT id, the_geom, min (cost) AS cost
FROM catchment_airport
GROUP By id, the_geom;

The resulting point layer was imported into QGIS. Using TIN interpolation (from Interpolation plugin), you can calculate a continuous cost surface. And Contour function (from GDALTools) finally yields drive time isochrones.

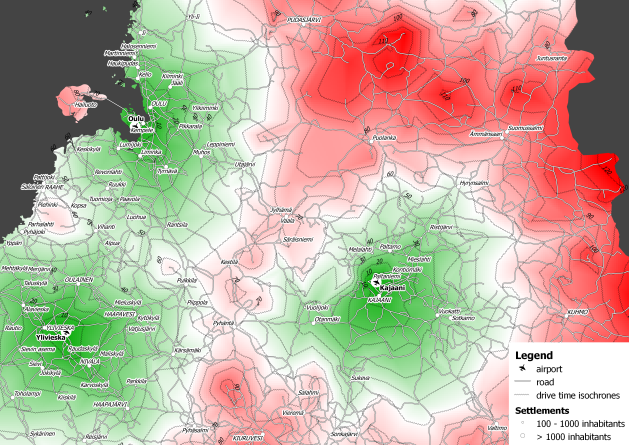
Drive time isochrones around airports in northern Finland

Based on this analysis, it is possible to determine how many inhabitants live within one hour driving distance from an airport or how many people have to drive longer than e.g. ninety minutes to reach any airport.


Creating Catchment Areas with pgRouting and QGIS

Based on the network created in my last post, I’ll now describe how to calculate the catchment area of a network node.

We need both network and node table. The cost attribute in my network table is called traveltime. (I used different speed values based on road category to calculate traveltime for road segments.) The result will be a new table containing all nodes and an additional cost attribute. And this is the query that calculates the catchment area around node #5657:

create table catchment_5657 as
select
    id,
    the_geom,
    (select sum(cost) from (
	   SELECT * FROM shortest_path('
	   SELECT gid AS id,
		  start_id::int4 AS source,
		  end_id::int4 AS target,
		  traveltime::float8 AS cost
	   FROM network',
	   5657,
	   id,
	   false,
	   false)) as foo ) as cost
from node

Then, I loaded the point table into QGIS and calculated a TIN based on the cost attribute. With “Contour” from GdalTools, you can visualize equal-cost areas even better:

Catchment area around node #5657 with contour lines

Between contour lines, there is a difference of 10 minutes travel time.


A Beginner’s Guide to pgRouting

The aim of this post is to describe the steps necessary to calculate routes with pgRouting. In the end, we’ll visualize the results in QGIS.

This guide assumes that you have the following installed and running:

  • Postgres with PostGIS and pgAdmin
  • QGIS with PostGIS Manager and RT Sql Layer plugins

Installing pgRouting

pgRouting can be downloaded from www.pgrouting.org.

Building from source is covered by pgRouting documentation. If you’re using Windows, download the binaries and copy the .dlls into PostGIS’ lib folder, e.g. C:\Program Files (x86)\PostgreSQL\8.4\lib.

Start pgAdmin and create a new database based on your PostGIS template. (I called mine ‘routing_template’.) Open a Query dialog, load and execute the three .sql files located in your pgRouting download (routing_core.sql, routing_core_wrappers.sql, routing_topology.sql). Congratulations, you now have a pgRouting-enabled database.

Creating a routable road network

The following description is based on the free road network published by National Land Survey of Finland (NLS). All you get is one Shapefile containing line geometries, a road type attribute and further attributes unrelated to routing.

pgRouting requires each road entry to have a start and an end node id. We’ll create those now:

First step is to load roads.shp into PostGIS. This is easy using PostGIS Manager – Data – Load Data from Shapefile.

Next, we create start and end point geometries. I used a view:

CREATE OR REPLACE VIEW road_ext AS
   SELECT *, startpoint(the_geom), endpoint(the_geom)
   FROM road;

Now, we create a table containing all the unique network nodes (start and end points) and we’ll also give them an id:

CREATE TABLE node AS
   SELECT row_number() OVER (ORDER BY foo.p)::integer AS id,
          foo.p AS the_geom
   FROM (
      SELECT DISTINCT road_ext.startpoint AS p FROM road_ext
      UNION
      SELECT DISTINCT road_ext.endpoint AS p FROM road_ext
   ) foo
   GROUP BY foo.p;

Finally, we can combine our road_ext view and node table to create the routable network table:

CREATE TABLE network AS
   SELECT a.*, b.id as start_id, c.id as end_id
   FROM road_ext AS a
      JOIN node AS b ON a.startpoint = b.the_geom
      JOIN node AS c ON a.endpoint = c.the_geom

(This can take a while.)

I recommend adding a spatial index to the resulting table.

Calculating shortest routes

Let’s try pgRouting’s Shortest Path Dijkstra method. The following query returns the route from node #1 to node #5110:

SELECT * FROM shortest_path('
   SELECT gid AS id,
          start_id::int4 AS source,
          end_id::int4 AS target,
          shape_leng::float8 AS cost
   FROM network',
1,
5110,
false,
false)

Final step: Visualization

With RT Sql Layer plugin, we can visualize the results of a query. The results will be loaded as a new layer. The query has to contain both geometry and a unique id. Therefore, we’ll join the results of the previous query with the network table containing the necessary geometries.

SELECT *
   FROM network
   JOIN
   (SELECT * FROM shortest_path('
      SELECT gid AS id,
          start_id::int4 AS source,
          end_id::int4 AS target,
          shape_leng::float8 AS cost
      FROM network',
      1,
      5110,
      false,
      false)) AS route
   ON
   network.gid = route.edge_id

In my case, this is how the result looks like:

Route from node #1 to node #5110


Routing Multiple Vehicles with pgRouting DARP Function

pgRouting has become even more powerful: A DARP (Dial-a-Ride-Problem) solver is now available in the “darp branch” of the pgRouting repository.

The Dial-a-Ride Problem (DARP) solver tries to minimize transportation cost while satisfying customer service level constraints (time windows violation, waiting and travelling times) and fleet constraints (number of cars and capacity, as well as depot location).

Documentation can be found at www.pgrouting.org/docs.


  • <<
  • Page 3 of 4 ( 65 posts )
  • >>
  • postgis

Back to Top

Sustaining Members