Related Plugins and Tags

QGIS Planet

SVG textures + blend modes = Cool QGIS Maps

Did you know you can use textures to fill a polyon in QGIS? No? Well you do now!

The cool thing is you can get results like this with a simple SVG and a texture.

Alt Text

So how do you do it? Lets give it a go.

First grab a texture you want from http://texturelib.com/

Install Inkscape, or any other tool that can create svgs with textures.

Drag and drop your texture into Inkscape and embed the texture into the SVG:

Alt Text

Twaek any settings you need in Inkscape and save it somewhere QGIS can find.

Tip: You can configure extra search paths for svg in Options -> System -> SVG Paths

Alt Text

Open QGIS and load a polygon layer

Change the symbol type for the style to SVG fill and selet your SVG

Alt Text

Hit apply.

Opps that's not right

Alt Text

Enter the handy blend modes added by Nyall.

Change the blend mode to Soft Light and move the layer to the top of the drawing list

Alt Text

SWEEEET!!!!

Now go and make some pirate maps.

QGIS and WFS service caching

The dutch PDOK-services plugin is a simple plugin to load some national (PDOK) dataservices. One of the available services is a Web Features Service (WFS), while a very handy service, calling the WFS service to load all roads in the Netherlands shows you the following result: As you can see the blue bar are actually […]

Building QGIS on Ubuntu 13.04

It seems upgrading to Ubuntu 13.04 breaks a few things in the QGIS build process. Here’s some quick workarounds I’ve found to get it building again.

Firstly, Ubuntu defaults to Qt 5, causing the error:

CMake Error at /usr/share/cmake-2.8/Modules/FindQt4.cmake:1216 (message):

 Found unsuitable Qt version "5.0.1" from /usr/bin/qmake, this code requires
 Qt 4.x

This can be fixed by switching the system default back to Qt 4, so that  qmake refers to the Qt 4 version. The “qt4-default” package handles this switch for you, so just run:

sudo apt-get install qt4-default

Update: A better solution was found by Pierre and Pvanb and is described here. Basically it involves changing the QMAKE_EXECUTABLE option from /usr/bin/qmake to /usr/bin/qmake-qt4.

Next, I was getting the error:

make[2]: *** No rule to make target `/usr/lib/libpython2.7.so', needed by `output/lib/libqgispython.so.1.9.0'. Stop.

I’m not sure if this is the correct solution, but setting up some links and re-running ldconfig gets around this:

sudo ln -sf /usr/lib/x86_64-linux-gnu/libpython2.7.so.1 /usr/lib/libpython2.7.so.1
sudo ln -sf /usr/lib/x86_64-linux-gnu/libpython2.7.so /usr/lib/libpython2.7.so
sudo ldconfig

Update: a better solution is to change the PYTHON_LIBRARY option from /usr/lib/libpython2.7.so to /usr/lib/x86_64-linux-gnu/libpython2.7.so

These two changes were enough to get QGIS building again. If you’ve got a better solution for these errors, let me know…

A neat trick in QGIS 2.0 – images in atlas prints

Here’s a cool trick which you can do in QGIS 2.0. It builds on two new features introduced in version 2.0 – atlas prints and html labels.

Atlas prints (previously available as a plugin, now integrated into QGIS core) were developed by Oslandia, and allow you to create data driven map layouts from a specified coverage layer. You can read more about them here.

Another new feature in QGIS 2.0 is the ability to render composer labels as html (courtesy of Olivier Dalang). This allows all kinds of fantastic effects, such as formatting text in the middle of a label (using <b>, <i>, and <font> tags) or creating labels which contain HTML tables. You can even use CSS stylesheets and rules to format the HTML! I’ve been told JavaScript also works inside the labels, but I’ve yet to try this out.

You can combine these two new features for some great tricks. Let’s say we’d like to create a set of maps of local councils, and we want each map to have a watermarked logo of the council on it. For this example I’ve created a basic basemap of Victorian councils, and I’ve downloaded all the council logos (in a variety of formats) to a local folder. Next, I’ll add an extra column to the council layer containing the name of the logo image:

adding_logo_column

Adding a logo column to the table

Then, we’ll throw together a simple composition containing the map and set it up as an atlas print:
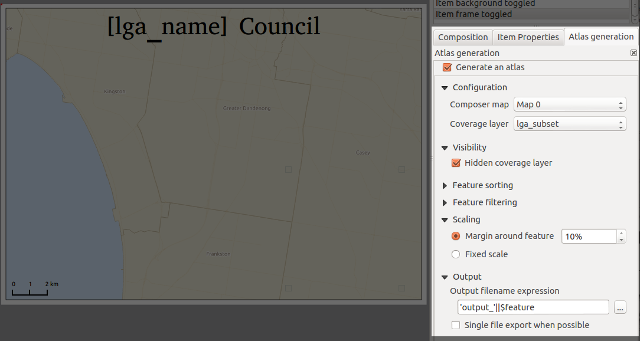
setting_up_atlas

Generating an atlas

Now for the fun bit. I’ll add a label item to the composer, set it to “Render as HTML”, and insert some specially-crafted html:
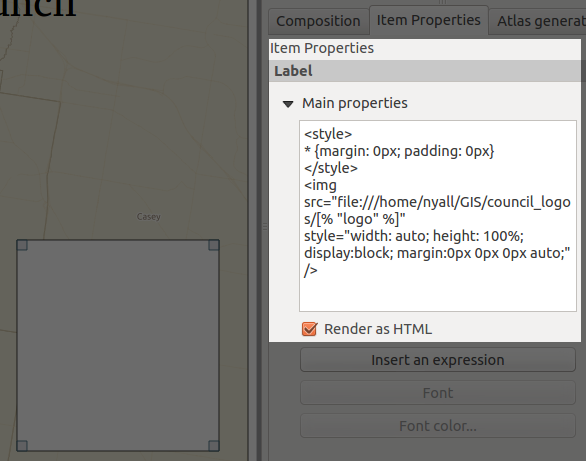
The magic HTML label...

The magic HTML label…

For copy/paste purposes here’s the label contents again:

<style>
* {margin: 0px; padding: 0px}
</style>
<img src="file:///home/nyall/GIS/council_logos/[% "logo" %]"
style="width: auto; height: 100%; display: block; margin: 0px 0px 0px auto;" />

There’s a couple of things to note here. First, the magic happens in the image’s src attribute (“file:///home/nyall/GIS/council_logos/[% "logo" %]“). When the composer is exported, QGIS will replace the [% "logo" %] part with the contents of the logo field for each row in the councils table. This means the image source will then point to the local copy of the council’s logo, eg “file:///home/nyall/GIS/council_logos/glen_eira.jpg” for the first row.

Secondly, I’ve styled the image with the css:

width: auto; height: 100%; display: block;

This allows the image to resize to 100% of the height of the label while maintaining its correct aspect ratio. I’ve also added the rule

margin: 0px 0px 0px auto;

to force the image to right align within the html label. This ensures that all the watermarked logos will appear in a consistent size and position for each map.

Lastly, I’ll remove the label’s frame and background by unchecking these options, then set its transparency to 80% under the new “Rendering” section:

Yet another new feature in QGIS 2.0...

Yet another new feature in QGIS 2.0…

Ok, we’re all done. Now, when I select Composer -> “Export as Image”, we’ll get a lovely set of council maps complete with watermarked council logo!

A watermarked atlas!

A watermarked atlas!

There we go — all ready for print, with no manipulation in external programs required at all!

Bonus post-credits section

Here’s a kicker — the linked images don’t need to be local. That means you can even piggy-back off an existing web service to generate an image on the fly! Let’s say you were asked to add QR codes to your maps to link directly to the council website. All it takes is adding a new column to the table, then modifying the image src to read:

src="http://qrfree.kaywa.com/?l=1&s=8&d=[% "url" %]"

Now when we export the maps we’ll also get a QR image generated on the fly and inserted into the layout!
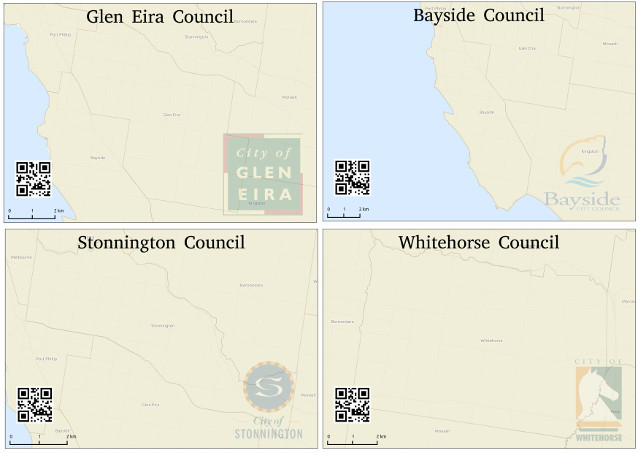
Complete with dynamically generated QR code!

Complete with dynamically generated QR code!

Combining HTML labels and atlas prints in this way is extremely powerful. This example is just touching the tip of the iceberg – I’m keen to see what the community can do with this when QGIS 2.0 is released!

Advanced Python Field Calculator

Advanced Python field calculator is one of the numerous tools in Sextante for QGIS. It’s extremely powerful but it doesn’t use the syntax of QGIS’ default field calculator (the one you can access via attribute table). Therefore, here comes a short introduction:

If you want to reproduce this example, I used a dataset of town areas from the new open government data site of Lower Austria.

The upper half of the Advanced Python field calculator is rather self-explanatory but the lower half is where it gets interesting: Code in the global expression section will be executed only once before the calculator starts iterating through all the features of the input layer. Therefore, this is the correct place to import necessary modules or to calculate variables that will be used in subsequent calculations. Code in the formula section will be evaluated for each feature in the input layer. As shown in the following example, this is where we can calculate new values, e.g. the area of the polygons in km²:

sextante_pythonfieldcalc_area

As you can see, the feature geometry can be accessed using $geom.

If you want to access an existing attribute, that’s possible using <attribute_name>.

Anyway, this is the resulting layer’s attribute table including the new areaKM2 field:

sextante_pythonfieldcalc_area_results

Thanks to Victor for pointing me to the documentation of FieldPyculator which Advanced Python field calculator is based on.


Australian QGIS User Forums - Wrap up

I had a feeling this year was going to be a good one for QGIS. The recent success of the first Australian QGIS User Group in Perth, and the most recent one in Melbourne can only reinforce this. Both events had a great turn out of around fifty people.

The Perth event was run as three presentations followed by a discussion session.

  • Mapping Projects with QGIS (Jeremy Taylor - City of Belmont)

  • Custom Plugin Development (Shane French - Department of Environment and Conservation)

  • All the New Cool Stuff in QGIS 2.0 (Nathan Woodrow - Digital Mapping Solutions)

With a bit more time to prepare we added a workshop session to the Melbourne event:

Workshops

  • Styling and managing style libraries (Chris Scott - Digital Mapping Solutions)

  • Working with the composer (Nathan Woodrow - Digital Mapping Solutions)

  • Custom QGIS forms and Python (Nathan Woodrow - Digital Mapping Solutions)

  • General Q&A

Presentations

  • A GIS officers journey into the light (Barrett Higman - Alpine Shire Council)

  • QGIS in Victoria Police (Nyall Dawson - Victoria Police)

  • All the New Cool Stuff in QGIS 2.0 (Nathan Woodrow - Digital Mapping Solutions)

There was a great mix of users, even a few non users keen to check QGIS out for the first time. I was extremely happy with how both days turned out and the feedback so far has been fantastic. A massive thanks must go to DMS who sponsored both events.

Alt Text

I also thought I might give filming and screen recording my workshop a go. Seemed to turn out alright, for a first attempt anyway. A few mistakes here and there but live things never go 100% :)

{% youtube Z84GMcQV3EM %}

On a side note it was also a pleasure to be able to talk about my adventures with QGIS at the Melbourne Open GIS meetup. Big thanks to Simon for asking me to talk.

Australian QGIS User Forums - Wrap up

I had a feeling this year was going to be a good one for QGIS. The recent success of the first Australian QGIS User Group in Perth, and the most recent one in Melbourne can only reinforce this. Both events had a great turn out of around fifty people.

The Perth event was run as three presentations followed by a discussion session.

  • Mapping Projects with QGIS (Jeremy Taylor - City of Belmont)

  • Custom Plugin Development (Shane French - Department of Environment and Conservation)

  • All the New Cool Stuff in QGIS 2.0 (Nathan Woodrow - Digital Mapping Solutions)

With a bit more time to prepare we added a workshop session to the Melbourne event:

Workshops

  • Styling and managing style libraries (Chris Scott - Digital Mapping Solutions)

  • Working with the composer (Nathan Woodrow - Digital Mapping Solutions)

  • Custom QGIS forms and Python (Nathan Woodrow - Digital Mapping Solutions)

  • General Q&A

Presentations

  • A GIS officers journey into the light (Barrett Higman - Alpine Shire Council)

  • QGIS in Victoria Police (Nyall Dawson - Victoria Police)

  • All the New Cool Stuff in QGIS 2.0 (Nathan Woodrow - Digital Mapping Solutions)

There was a great mix of users, even a few non users keen to check QGIS out for the first time. I was extremely happy with how both days turned out and the feedback so far has been fantastic. A massive thanks must go to DMS who sponsored both events.

users.jpg

I also thought I might give filming and screen recording my workshop a go. Seemed to turn out alright, for a first attempt anyway. A few mistakes here and there but live things never go 100% :)

On a side note it was also a pleasure to be able to talk about my adventures with QGIS at the Melbourne Open GIS meetup. Big thanks to Simon for asking me to talk.

Comparison of SOM Classification and Unsupervised KMeans image classification in Sextante

QGIS Back in the Day

Do you remember this?

QGIS of Yesteryear

If so, you’ve been using QGIS a long time…

  • OGR and PostGIS support
  • No raster support
  • Three widgets on the Symbology tab
  • No symbology in the legend

But you could use it handily on a 640x480 display.

New forms related features coming in QGIS 2.0

View here on youtube: https://www.youtube.com/watch?v=rnqRAOvuJEU

New forms related features coming in QGIS 2.0

View here on youtube: https://www.youtube.com/watch?v=rnqRAOvuJEU

QGIS 2 Annotations

View here on youtube: https://www.youtube.com/watch?v=0pDBuSbQ02o

QGIS 2 Annotations

View here on youtube: https://www.youtube.com/watch?v=0pDBuSbQ02o

Image Analysis Using QGIS

Introduction

Rasters are created from gridded data. Each pixel is coloured according to an interpolated value, e.g. triangulation (TIN), nearest neighbour analysis.

A raster file is comprised of a pixels arranged in a grid formation. Each pixel contains a colour value that instructs the computer as to what colour to use when displaying it. Raster images tend to be used for grids as they are a more efficient method of showing large areas of coloured pixels than vector maps.

The following illustrates how a raster grid represents terrain, and how the information might be extracted:-

For simplicity’s sake, imagine that we’re back in the days of 256 colours with 1 being white and 255 being black. I tend to display relief with the highest ground as white or red, then to show lower ground as green or blue.

Let’s take a cross section through a hill:

A grid raster image of the terrain would appear similar to below (please note that I have drawn this in Inkscape using a gradient fill to keep the demonstration simple!):-

The numeric values of the raster grid that the computer would see would be similar to this:

5 5 5 5 5
5 100 150 100 5
5 100 250 100 5
5 100 150 100 5
5 5 5 5 5

Note the values are not the actual elevation, just the colour values of the pixels. The elevation that each pixel value corresponds to (the legend) is contained in the accompanying shape file along with image registration (the x, y coordinates).

By analysing the grid and determining the relationship between pixel values and the elevation that they represent the GIS software can accurately model the terrain. Once the terrain has been modelled, it is possible to undertake further analysis such as slope calculation, predicting hill shade or water runoff.

The Image toolbar

Firstly, let’s have a look at QGIS’ image tool bar:-

QGIS image bar

QGIS image bar

This can be added by right clicking on any toolbar and selecting Raster from the short cut menu. The buttons are from left to right:-

  • Stretch Histogram to Full Data Set
  • Local Histogram Stretch
  • Geo-referencer
  • Interpolation
  • Zonal Statistics

Detecting tree canopies with Unsupervised Classification in Sextante

Dynamically updating layers in QGIS with PostGIS views

View here on youtube: https://www.youtube.com/watch?v=oOhbbEkl4Kg

Dynamically updating layers in QGIS with PostGIS views

View here on youtube: https://www.youtube.com/watch?v=oOhbbEkl4Kg

Coming soon in QGIS Part 2 – Color control for raster layers

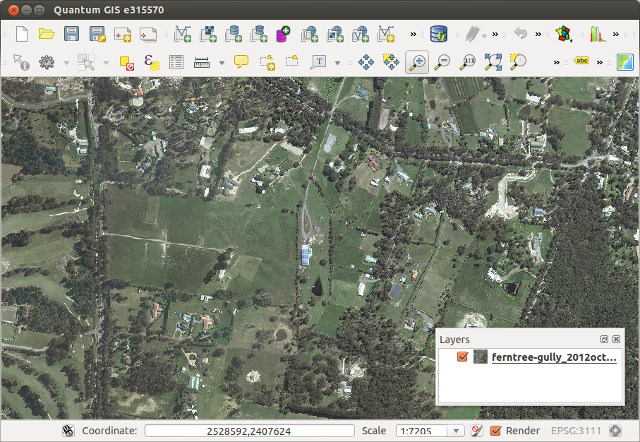
Continuing on from part 1, another feature I’ve recently pushed to QGIS is the ability to control the hue, saturation and colour of a raster layer. This builds off the excellent work done by Alexander Bruy (who added brightness and contrast controls for raster layers), and it’s another step in my ongoing quest to cut down the amount of map design tweaking required outside of QGIS. Let’s step through these new features and see what will be available when version 2.0 is released in June…

First up is the ability to tweak the saturation of a layer. Saturation basically refers to the intensity of a colour, with low saturation resulting in a more washed out, greyer image, and high saturation resulting in more vibrant and colourful images. Here’s a WMS layer showing an aerial view of Victoria at its driest, least appealing and most bushfire ready state:

Original layer

Raster layer before saturation controls…

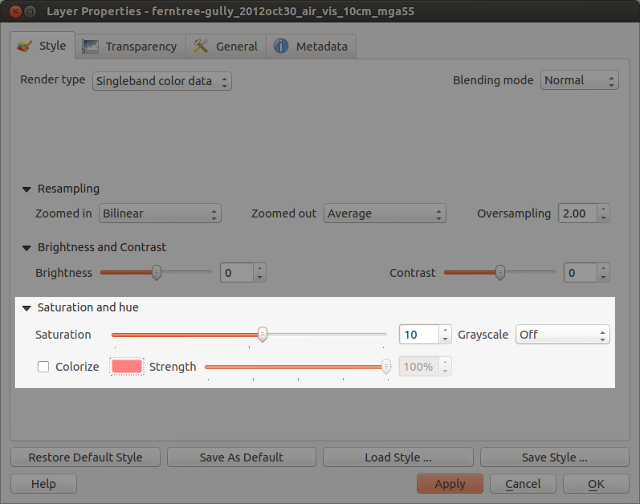
Let’s tweak the saturation a bit to see if we can make it more appealing. In the Style tab under raster layer properties, you’ll see a new “Saturation and hue” section. For this layer I’ll bump the saturation up from its default value of zero:

Saturation settings

Saturation settings

Which results in something like this:

Resultant layer!

… and after increasing the saturation!

Ah, much better. This actually looks like somewhere I’d like to live. A bit over-the-top perhaps, but it IS handy to make quick adjustments to raster colours in this way without the need for any external programs.

How about turning an image grayscale? I regularly have to do this with street directory basemaps, and until now couldn’t find a satisfactory way of doing this in QGIS. Previously I’ve tried using various command line utilities, but never found one which could turn an image grayscale without losing embedded georeferencing tags. (I did manage to achieve it once in QGIS using a convoluted approach involving the raster calculator and some other steps I’ve thankfully forgotten.)

But now, you can forget about all that frustration and quickly turn a raster grayscale by using a control right inside the layer properties! You even get a choice of desaturation methods, including lightness, luminosity or average. Best part about this is you can then right click on the layer to save the altered version out to a full-resolution georeferenced image.

grayscale

Street map in grayscale… woohoo!

Lastly, there’s the colourise option. As expected, this behaves in a similar fashion to the colourise tools in GIMP and Photoshop. It allows you to tint a layer to a specified colour. Let’s take a WMS layer of Melbourne, tweak the brightness and contrast, and colourise it blue…

colorize_settings

Tweaking the colourize settings

… and the end result wouldn’t be out of place in Ingress or some mid 90′s conspiracy flick!

colorized

Colorized WMS layer

These changes are just a tiny, tiny part of what QGIS 2.0 has to offer. It’s looking to be a sensational release and I can’t wait for final version in June!

Print Composer 2.0 – Take #6

The latest version of Print composer features new

Rulers and guide lines or “alignments”

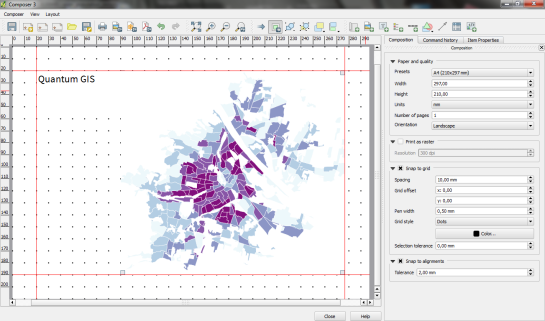
Rulers are a well-known feature in graphics programs such as Gimp and Photoshop. Now you can also find them in QGIS Print Composer. Click onto the ruler, hold the mouse key down and move the cursor to position guide lines for map feature alignment.

printcomposer_grid

Of course, there’s also the handy “Snap to grid” functionality.


  • <<
  • Page 88 of 142 ( 2821 posts )
  • >>

Back to Top

Sustaining Members