Related Plugins and Tags

QGIS Planet

Print Composer 2.0 – Take #5

This fifth part in my series on QGIS 2.0 Print Composer presents

Map grids

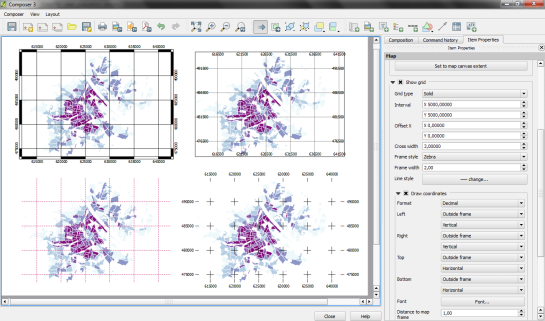
There are numerous different options for map grids in the new composer but a picture is worth a thousand words:

printcomposer_grids

The upper-left map features a zebra frame style and coordinate labels aligned horizontally and vertically.

The upper-right map shows a normal frame with labels written inside the frame instead of outside. This grid shows an additional offset.

The lower-left map has no frame but customized, colored and dashed grid lines.

Finally, the lower-right map shows a cross grid with default horizontal coordinate labels.


Coming soon in QGIS 2.0 – blend modes for layers

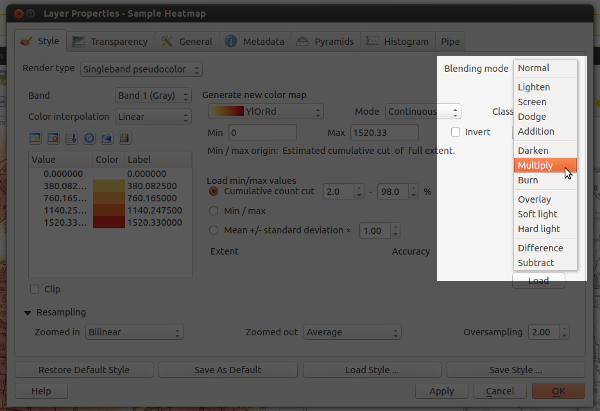
I’ve just pushed my first major contribution to QGIS — the ability to set the compositing mode for a layer. Compositing is a technique widely used by cartographers and graphic artists to fine tune how layers are blended together, and it allows for some spectacular results! Until now, the only way to get these effects would be to export a map to a separate editor like Photoshop or GIMP and playing with the layer modes there. But with QGIS 2.0, blending can be controlled via a simple drop down menu for both raster and vector layers:

Blending modes for a raster layer

Woohoo… blending modes in QGIS!

So what makes this so great? Well, in previous versions the only option for compositing layers in QGIS was by setting a layer’s opacity. This approach has some limitations. Let’s say you want to overlay two raster layers – a basemap layer and a heatmap. You could place the heatmap layer over the basemap and set its transparency at 50% so that the basemap shows through, but then both the basemap and heatmap layers will be partially faded out:

Overlaying layers with transparency

Overlaying layers by altering transparency – see how both the heatmap and basemap are partially faded

With QGIS 2.0, you’ll be able to use the “multiply” blend mode to overlay these layers. This means both the heatmap and underlying basemap will be shown with full intensity:

Overlaying rasters with multiply

Overlaying rasters with “multiply” blend mode – both layers are shown in their full intensity!

Ok… perhaps that’s not the prettiest example, but it is something I have to do a lot in my job. Until now it’s only been possible by exporting the map to GIMP or Photoshop/Illustrator and setting the blend modes there. That’s always fiddly, time consuming and generally frustrating all round. Much easier to just change it with a dropdown within QGIS itself.

Let’s move on to some more impressive example. First, here’s a terrain map using a combination of a landcover thematic with ‘overlay’ blending and a hillshade set to ‘multiply‘ blending. The graticule lines are also set to overlay – note how they aren’t visible over the lighter water areas and brighter hillshade regions.

Hill shading with advanced compositing

Hill shading with advanced compositing… Hal Shelton would be proud!

Ok, that’s nice, but let’s try something a little different. Using a combination of darkenscreenhard light and overlay:

Stamen-style watercolors directly within QGIS!

Live Stamen-style watercolors within QGIS – sweet!

These a just some rough examples — I’m keen to see what results others get using this feature (feel free to post links to your work in the comments).

One final note: I’m really appreciative of the efforts of the QGIS dev team, who’ve been really supportive and helpful while I find my way around the QGIS codebase. A big thank you has to go to Nathan Woodrow for taking the time to review this commit and answering all the questions I’ve had!

My toolset

I am a big fan Scott Hanselman and this post was inspired by his 2011 Ultimate Developer and Power Users Tool List for Windows with some extra stuff thrown in. I have nowhere close to the amount of tools that Scott does but I thought it would be cool to share my setup anyway.

Editors\IDEs

  • Sublime Text 2\Notepad++ : These two text editors are the best of the bunch. Sublime Text 2 has a nice simple interface, good text editing features, and simple to configure. Sublime doesn't fill every need so Notepad++ fills any gaps.

  • Visual Studio 2010 : I'm mostly a C++ and Python guy now due to QGIS but every now and then I need to do some C#.

  • Qt Creator : If you are working with Qt and C++ this is the IDE for it. Built in Qt help files, form designer, good editor (good for someone who can't use vim). Qt Creator is like Visual Studio for Qt C++ but less...bloated.

  • Aptanta Studio 3 : Since starting Python I have tried a bunch of editors and have settled on Aptanta Studio 3 for now. I find it works constantly, has some nice IDE features, built in unit test runners, and is FREE. If I'm working on a single Python file I will normally use Sublime Text 2 but anything project based like QMap or a QGIS plugin will be done in here.

Dev Tools

  • git : Everyone uses git and if you don't you should.

  • svn : -_- Ok it was good at the time, but see above.

  • ConEmu : I bloody love this program. If you are still using cmd.exe to do anything just stop now! Go and download this. Tabs, better copy and paste, resize-able window, predefined tasks, and heaps more. Trust me you will be more productive. I found it though one of Scott's posts and haven't stopped using it since.

GIS

  • QGIS : Obviously

  • MapServer : The company I now work for uses MapServer as the base for their product, although that isn't the only reason that I like it of course.

  • GRASS\SAGA GIS : Great powerful tools for vector and raster progressing.

  • ILWIS : I first used this when I did a bushfire project ( the second round was done in QGIS ) however while I don't use it much anymore it still has some cool ideas.

  • PostGIS : Great relational spatial database

  • SQL Server 2008\2012 Express : It's not that bad. 2012 has better spatial support. QGIS supports 2008/2012.

Handy tools

  • Bins : This is a nifty little tool that I found tonight. Lets you group icons into "Bins" in the Windows taskbar so you don't end up with mess of icons. Handy! Not free but only $5

  • Fences : Another one from Scott's blog. Handy for sorting out your mess of a desktop.

  • Greenshot : Great for taking screens shots. Export to Paint, Dropbox, Imgur, file, clipboard, printer. Built-in image editor for annotations. And it's free.

  • Dropbox : It always pains me to hear people say "oh my computer crashed and I lost all my documents", and if it's your sister in law two days before an assignment is due then it's even worse. Use Dropbox, or SkyDrive, or something but keep more then one copy of important stuff.

  • Paint.NET\GIMP : Even as a developer one needs an editing program. These are the two best free ones you can get.

  • Expression Encoder 4 : I have plans to do some screencasting in the future so I am giving this a run to see how things work out. This has a ten minute limit on the free version, but you don't really want to hear me talking for more then ten minutes anyway.

  • Total Commander : This is one of the best tools you can get for working with your file system. No drag and drop here. Full keyboard control and speed. Can take a bit to getting used to however it will increase your productivity.

  • UtlraMon : I can't even work with one screen anymore and this tool helps you get the most out of your monitors. Multi screen taskbar, shortcuts for predefined window locations and more.

Chat

  • Skype : I don't really use Skype a lot but when I have it always works well. Anytime I have to be away from the family in the future I plan on calling using Skype.

  • Irssi : Good ol' IRC. I have played around with a whole bunch of IRC clients on Windows and Linux but never found one that I liked apart from Irssi. Sure it runs in a console window but IRC is just text anyway so who cares. I like to tweak things so Irssi scratches that itch for me. NathanW on #qgis.

Online

  • Trello : Another one in the bloody love list. A simple to use but powerful, well I don't really know how to describe it so you can just check it out. I use it for personal task management, work projects, software projects, event planning.

  • GitHub : I really like GitHub it really does add a nice social experience to development that most sites fail on.

  • gis.stackexchange.com : Personally I really think they hit the nail on the head when building this Q&A site. I try to spend as much time as I can on here answering QGIS questions.

If anyone has anything extra they can recommend feel free to leave a comment.

Print Composer 2.0 – Take #4

Today’s spotlight is on a feature which you’ll really love if you have to arrange a little more text on a print layout:

HTML labels

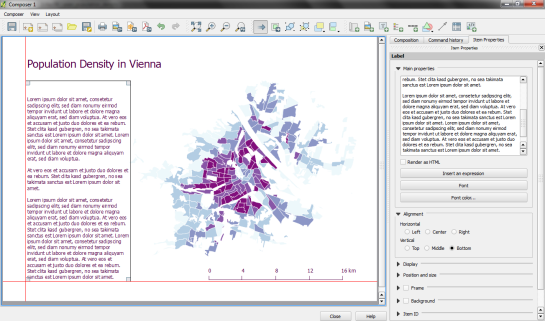
Regular labels are limited to one font, size and color. With the new “Render as HTML” option, you gain flexibility to use HTML tags to style your text by adding headers, lists and even images (note the QGIS logo I added by pointing to the image online):

printcomposer_html


Print Composer 2.0 – Take #3

After guide lines and multi-column legends, today’s focus is on

Overview maps

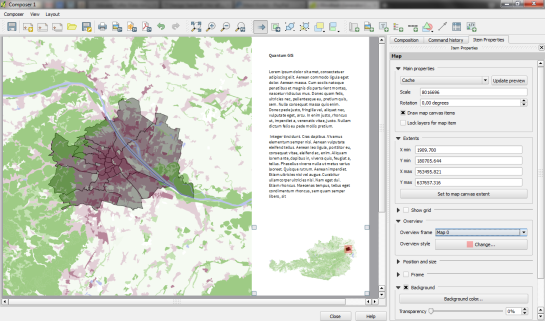
Small overview maps are used to help the reader get an idea of where the region displayed on the main map is located. In the new Print Composer, it’s simple to add such overviews: Add the main map as usual. Then add another map object to the composition an go to the “Overview” section. There, you can specify that the second map object should be an overview map for the first one: Just specify “Map 0″ in the dropdown list:

printcomposer_overview


New Version of the QGIS Script Runner Plugin

The Script Runner plugin allows you to manage and execute a collection of scripts in QGIS to automate tasks and perform custom processing.

Script_Runner

Version 0.6 of Script Runner has been released and includes these changes:

  • Arguments can be passed to a script using keyword arguments
  • Script output is logged to the Script Runner window
  • Script output can be logged to disk
  • Preferences dialog allows control of output and logging options
  • Exceptions in scripts are displayed without interfering with console/logging output
  • Context menu (right-click) to access script functions
  • Edit script function uses system default editor or one you specify in preferences

For a basic introduction to Script Runner see this post: Script Runner: A Plugin to Run Python Scripts in QGIS

Working with Scripts

Adding Scripts

To run a script, you must add it to Script Runner using the Add Script tool on the toolbar. Select the script from the file dialog to add it to a list in the left panel. The list of scripts is persisted between uses of QGIS.

Running a Script

To run a script, select it from your list of scripts and click the Run tool. Output from the script will be displayed in the Script Runner console

Remove a Script

You can remove a script by selecting it from the list and clicking the Remove Script tool. This just removes it from the list; it does nothing to the script file on disk.

Script Information

Clicking the Info tool will populate the Info and Source tabs in the panel on the right. The Info tab contains the docstring from your module and then a list of the classes, methods, and functions found in the script. Having a proper docstring at the head of your script will help you determine the purpose of script.

At version 0.6 the Info tool is only needed if you have disabled automatic display of info/source (see Preferences).

Viewing the Source

You can view the source of the script on the Source tab. This allows you to quickly confirm that you are using the right script and it does what you think it will.

New Features

Version 0.6 implements a number of new features.

Passing Arguments to a Script

You can pass arguments to your script using keywords. Your run_script function must have two arguments:

1
  def run_script(iface, **args):

Running your script is done using the Run script with arguments tool. This prompts you to enter your argument(s) in a key=value format:

Argument_dialog

All strings must be quoted and multiple arguments should be separated by a comma.

When your script is run, the arguments are contained in args, which is a Python dict. In the example above, you could access them like this:

1
2
  my_path = args['path']
  my_buffer_size = args['buffer_size']

Scripts that accept keyword arguments are displayed in the list with two asterisks appended to their name:

arg_scripts

See Passing Arguments for a complete example.

Output Console

All print statements in your script will be directed to the Script Runner console. In addition, any tracebacks from exceptions will be displayed there, as well as in a popup dialog.

Printing messages to the console can be useful for both development and status updates in long running scripts. You can clear the console using the Clear Console tool. There is also an option in Preferences to clear the console each time a script is run.

Logging to Disk

You can choose to log everything that goes to the output console to disk. Use the Preferences dialog to setup the directory where the scriptrunner.log will be written.

Editing a Script

You can open the selected script in an external editor by right-clicking on it and choosing Edit script in external editor from the popup menu. The default system editor for .py files will be used to open the script. In Preferences, you can specify a different editor by entering the full path to the executable.

Preferences

The Preferences dialog allows you to set the following options:

Script_Runner_Preferences

Script Examples

Here are three script examples: a simple script that has only a run_script function, one that uses a Python class, and one that passes keyword arguments.

Simple Script

This simple script contains only a run_script function:

1
2
3
4
5
6
7
8
9
10
11
12
13
14
15
16
17
18
    """ Load a layer and change the fill color to red. """
    from PyQt4.QtCore import *
    from PyQt4.QtGui import *
    from qgis.core import *
    from qgis.gui import *


    def run_script(iface):
        mapreg = QgsMapLayerRegistry.instance()
        mapreg.removeAllMapLayers()
        wb = QgsVectorLayer('/data/world_borders.shp', 'world_borders', 'ogr')
        mapreg.instance().addMapLayer(wb)
        renderer = wb.rendererV2()
        symb = renderer.symbol()
        symb.setColor(QColor(Qt.red))
        wb.setCacheImage(None)
        wb.triggerRepaint()
        iface.refreshLegend(wb)

When executed by Script Runner, the script removes any layers currently on the map, then loads the world_borders shapefile, sets its fill color to red, and updates the map canvas and the legend. The run_script function does all the work. You could expand this script by adding additional functions that are called from run_script.

A Script with a Class

This script uses a class that is initialized from the run_script function to load some layers:

1
2
3
4
5
6
7
8
9
10
11
12
13
14
15
16
17
18
19
20
21
22
23
24
25
26
27
28
29
30
    """Load all shapefiles in a given directory.  """
    from glob import glob
    from os import path

    from qgis.core import *
    from qgis.gui import *
    import qgis.utils

    class Loader:
        def __init__(self, iface):
            """Initialize using the qgis.utils.iface
            object passed from the console.
            """

            self.iface = qgis.utils.iface

        def load_shapefiles(self, shp_path):
            """Load all shapefiles found in shp_path"""
            print "Loading shapes from %s" % path.join(shp_path, "*.shp")
            shps = glob(path.join(shp_path, "*.shp"))
            for shp in shps:
                (shpdir, shpfile) = path.split(shp)
                print "Loading %s" % shpfile
                lyr = QgsVectorLayer(shp, shpfile, 'ogr')
                QgsMapLayerRegistry.instance().addMapLayer(lyr)

    def run_script(iface):
        ldr = Loader(iface)
        print "Loading all shapefiles in /qgis_sample_data/vmap0_shapefiles"
        ldr.load_shapefiles('/qgis_sample_data/vmap0_shapefiles')

In this example, the run_script function creates an instance (ldr) of a class named Loader that is defined in the same source file. It then calls a method in the Loader class named load_shapefiles to do something useful—in this case, load all the shapefiles in a specified directory.

Passing Arguments

This script illustrates passing an argument (a path) to load all shapefiles in a directory:

1
2
3
4
5
6
7
8
9
10
11
12
13
14
15
16
17
18
19
20
21
22
23
24
25
26
27
28
29
30
    """Load all shapefiles in a given directory."""
    from glob import glob
    from os import path
    from qgis.core import *
    from qgis.gui import *
    import qgis.utils


    class Loader:
        def __init__(self, iface):
            """Initialize using the qgis.utils.iface 
            object passed from the console.
 
            """
            self.iface = qgis.utils.iface

        def load_shapefiles(self, shp_path):
            """Load all shapefiles found in shp_path"""
            print "Loading shapes from %s" % path.join(shp_path, "*.shp")
            shps = glob(path.join(shp_path, "*.shp"))
            for shp in shps:
                (shpdir, shpfile) = path.split(shp)
                print "Loading %s" % shpfile
                lyr = QgsVectorLayer(shp, shpfile, 'ogr')
                QgsMapLayerRegistry.instance().addMapLayer(lyr)

    def run_script(iface, **args):
        ldr = Loader(iface)
        print "Loading all shapefiles in %s" % args['path']
        ldr.load_shapefiles(args['path'])

Lines 29 and 30 illustrate using the passed argument to print a message to the console and call the method to add the shapefiles to the map.

Final Word

The script examples are minimalistic—they don’t do error checking in a number of places, such as checking to see if a QgsVectorLayer is valid or if needed arguments were actually passed to the script. Don’t take the scripts as examples of complete, solid code.

Comments on this post are welcome, as are bug reports. The link to the bug tracker for Script Runner can be found in the About box, along with the link to the code repository and my email address.

Print Composer 2.0 – Take #2

After yesterday’s first post on guide lines & snapping for user-friendly map element arrangement, we’ll have a look at another great new addition:

Multi-column legends

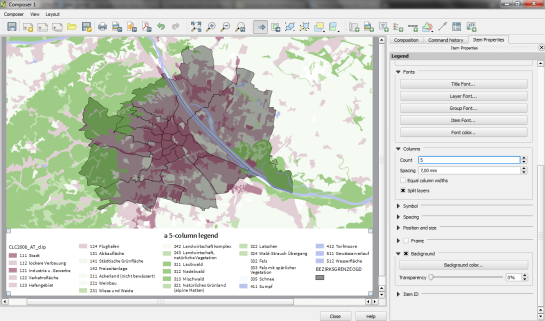
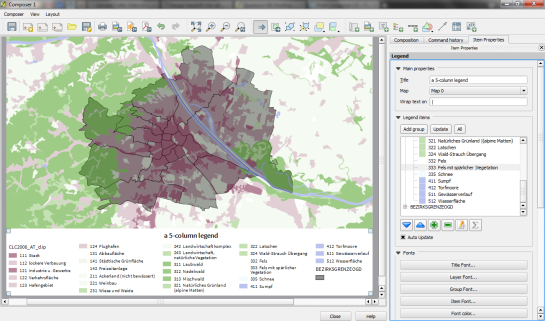
In the panel on the right, there is a new section called “Columns”. Here we can create multi-column legend layouts by specifying the desired number of columns. Add some spacing too. It will make the result look more balanced.

By default, Print Composer tries to keep all classes of one layer in one column. You can override this behavior – as I did in this example – by ticking “Split Layers”:

printcomposer_columns

Another useful trick is to use text wrapping for long class labels. This option can be found in the legend’s “Main properties” right at the top of the side panel. In this example, I specified wrap on the pipe “|” symbol and inserted this symbol into the longer class names to force a line break:

printcomposer_wraplegendtext


Print Composer 2.0 – Take #1

This is the first post in a series dedicated solely to Print Composer in QGIS 2.0 which you can already admire in recent nightly builds.

Guide lines & snapping for user-friendly map element arrangement

Arranging map elements has never been easier: Elements can be moved as freely as before but now they will automatically try to align with other elements on the page or the page borders. Additional red guide lines help interpret the snapping behavior.

printcomposer_guides


QGIS – Modifying a table structure

Modify a table structure

  1. Right click the layer in the Layer’s Panel
  2. Select the Fields tab
  3. It is possible to add/delete columns. It is also possible to change the method of data entry from the default text number cells to specify valid number rangers, selecting pre-set values, tick box, calendar

Updating Fields with Spatial Data

Count within polygons

  • Points: (e.g. levelling points per district). Vector, Analysis tools, Points in Polygon
  • Length :(e.g. road length per district). Vector, Analysis Tools, Sum Line Lengths
  • Area: (e.g. area of land uses per district). Vector, Geo Processing Tools, Union

Calculate Proportional Overlap

  1. Use the Intersect tool to create a new polygon that covers the area of intersection.
  2. Update the area for it and the original regions.
  3. Calculate the area of the new polygon as a % of the area of the original region.

Serving multiple WFS-T with TinyOWS

Our favorite WFS-T server complement of UMN Mapserver is TinyOWS. We like the simplicity of it so much, that we packaged it for Ubuntu and added it to OSGeoLive. Installation is easy:

sudo add-apt-repository ppa:ubuntugis/ubuntugis-unstable
sudo apt-get update
sudo apt-get install tinyows

The simplicity is a little bit too much, when it comes to serve multiple WFS-T on the same server. There is only one configuration file, but we want a configuration for each service. There are solutions for that, but I never saw a documentation of the most elegant solution we found. It uses Apache rewrite capabilities to set the TINYOWS_CONFIG_FILE environment variable according to the called URL:

# URL rewriting
RewriteEngine On

# Forbid direct access
RewriteRule ^/cgi-bin/.*$ - [F]

# Rewrite /xxx to /cgi-bin/tinyows with TINYOWS_CONFIG_FILE=/etc/tinyows/xxx.xml
RewriteRule ^/(.+)$ /cgi-bin/tinyows [QSA,PT,L,E=TINYOWS_CONFIG_FILE:/etc/tinyows/$1.xml]

This configuration included in a virtual host declaration (wfs.example.com) serves your WFS-T on wfs.example.com/servicename.

FOSSGIS at the LVG – State of Vorarlberg, Austria (updated interview)

A few months back I published an article about the large scale deployment of QGIS and FOSSGIS at the state administration of Vorarlberg, Austria. Shortly after I published the article, they asked for the opportunity to update the article with more details. The article that follows below is that amended version. In 2011, the State... Read more »

FOSSGIS at the LVG - State of Vorarlberg, Austria (updated interview)

A few months back I published an article about the large scale deployment of QGIS and FOSSGIS at the state administration of Vorarlberg, Austria. Shortly after I published the article, they asked for the opportunity to update the article with more details. The article that follows below is that amended version.

In 2011, the State of Vorarlberg, Austria became a new sponsor for the QGIS project. I was quite interested in the work they were doing as they are yet another great example of QGIS and FOSSGIS being used in an enterprise level setting. The “Landesamt fuer Vermessung und Geoinformation” - LVG, is the department in the state government of Vorarlberg responsible for all general tasks concerning surveying and geoinformation. I carried out the following interview with Nikolaus Batlogg, Marion Heinzle, Johannes Kanonier and Martin Studer from the LVG as representatives for the administration wide GIS group that was involved in a project in 2011/12 to substitute the still widely-used ArcView 3.x for QGIS. Besides QGIS other FOSSGIS components especially server applications had been integrated to into the GIS environment of Vorarlberg’s administration previously.

TS: Could you briefly introduce yourselves and the positions you hold at Vorarlberg?

Nikolaus Batlogg (NB): MSc in Meteorology and Geophysics. Due to my former job, experience in Network and Server Administration and Configuration (MS-Windows, mostly Linux and IBM/OS2, Mac OSX) and a little bit programming (C, Visual Basic, Fortran and Perl). Since 2003 I’m working as a GIS Technician for LVG. Due to my former experience I slid again into the IT. Together with Andreas Siegel (AS) I am responsible for the technical infrastructure: GIS Server Configuration and Administration (Linux and MS), web-services, our GDI, programming with ArcObjects and now with QGIS.

Marion Heinzle (MH): MSc in Geography and Mathematics. Before I joined the LVG team in 2009 I have been working part time as a teacher for mathematics and part time as a GIS technician for the state administration of Tyrol. My main duties in our team are planning, organising and holding GIS education, providing relevant information to our users and organise the transfer of knowledge in general.

Johannes Kanonier (KA): MSc in Surveying, Photogrammetry and Remote Sensing, postgraduate degree in Environmental Studies: I started in 1993 in the environmental protection department and became GIS coordinator for the state administration in 1998. After a reorganisation in 2004 the general GIS group (me and a colleague at that time) joined the LVG, since 2011 I am the head of the GIS division in the LVG. I was in charge of the project management for the substitution of ArcView 3.x.

Andreas Siegel (AS): MSc in Meteorology and Geophysics. In my former job I worked as developer for banking software for almost 10 years. In 2009 I changed to the LVG. According to my experience in programming (mostly C) and Linux administration the main focus of my job is, together with Nikolaus, the technical infrastructure of our GIS and also database administration.

Martin Studer (ST): Federal Secondary College of Engineering graduation. One of my main duties is the data dissemination and the support of our customers in this context. In our department I am also the general and first contact person to the central IT department of the state administration.

image0

Johannes Kanonier

image1

Nikolaus Batlogg

image2

 Martin Studer

image3

Marion Heinzle

image4

Andreas Siegel

TS: Could you tell us a little about the administration of Vorarlberg? What kind of resources do you manage and what is the size of the population you provide services for?

LVG: Vorarlberg is the westernmost and with 2,600 km² the second smallest federal state (Land) of Austria. The region shares its frontiers with the Swiss cantons of St. Gallen and Graubünden, the German state of Bavaria, the Principality of Liechtenstein and the Austrian state of Tyrol. At present 372,000 people are living in Vorarlberg. Since 1900 Vorarlberg’s population has climbed by 185 %, a growth rate higher than any other state in Austria. The Rhine Valley is the second most densely populated region in Austria, right behind Vienna. Vorarlberg is politically structured by 96 municipalities in 4 districts.

The general administration of the State of Vorarlberg employs around 1,600 persons. In accordance with the principles of modern administration management it is managed as a service provider. The State administration does more than just execute State law. It also implements federal law and fulfils a wide range of tasks of the State and federal governments in the form of private enterprise administration. The work of the State administration thus ranges, for example, from the granting of commercial licences to the granting of social welfare benefits, vehicle registration, planning permission, landscape and environmental protection matters and promotion of agriculture right up to the restoration of old buildings. As an internal service provider the department “Landesamt fuer Vermessung und Geoinformation” (LVG) is the central contact point in all questions concerning surveying and geo-information. In our department we are 20 employees working in the two divisions surveying and GIS.

The general tasks in the GIS division are

  • to capture own basic geodata (e.g. digital orthoimages, DEMs) or provided by third parties (e.g. cadastral information)
  • to collect and disseminate all administrational geoinformation
  • provide appropriate tools and the knowledge for the use of geo-information

At the moment we handle 1.5 TB of geodata: orthoimages 900GB , laserscanning DEM(s) 400GB, vector data 200GB

TS: Could you explain how your GIS group is setup? What staffing levels do you have, what are the key technologies you use?

LVG: We are 8 employees in the GIS group of the LVG, 7 hold an academic degree either in geodesy, geography, meteorology and geophysics or landscape planning, one person has a federal college of engineering degree.

Our GIS group works closely with 10 more GIS technicians in several other departments that have a high demand for spatial information (e.g. regional planning, road construction, water management, environmental protection). In this way the GIS in the state administration of Vorarlberg is organised in a network with the LVG as the leading hub in its centre.

In our group everybody has to be an all-rounder to a certain extent as we try to support the reliability of our services with an extended substitution plan. Nevertheless everybody has some key tasks, e.g. three persons are mainly responsible for the infrastructure, one person mainly for the acquisition of the basic geodata, one person mainly for training and transfer of knowledge, three persons for data delivery and support and so on.

Regarding key technologies we distinguish between the specialized information systems of the departments on the one hand where specific geodata is captured, updated and analysed and the collection and general dissemination of geodata on the other hand:

  • The departments decide in general on their own which information system the use and GIS is sometimes only a secondary aspect. So the spectrum of key technologies in the different information systems varies, not only but predominantly ESRI ArcGIS. In the emergency communication department for example an Intergraph application is in use.
  • The key for us to be successful as a central data provider is the commitment of all departments to deliver their geodata in open standard formats, which can be interpreted by the most commonly used GIS and the main CAD programs, e.g. shape simple features for vector data. With the collection, the central hosting and the dissemination of the administrational geodata we aim to deliver open, ready and easy to use geo-information internally, to our contractors and also to the public. This is our main task and for this purpose we use a wide range of applications, more and more FOSSGIS components.
TS: What kind of services do the GIS group provide both internally and to the citizens of Vorarlberg?

LVG:

Data Services:

  • Capture of basic geodata (e.g. digital orthoimages, DEMs, historical maps)
  • Central Hosting of administrational geodata
  • Data Download via SSH/SFTP
  • “R&D-harddisk” for educational institutions with all our geoadata

Web Services for most of the available data:

  • WMS, some WFS

Applications:

  • GIS Web Application “Vorarlberg Atlas” for the public and an internal “Pro”-Version
  • Desktop-GIS, adaption and extension

We deliver our data also manually in response to direct request mainly from contractors of the public administration. In addition to the technologies we provide training, information, communication, transfer of knowledge to our users.

Having a leading role in the cooperation between the state administration and all the municipalities in Vorarlberg we provide the basic GIS-infrastructure including our central data storage in a corporate network and share it with the communal administrations.

TS: What kind of effort has gone into building your FOSS based GIS? Who were the key people involved in the different aspects of the system?

LVG:

The story started long before the first implementation of FOSSGIS components in 2007 with a few simple decisions concerning our central GIS data storage, mainly the decision to maintain the file-system and to migrate our data from proprietary formats to open standards (e.g. shape), which should support our open government efforts.  As the data basis is the core of every GIS the measure to get independent of proprietary formats and specific software producer in this part of our GIS was a very important step forward and put us in the position to consider FOSSGIS technologies in all decisions concerning the development and adaption of our GIS infrastructure. In this way we have been able to substitute for example the main proprietary server applications with Open Source software during the last years (e.g. ArcGIS Server with MapServer).

In this way it opened also the door for OpenSource when we had to decide about the successor product of ArcView 3.x The initial phase of the project included an observation of the software market where we checked a large amount of different, mainly open source software packages. GIS is identified and recognized as a cross-section topic and fortunately GIS is regarded as an integral part of the entire IT nowadays. In this context we have to emphasize our strong cooperation with the general IT department which it is crucial for our success. It is important that we act in accordance with the general IT conditions. It is also obvious to rely on the assistance of the general IT as it would be impossible for us to carry out projects in such large scales on our own.

The GIS technicians of the special department have a key role in all the projects. On one hand they provide the content of our central data storage to a large extent and on the other hand they support a large amount of users in their own surrounding So to say they are also the spokesmen for all our changes and innovations.

TS: Could you describe your deployment of QGIS? How long ago did you start using it, what were you using before? How many people use it, and what kind of activities do they carry out?

LVG:

The title of the project that led to the deployment of QGIS was “Substitution of ArcView 3.x”. During the 15 years of use the standard program of ArcView 3.x had been permanently enhanced with an extensive menu for easy loading and visualization of data, a standard layout, some search routines and other functions. When we started the project in late spring of 2011 we were nevertheless quite surprised to find out that we still had almost 300 ArcView users spread over our entire administration although our WebGIS was very well established for years and very popular and widely used. ArcView was intended for users that need more functionality, stability and performance than our Web Application (like every Web Application) provides. So the goal was clear and so were the needs for the successor product. The new program should start at least were ArcView had got to in the end.

After the specification and evaluation phase we decided in October 2011 to continue with QGIS as the candidate for our new desktop GIS. We started our migration process immediately and the programming, evaluating data access possibilities, special user needs was my main task, including the programming of python plugins to enhance the functionality and provide features to our users, which are not part of QGIS at the moment. In addition, using the API to develop standalone applications for data checks, data updates etc. The rollout was strictly bound to the organisation wide WIN7 rollout which lasted from April to December 2012. So the schedule for development, testing and so on was really tight. We didn’t have any experience with QGIS, neither Qt, neither Python, neither the API before.

In addition all GIS-technicians from all different departments supported the deployment of QGIS by developing QGIS layers and projects for all their different data themes.

Together with the central IT department we developed also the rollout package for the automatic installation during the general Windows7 rollout. All the future updates and upgrades will be carried out with the same procedures.

Another task was the development and organisation of a training program, including the compilation of an extended training manual. We gave 27 one-day trainings for almost 300 QGIS users.

At the moment QGIS is installed on 400 desktops of the state administration. In the meantime in Vorarlberg other administrative organisation of the federal and municipal level and also some enterprises have joined us in our QGIS project and attended for also our trainings. This shows one of the most positive side effects we did not encounter at first: QGIS provides us the opportunity to deliver a complete and cost free GIS package (data and application) to our partners, to our contractors and to the public. This is open government in its best sense.

On the whole the state of Vorarlberg invested at least 3 person years and € 50,000 for development purposes.

ArcView menu

Above - ArcGIS menu

QGIS menu

 Above: QGIS Menu

TS: Did you customise QGIS using plugins or by adding core functionality in order to achieve your goals? If so what kind of customisations did you carry out?

LVG:

Both. For the first part – core: Support for Measured Shapes, Oracle Spatial Provider (just finished) . For the second part – Plugins: A tool that makes the access to our central data pool much easier. It also includes functionality for searching inside the data, easy loading and displaying special information. Improvements for joining tabular data in QGIS (like in ArcView), Linear Referencing (Sourcepole). Some of them are already available on the official QGIS repository, others will follow as soon as they are multilingual and usable.

TS: What kind of issues do you encounter with QGIS, or has it all been plain sailing?

NB:

A very difficult question – because it was almost really plain sailing. Of course that was steep and high mountain we had to climb (we didn’t have any experience with QGIS, neither QT, neither Python, neither the API before). But beside our problem of too less knowledge we had success. One important part of this access is that QGIS is - and provides - a sophisticated framework.

Without that, we would have had no chance. QGIS has some smaller bugs that are unavoidable for a complex application. But we can report them. One personal issue we have is: Loading shapefiles over the network is rather slow compared with ArcView. We suppose, the reason is latency in our network in combination with a lot of communication QGIS does in addition to the loading process? But, the conclusion is: QGIS was the right choice.

TS: If you had to rewind the clock and start your QGIS deployment again, is there anything you would have done differently? What advice based on your experiences would you give to others?

LVG:

No. Advice: Don’t be conservative or ignorant. Only because proprietary software is more expensive than Open Source, it doesn’t have to be better. Conversely, Open Source can be a much better choice, as we found in QGIS. Spend the money for service (the work people do) not for software licence.

TS: Vorarlberg sponsored QGIS in 2011 – what motivated you to do this and was it a worthwhile thing to do? Was it difficult to get your bosses to agree to this?

LVG:

As ArcView 3.x has been used over a period of more than 15 years our decision for QGIS is based on long term considerations. In this context we see it as our duty to make regular contributions to ensure a prosperous development of the whole QGIS project. Like in 2011 it is our aim for 2013 and further on to sponsor QGIS directly with a certain amount of money and indirectly by placing orders for certain developments and enhancements that are useful for our, and hopefully for a lot of other user’s purposes.

The decision to introduce QGIS in our GIS environment has been very well prepared and is approved by all key persons in our administration regarding both the decision level and the user level.

TS: What has your approach been in order to get support for your QGIS deployments? Do you find all the help you need from the community, or have you made use of commercial support providers too?

LVG:

Till now, we didn’t need commercial support for QGIS itself. We had and have commercial support for certain development Tasks – e.g. the Linear referencing Plugin. For the most of my programming we use the QT class reference and the QGIS class reference. In most cases we can manage it that way. If not, we try to get help from the internet or at http://gis.stackexchange.com

A lot of information about our department and about the state administration of Vorarlberg (unfortunately all in German) you find at www.vorarlberg.at/lvg

installing Postgis 2.0 under Debian wheezy

We’ll be using Postgis2.0 from UbuntuGIS, which has packages for a number of recent Ubuntu releases. Since Ubuntu precise has libc6 2.14 and Debian wheezy only 2.13 we fall back on Ubuntu oneiric for packages, which also has libc6 2.13.

However Postgis 2.0 in UbuntuGIS depends on a lot of llibraries which were in squeeze but live in wheezy under a higher version. Therefore we’ll install a lot of packages from Debian squeeze. Fortunately the libraries are versioned themselves and thus can be installed along the libraries from Debian wheezy.

Let’s go. Add the Debian squeeze sources:

# SRC="deb http://ftp.ch.debian.org/debian/ wheezy main"
# echo "$SRC" >> /etc/apt/sources.list

We’ll also add the security source, in case Debian releases a security update.

# SRC="deb http://ftp.ch.debian.org/debian/ wheezy main"
# echo "$SRC" >> /etc/apt/sources.list

You may want to replace ftp.ch.debian.org by a debian mirror nearer to you.

Now add the UbuntuGIS sources:

# SRC="deb http://ppa.launchpad.net/ubuntugis/ubuntugis-unstable/ubuntu oneiric main"
# echo "$SRC" > /etc/apt/sources.list.d/ubuntugis.list

Now update and try to install postgis:

# apt-get update
# apt-get install postgresql-9.1-postgis

Create your database:

# sudo su
# su - postgres
$ psql postgres
postgres=# CREATE DATABASE your_db OWNER your_preferred_user:

Now add the postgis features to that database:

$ psql -d your_db -f /usr/share/postgresql/9.1/contrib/postgis-2.0/
$ psql -d your_db -f /usr/share/postgresql/9.1/contrib/postgis-2.0/spatial_ref_sys.sql

That should be it. Let’s hope it works.

A final warning: you are mixing multiple distributions here. This can lead to problems. Due to version conflicts upgrading packages can become very difficult.

Tomáš Pospíšek tpo_hp@sourcepole.ch

ColorBrewer NoFlash-Version

Did you know that there is a version of ColorBrewer that does not require Flash?

Enjoy! Pure Javascript and zero loading times: http://colorbrewer2.org/js/

colorbrewerjs


Leaving! Getting a New QGIS Job!

This week is my last week at Southern Downs Regional Council. On Monday I'm starting a new job. A QGIS related job. WIN!

I have worked at Southern Downs Regional Council for the last seven years and have been grateful for every year. The people, the work, the experience, has all be excellent. It has been a great seven years and I never imagined that I would be leaving, maybe at the ten year mark, but here it is. Starting at SDRC right out of high school without any skills or knowledge of what GIS is or was I grew to love it very quick. Learning GIS, evidently, lead me to programming. Nothing to crazy at first, some VBA here, some MAPBASIC there, MapInfo added the ability to call .NET dlls so I got into VB.NET, which lead me to C#, QGIS entered about three years ago which started me down the road of C++ and Python. Throw in some GPS surveying, data collection, database stuff, bushfire mapping, planning scheme mapping, floods, and you have yourself a nice skill set that you never expected to learn - hell some early school teacher even told my parents I would never do anything useful because "I only did computers".

So enough with the rambling personal history lesson and more about the new stuff. My new job is a Technical Consultant/QGIS Specialist with Digital Mapping Solutions(DMS), a great - of course they are great why else would I work for them - Australian GIS company. DMS were/are the sponsors of the QGIS MS SQL provider and run QGIS training courses around Australia. My new role will be focused around QGIS and QGIS clients in Australia, although it's not limited to that. I'm really looking forward to promoting, using, and helping other people use QGIS in Australia. I really do think there is a good market for it here, and if the growing interest over the last year is anything to go by I feel it is going to be a really interesting year. Working from home, meeting new people, learning awesome skills, pimping QGIS, what's not to love!

My blog will continue as normal, if not more. Expect to see more QGIS in Australia, hopefully we can get some regular meetups happening.

I do have to give credit to the QGIS team and community. Without the great team and community around QGIS I very much doubt any of this would have happened

OSM Reporter Update for Open Data Day 2013

Today is Open Data Day 2013. I did’t have much time to hack, but I made a few tweaks to my ‘just for fun’ osm-reporter project to provide average, min and max counts per active day for each user. I also did a bunch of code cleanups under the hood which probably nobody except me... Read more »

  • <<
  • Page 89 of 142 ( 2821 posts )
  • >>

Back to Top

Sustaining Members